Journal of Chemical and Pharmaceutical Research, 2017, 9(4):171-179
Research Article
CODEN(USA) : JCPRC5
ISSN : 0975-7384
171
Spectroscopic Studies and Thermal Analysis on Cefoperazone Metal
Complexes
Mamdouh S Masoud
1, Alaa E Ali
2*, Gehan S Elasala
2and
Sherif A Kolkaila
21Chemistry Department, Faculty of Science, Alexandria University, Egypt 2
Chemistry Department, Faculty of Science, Damanhour University, Egypt
_____________________________________________________________________________
ABSTRACT
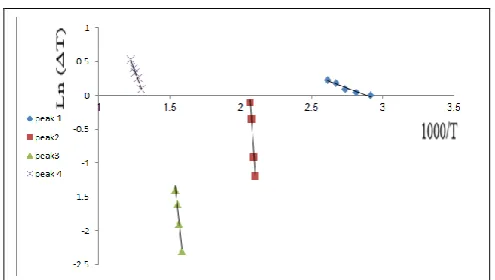
The metal complexes of cefoperazone with transition metals (Cr(III), Mn(II), Fe(III), Co(II), Ni(II), Cu(II), Zn(II), Cd(II) and Hg(II)) were synthesized. From IR spectra proved that cefoperazone acts as bidentate ligand. The active sites for coordination of cefoperazone were confirmed by using the hyper-chemistry program. The magnetic measurement and spectral data proved octahedral structure for all complexes except that of Ni, Cu and Hg, those have tetrahedral structural. The thermal decomposition mechanisms of the prepared complexes were studied and suggested. The kinetic and thermodynamic parameters of the thermal decomposition steps, Ea, ∆H*and ∆S*, were estimated from DTA thermograms. Cefoperazone complexes showed higher activity than commercial cefoperazone for some strains.
Keywords: Cephalosporinscomplexes; Cefoperazone; Thermal analysis; Biological screening
_____________________________________________________________________________
INTRODUCTION
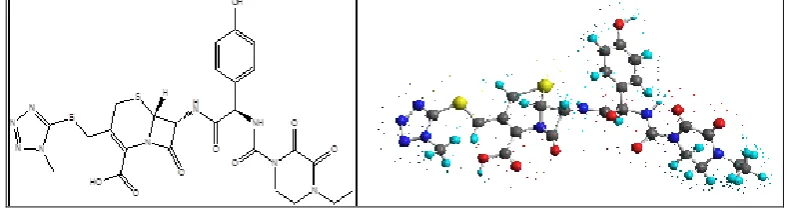
Cephalosporins are classified to five generations according to antimicrobial activity where the later generations have greater activity towards Gram-negative bacteria than older generations [1]. The role of cephalosporins is inhibition of bacterial cell-wall synthesis. Production of betalactameses can damage the betalactam ring and make cephalosporins inactive [2]. Cefoperazone (Figure 1) is a third generation cephalosporin antibiotic, which has higher activity towards gram negative and lower activity towards gram positive. Cefoperazone is marketed under brand names cefobid and cefrone.
[image:1.595.100.495.632.736.2]Cefoperazone is characterized by higher efficacy in treating Pseudomonas bacterial infections. Also cefoperazone is used for treating infections of the respiratory and urinary tract. Previous work in cefoperazone metal complexes fell to synthesis cefoperazone complexes with (Cr, Mn, Zn and Hg) [3]. The complexion properties, thermal behavior and antibacterial activity of cefoperazone and their metal complexes are discussed. Cefoperazone can form five-membered ring with metal ion during formation of complexes which give high stability for the synthesized complexes. From DTA and TG curves the mechanism of decomposition is explained and the thermodynamic parameters are evaluated and discussed.
172
EXPERIMENTAL SECTION
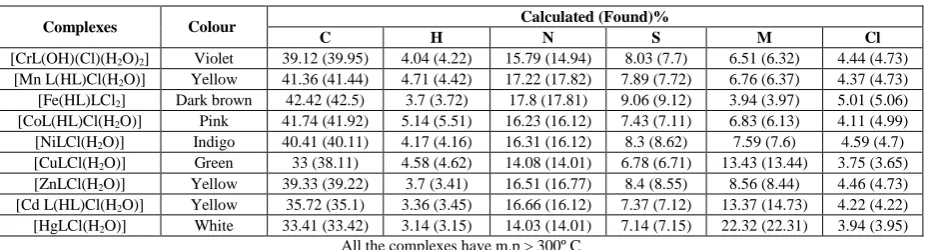
Cefoperazone (standard pure drug) was obtained from the Egyptian company Epico. All complexes were synthesized by dissolving the metals [Cr(III), Mn(II), Fe(III), Co(II), Ni(II), Cu(II), Zn(II), Cd(II) and Hg(II)] as metal chlorides in 40 ml ethanol. Cefoperazone was dissolved in 40 ml bidistilled water. The prepared solution of cefoperazone was mixed with each ethanolic solution of each metal chloride with molar ratio 1:1. The reaction mixture was refluxed for about 5 min then left over-night; coloured products precipitated and were isolated by filtration. The products were washed with water and EtOH-H2O and dried in a vacuum desiccator over anhydrous CaCl2. The analytical studies (Table 1) of all the synthesized complexes were done by the usual methods [4]. The metal contents were determined based on atomic absorption technique using model 6650 Shimadzu-atomic absorption spectrophotometer and complexometrically with standard EDTA solution using the appropriate indicator as reported [5]. The analysis of chloride contents of the complexes were determined by applying the familiar Volhard method [6]. The proposed structures of synthesized metal complexes were illustrated in Figure 2.
Physical Measurements
[image:2.595.67.534.436.561.2]IR spectra of the cefoperazone and their metal complexes were recorded on Perkin Elmer spectrophotometer, Model 1430 which it is range of 200-4000 cm-1. Spectra of cefoperazone and the solid complexes were measured in Nujol mull spectra by use Unicam UV/Vis spectrometer [7]. The correction of Molar magnetic susceptibilitiesby using Pascal’s constants were determined at room temperature (298 K) using Faraday’s method. ESR spectra were recorded on reflection spectrometer operating at (9.1–9.8) GHZ in a cylindrical resonance cavity with 100 KHZ modulation. The g values were determined by comparison with DPPH signal. Differential thermal analysis (DTA) and thermogravimetric analysis (TGA) of the ligand (cefoperazone) and their complexes were recorded on Shimadzu DTA/TGA-60 thermal analyzer with heating rate 20°C/min under nitrogen atmosphere of flow rate 20 ml/min. The biological screening of cefoperazone and their metal complexes were examined against 5 microorganisms representing different microbial categories, {two Gram-positive (Staphylococcus Aureas ATCC6538P and Bacillus subtilis ATCC19659), two Gram negative (Escherischia coli ATCC8739 strain and Pseudomonas aeruginosa ATCC9027) and candida albicans as a fungi. Hyperchem computer program using PM3 semi-empirical and Molecular Mechanics Force Field (MM+) is applied for ligand.
Table 1: Elemental analysis, m.p., formula, stoichiometries and colour of cefoperazone complexes
Complexes Colour Calculated (Found)%
C H N S M Cl
[CrL(OH)(Cl)(H2O)2] Violet 39.12 (39.95) 4.04 (4.22) 15.79 (14.94) 8.03 (7.7) 6.51 (6.32) 4.44 (4.73) [Mn L(HL)Cl(H2O)] Yellow 41.36 (41.44) 4.71 (4.42) 17.22 (17.82) 7.89 (7.72) 6.76 (6.37) 4.37 (4.73) [Fe(HL)LCl2] Dark brown 42.42 (42.5) 3.7 (3.72) 17.8 (17.81) 9.06 (9.12) 3.94 (3.97) 5.01 (5.06) [CoL(HL)Cl(H2O)] Pink 41.74 (41.92) 5.14 (5.51) 16.23 (16.12) 7.43 (7.11) 6.83 (6.13) 4.11 (4.99) [NiLCl(H2O)] Indigo 40.41 (40.11) 4.17 (4.16) 16.31 (16.12) 8.3 (8.62) 7.59 (7.6) 4.59 (4.7) [CuLCl(H2O)] Green 33 (38.11) 4.58 (4.62) 14.08 (14.01) 6.78 (6.71) 13.43 (13.44) 3.75 (3.65) [ZnLCl(H2O)] Yellow 39.33 (39.22) 3.7 (3.41) 16.51 (16.77) 8.4 (8.55) 8.56 (8.44) 4.46 (4.73) [Cd L(HL)Cl(H2O)] Yellow 35.72 (35.1) 3.36 (3.45) 16.66 (16.12) 7.37 (7.12) 13.37 (14.73) 4.22 (4.22) [HgLCl(H2O)] White 33.41 (33.42) 3.14 (3.15) 14.03 (14.01) 7.14 (7.15) 22.32 (22.31) 3.94 (3.95)
All the complexes have m.p > 300º C
RESULTS AND DISCUSSION
173
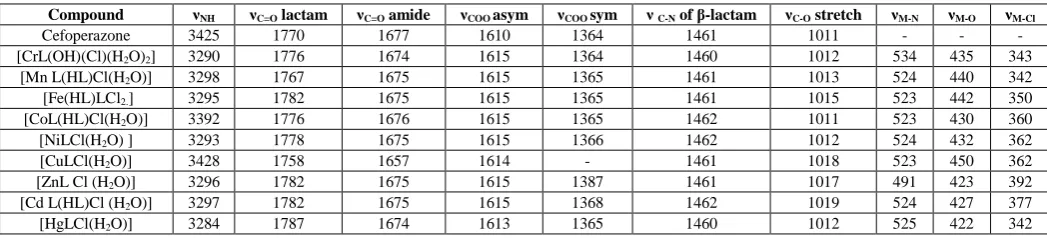
of β-lactam ring (1461cm-1) and νC-O of methoxy group (1101 cm-1) in the free ligand remain unchanged on complexation. The band at 1610.09 cm-1, corresponding to the carboxylate asymmetrical stretching of the free ligand, is shifted (1- 4 cm-1) to higher wave numbers in the spectra of the complexes indicating coordination through this group[10]. A carboxylate ligand can bind to the metal either monodentate or bidentate, giving changes in the relative positions of the antisymmetric and symmetric stretching vibrations [11]. The IR spectra of the complexes give a separation value of more than 200 cm-1 suggesting monodentate carboxylate. The remaining carboxylate bands νCOO (symm), γ (COO), ρ(COO) and ω(COO), formerly at 1364.33, 756, 609.76 and 530.00 cm-1 , respectively, the change in position is a result of coordination. The νC-O band observed at 1513.35 cm-1 in free cefoperazone appears at 1513 cm-1 in the metal complexes so that, the shifting was not significant. In the far IR spectra, the bonding of nitrogen and oxygen is provided by the presence of bands at 450.37 cm-1 (M-N) and 464.22-495.61 cm-1 (M-O) [12].
Table 2: Fundamental infrared bands (cm-1) of cefoperazone and its metal complexes
Compound νNH νC=O lactam νC=O amide νCOO asym νCOO sym ν C-N of β-lactam νC-O stretch νM-N νM-O νM-Cl
Cefoperazone 3425 1770 1677 1610 1364 1461 1011 - - -
[CrL(OH)(Cl)(H2O)2] 3290 1776 1674 1615 1364 1460 1012 534 435 343
[Mn L(HL)Cl(H2O)] 3298 1767 1675 1615 1365 1461 1013 524 440 342
[Fe(HL)LCl2.] 3295 1782 1675 1615 1365 1461 1015 523 442 350
[CoL(HL)Cl(H2O)] 3392 1776 1676 1615 1365 1462 1011 523 430 360
[NiLCl(H2O) ] 3293 1778 1675 1615 1366 1462 1012 524 432 362
[CuLCl(H2O)] 3428 1758 1657 1614 - 1461 1018 523 450 362
[ZnL Cl (H2O)] 3296 1782 1675 1615 1387 1461 1017 491 423 392
[Cd L(HL)Cl (H2O)] 3297 1782 1675 1615 1368 1462 1019 524 427 377
[HgLCl(H2O)] 3284 1787 1674 1613 1365 1460 1012 525 422 342
Electronic Spectral and Magnetic Studies
The electronic absorption spectra for the violet chromium-complex, [CrL(OH)(Cl)(H2O)2] had three bands at 278, 410, 547 nm due to 4A2g→4T2g (F),
4
A2g→4T1g(F) and 4
[image:3.595.35.559.218.337.2]A2g→4T1g(p) transitions, respectively, (Table 3). So the complex has octahedral geometries. Such Oh geometry is further deduced from the µeff values which equals, 3.40 B.M, respectively [13]. However, the yellow electronic absorption spectrum of manganese-complex, [Mn L(HL)Cl(H2O)], (Table 3), had three bands , 424.8, 446.2, 693.2 where the first band is assigned to 6A1g→4A1g , while the second is due to 6A1g→ 4T2g transition and the last band is due to 6A1g→4T1g transition. Its room temperature µeff value of 4.92 and, typified the existence of Oh configuration. The brown electronic absorption spectra of iron-complex, [Fe(HL)LCl2.], (Table 3), had bands at 357, 422, 518 nm,. These bands are due to CT (t2g → π*) and CT (π →eg) with µeff value of 5.9, typified the existence of Oh configuration. The electronic absorption spectra of [CoL(HL)Cl(H2O)], (Table 3), gave bands at 278, 410, 542, nm. Bands are of charge transfer nature and the latter broad bands are assigned to 4T1g(F) → 4T2g(P) transition with magnetic moment value equal to 5.85 typified the existence of the complex in Oh geometry for cefoperazone [14]. The green electronic absorption spectra for Nickel-complex, [NiLCl(H2O)] showed three bands at 248, 426, 638 nm due to - *, 3T1(F)→3T1(P) and 3T1(F)→3A2 transitions, respectively (Table 3).
Table 3: Nujol mull electronic absorption spectra λ max (nm), room temperature effective magnetic moment values (µeff 298°K) and
geometries of cefoperazone metal complexes
Complex λ max (nm) µ eff Geometry
[CrL(OH)(Cl)(H2O)2 ] 278,410, 547 3.4 Oh [Mn L(HL)Cl(H2O)] 205, 424, 446, 693 4.92 Oh [Fe(HL)LCl2.] 357, 422, 518 5.7 Oh [CoL(HL)Cl(H2O)] 301, 426, 516 5.85 Oh [NiLCl(H2O) ] 248, 426, 638 2.78 Td [CuLCl(H2O)] 254, 425 1.75 Td [ZnL Cl (H2O)] 427 diamagnetic Td [Cd L(HL)Cl (H2O)] 335 diamagnetic Oh [HgLCl(H2O)] 344 diamagnetic Td
174
Figure 2: Proposed structures of cefoperazone complexes
[image:4.595.178.417.352.496.2]From hyper-chem program charge density of cefoperazone atoms is calculated, Figure 3 confirmed cefoperazone coordination through the carboxylates, which has highest charge.
Figure 3: Charge density of cefoperazone atoms
Electron Spin Resonance of Copper Complex
The room temperature polycrystalline X-band ESR spectral pattern of [CuLCl(H2O)] complex, Figure 4 is axial compressed nature. The spectral analysis of this complex gave two g values g11= 2.25 and g1= 2.015. The calculated <g> value=2.17. While the low value of f2 shows strong axial field.
Figure 4: ESR of [CuLCl(H2O)]
RESULTS AND DISCUSSION
Biological Activity
In this study, 5 microorganisms representing different microbial categories, {two Gram-positive (Staphylococcus Aureas ATCC6538Pand Bacillus subtilis ATCC19659), two Gram negative (Escherischia coli
[image:4.595.178.418.566.667.2]175
cefoperazone and 2 complexes of different metal ions (Zn and Cu)} which are applicable for human person. Two different broadly antibiotics (Ciprofloxacin and Clotrimazole) are used in this study as references. Table 4 allows the following observations and conclusions:
All the investigated compounds have higher positive antibacterial activity compared to antifungal activity. [CuLCl(H2O)] showed similar activities for Pseudomonas aeruginosa and Escherischia coli. While it have higher activity to, Candida albicans,Staphyllococcus aureus and Bacillus subtilis. It revealed by the diameter of its inhibition zone. On the other hand, [ZnLCl(H2O)] complex showed higher activity to Escherischia coli, Candida albicans and Bacillus subtilis. It showed activity in the same range of cefoperazone for Pseudomonas aeruginosa.
Most of the metal complexes have higher activitythan the free ligands such increased activity of the metal chelates could be explained on the bases of overtoneۥs concept and chelation theory [16]. The cell permeability the lipid membrane that surrounds the cell favours the passage of only lipid soluble materials on the basis that liposolubility is an important factor that controls antimicrobial activity. On chelation, the polarity of the metal ion is reduced to a greater extent due to the overlap of the ligand orbital and partial sharing of the positive charge of the metal ion with the donor groups. Further, it increases the delocalization of p- and d-electrons over the whole chelate and enhances the lipophilicity of the complex. The increased lipophilicity enhances the penetration of the complexes into lipid membranes and blocking of metal binding sites on the enzymes of the microorganism.
Table 4: The antifungal activity of the free cefoperazone and its complexes against some reference strains expressed in absolute activity (AU)
Complexes Blank Candida albicans Escherischia coli Pseudomonas aeruginosa Staphyllococcus aureus Bacillus subtilis
[CuLCl(H2O)] 8 14 12 8 12 11
[ZnLCl(H2O)] 8 16 14 8 14 17
Cefoperazone 8 12 12 8 12 11
Ciprofloxacin 9 30 30 30 30 -
Clotrimazole 10 - - - - 17
Thermal Analysis
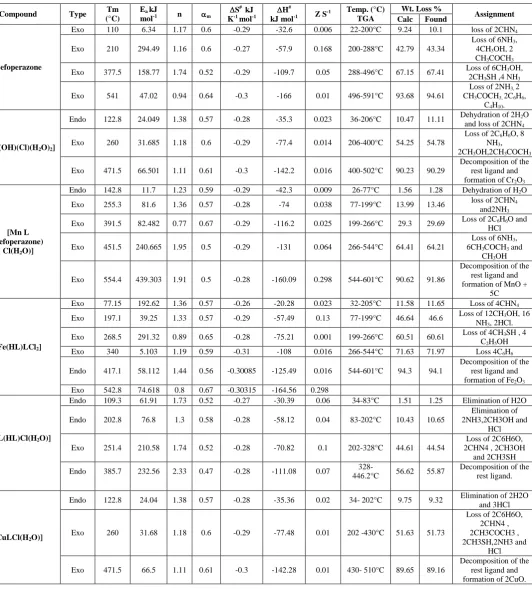
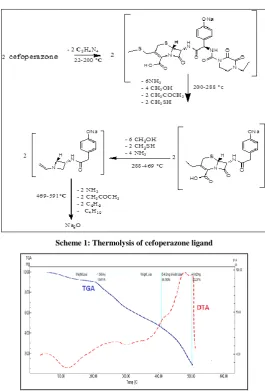
[image:5.595.140.455.524.654.2]The thermal behavior of some biologically active compounds has been reported from Masoud et al. [17-20]. The thermal behavior of was investigated by thermograms (TG and DTA), Figure 5 and the corresponding thermal analysis data is presented in Table 5. In case of cefoperazone, the decomposition occurs in four exothermic steps 50-600°C range. There is no mass loss up to 200°C. The first stage of decomposition starts at 22°C and ends at 200°C with a corresponding weight loss 10.1%, Which is accompanied by exothermic effect in the DTA curve. The second stage of decomposition is observed at 201-288°C (43.43% wt loss). Meanwhile the DTA curve exhibits exothermic effect in the range 210°C which is accompanied by weight loss confirming. The third stage of decomposition starts at 289°C and ends at 496°C with a corresponding weight loss 67.41% which is accompanied by exothermic effect in the DTA curve. The last stage of decomposition start at 497°C and ends at 400°C (94.61% wt loss) Meanwhile the DTA curve exhibits exothermic effect in the range 210°C which is accompanied by confirmed weight loss. The suggested mechanism is given in Scheme 1.
Figure 5: TGA and DTA of cefoperazone ligand
176
Table 5: DTA analysis of cefoperazone and its metal complexes
Compound Type Tm
(°C)
Ea kJ
mol-1 n m
S kJ K-1 mol-1
H#
kJ mol-1 Z S-1
Temp. (°C) TGA
Wt. Loss %
Assignment Calc Found
Cefoperazone
Exo 110 6.34 1.17 0.6 -0.29 -32.6 0.006 22-200°C 9.24 10.1 loss of 2CHN4
Exo 210 294.49 1.16 0.6 -0.27 -57.9 0.168 200-288°C 42.79 43.34
Loss of 6NH3, 4CH3OH, 2 CH3COCH3 Exo 377.5 158.77 1.74 0.52 -0.29 -109.7 0.05 288-496°C 67.15 67.41 Loss of 6CH3OH,
2CH3SH ,4 NH3
Exo 541 47.02 0.94 0.64 -0.3 -166 0.01 496-591°C 93.68 94.61
Loss of 2NH3, 2 CH3COCH3, 2C6H6,
C4H10.
[CrL(OH)(Cl)(H2O)2]
Endo 122.8 24.049 1.38 0.57 -0.28 -35.3 0.023 36-206°C 10.47 11.11 Dehydration of 2H2O and loss of 2CHN4
Exo 260 31.685 1.18 0.6 -0.29 -77.4 0.014 206-400°C 54.25 54.78
Loss of 2C6H6O, 8 NH3, 2CH3OH,2CH3COCH3
Exo 471.5 66.501 1.11 0.61 -0.3 -142.2 0.016 400-502°C 90.23 90.29
Decomposition of the rest ligand and formation of Cr2O3
[Mn L (cefoperazone)
Cl(H2O)]
Endo 142.8 11.7 1.23 0.59 -0.29 -42.3 0.009 26-77°C 1.56 1.28 Dehydration of H2O Exo 255.3 81.6 1.36 0.57 -0.28 -74 0.038 77-199°C 13.99 13.46 loss of 2CHN4
and2NH3 Exo 391.5 82.482 0.77 0.67 -0.29 -116.2 0.025 199-266°C 29.3 29.69 Loss of 2C6H6O and
HCl
Exo 451.5 240.665 1.95 0.5 -0.29 -131 0.064 266-544°C 64.41 64.21
Loss of 6NH3, 6CH3COCH3 and
CH3OH
Exo 554.4 439.303 1.91 0.5 -0.28 -160.09 0.298 544-601°C 90.62 91.86
Decomposition of the rest ligand and formation of MnO +
5C
[Fe(HL)LCl2]
Exo 77.15 192.62 1.36 0.57 -0.26 -20.28 0.023 32-205°C 11.58 11.65 Loss of 4CHN4 Exo 197.1 39.25 1.33 0.57 -0.29 -57.49 0.13 77-199°C 46.64 46.6 Loss of 12CH3OH, 16
NH3, 2HCl. Exo 268.5 291.32 0.89 0.65 -0.28 -75.21 0.001 199-266°C 60.51 60.61 Loss of 4CH3SH , 4
C2H5OH Exo 340 5.103 1.19 0.59 -0.31 -108 0.016 266-544°C 71.63 71.97 Loss 4C6H6
Endo 417.1 58.112 1.44 0.56 -0.30085 -125.49 0.016 544-601°C 94.3 94.1
Decomposition of the rest ligand and formation of Fe2O3 Exo 542.8 74.618 0.8 0.67 -0.30315 -164.56 0.298
[CoL(HL)Cl(H2O)]
Endo 109.3 61.91 1.73 0.52 -0.27 -30.39 0.06 34-83°C 1.51 1.25 Elimination of H2O
Endo 202.8 76.8 1.3 0.58 -0.28 -58.12 0.04 83-202°C 10.43 10.65
Elimination of 2NH3,2CH3OH and
HCl
Exo 251.4 210.58 1.74 0.52 -0.28 -70.82 0.1 202-328°C 44.61 44.54
Loss of 2C6H6O, 2CHN4 , 2CH3OH
and 2CH3SH
Endo 385.7 232.56 2.33 0.47 -0.28 -111.08 0.07
328-446.2°C 56.62 55.87
Decomposition of the rest ligand.
[CuLCl(H2O)]
Endo 122.8 24.04 1.38 0.57 -0.28 -35.36 0.02 34- 202°C 9.75 9.32 Elimination of 2H2O and 3HCl
Exo 260 31.68 1.18 0.6 -0.29 -77.48 0.01 202 -430°C 51.63 51.73
Loss of 2C6H6O, 2CHN4 , 2CH3COCH3 , 2CH3SH,2NH3 and
HCl
Exo 471.5 66.5 1.11 0.61 -0.3 -142.28 0.01 430- 510°C 89.65 89.16
177
[image:7.595.163.429.63.455.2]Scheme 1: Thermolysis of cefoperazone ligand
Figure 6: TGA and DTA of Cr- cefoperazone complex
In case of [ZnLCl(H2O)]complex (Figures 7 anad 8), the first stage of decomposition starts at 25°C and ends at 200°C with a corresponding weight loss 9.39%, which is accompanied by endothermic effect in the DTA curve in the range 123°C which is accompanied by confirmed weight loss. The second stages of decomposition are observed at 280-400°C (52.36% wt loss), meanwhile the DTA curve exhibits exothermic effect in the range 260°C which are accompanied by confirmed weight loss. The last stage of decomposition start at 420°C and ends at 505°C (91.78% wt loss) meanwhile the DTA curve exhibits exothermic effect in the range 471.5°C which is accompanied by confirmed weight loss. The suggested mechanism is given as follows:
[image:7.595.175.421.559.678.2]178
Scheme (3): Thermolysis of [Zn(cefoperazone)Cl (H2O)] complex 25-200°C N S O O O S N N N N O H N OH NH O N N O O H Zn
H2O
Cl N S O O O S N N NN O H N OH H Zn + N S O O O H N OH H Zn ZnO 280-400°C
aqua chloro (Cefoperazone)zinc(II)
(7-[2-(4-Hydroxy-phenyl)-propionylamino]-3-(1-methyl-1H -tetrazol-5-ylsulfanylmethyl)-8-oxo-5-thia-1-aza-bicyclo[4.2.0]oct-2-ene-2-carboxylic acid)zinc(II)
(7-[1-(4-Hydroxy-benzyl)-vinylamino]-8-oxo-5-thia-1-aza-bicyclo[4.2.0]oct-2-ene-2-carboxylic acid)zinc(II)
420-505°C -H2O - HCl - NH3
O N NH O O O N NH O O
-C2H5OH
-CHN4
-CH3SH
-OH
-CH3SH
-2C6H6
-3CH3
OH-Scheme 2: Thermolysis of [Zn(cefoperazone)Cl (H20)] complex
Scheme (2 ):Thermolysis of [Cr(cefoperazone)(OH)2(Cl)(H2O) ] complex
36 - 206°C
N S O O O S N N N N O H N OH NH O N N O O H Cr H2O
OH
Cl
H2O
2 N S O O O HS O H N OH NH O N N O O H Cr OH Cl N S O O O HS H Cr OH Cl 2 206-400°C
Cr2O3
400- 502°C
2
Choloro hydoxo 3-Mercaptomethyl-8-
oxo-5-thia-1-aza-bicyclo[4.2.0]oct-2-ene-2-carboxylate acid Cr(111) choloro hydroxo
7-[2-[(4-Ethyl-2,3-dioxo-piperazine- 1-carbonyl)-amino]-2-(4-hydroxy-phenyl)- acetylamino]-3-mercaptomethyl-8-oxo-5-thia-1-aza-bicyclo[4.2.0]oct-2-ene-2-carboxylate acid Cr(111)
- 2H2O N N N
N
-2
OH
-2
- 8NH3 -2CH3OH -2CH3COCH3
-4CH3SH
-2HCl -2NH3
-6 CH3OH
179
Figure 8: lnΔT against 103/T relation for cefoperazone ligand (as a representative figure)
CONCLUSION
Cefoperazone metals complexes are synthesized and characterized by different spectroscopic methods. The complexes formed in different Stoichiometry. All have Oh geometry except for (Ni,Cu and Hg) complexs have tetrahedral geometry and these results confirmed by Nujol and ESR spectra. Cefoperazone act as a bidintate ligand. Also have different sites available for coordination which carries more electronegative charges and the computational study confirms these results. Cefoperazone thermal decomposition is terminated by the formation of carbon residue as a final product. The thermal decomposition of the complexes ended with the formation of metal oxides and carbon residue as a final product except for the case of Hg complex. Thermodynamic parameters such as Ea, ∆H*and ∆S*were estimated from DTA curves. Cefoperazone complexes show higher activity than commercial cefoperazone for some strains.
REFERENCES
[1] SY Essack. Pharm Res. 2001, 18(10), 1391-1399.
[2] AG Gilman; LS Goodman. The Pharmacological Basis of Therapeutics, Macmillan Publishing Company, New York, 1985.
[3] JR Anacona; A Bravo; ME Lopez. J Chil Chem Soc. 2013, 58, 1520-1523.
[4] AI Vogel. A Text Book of Quantitative Inorganic Analysis, Longmans, London, 1989.
[5] G Schwarzenbach. Complexometric Titration, Translated by H, Methuen Co., London, Irving, 1957. [6] RH Lee; E Griswold; J Kleinberg. Inorg Chem.1964, 3, 1278-1283.
[7] GB Mohamed; MS Masoud; AM Hindawy; RH Ahmed. J Pharm Sci. 1989, 3(2), 141-145.
[8] MS Masoud; OHA Hamid; ZM Zaki. Trans Met Chem. 1994, 19, 21-24.
[9] K Nakamoto. Infrared and Raman Spectra of Inorganic and Coordination compounds,4th edition, John Wiley, New York, 1986.
[10] H Zegota; M Koprowski; A Zegota. Radiat Phys Chem. 1994, 43(4), 343-348.
[11] MS Masoud; EA Khalil; O Hamid; AA Soayed. Egypt Sci Mag.2005, 2(2), 33-37. [12] MBH Howlader; MS Islam; MR Karim. Ind J Chem. 2000, 39A, 407-409.
[13] A Sreekanth; M Joseph; HK Fun; MRP Kurup. Polyhedron. 2006, 25(6), 1408-1414. [14] EK Barefield; DH Busch; SM Nelson. Quart Rev. 1968, 22(4), 457- 498.
[15] SJ Kirubavathy; R Velmurugan; K Parameswari; S Chitra. Int J Pharma Sci Res. 2014, 5(6), 2508-2517.
[16] MS Masoud; AE Ali; MA Shaker; GS Elasala. Spectrochim Acta. 2012, A90, 93-108. [17] MS Masoud; AE Ali; HM Ahmed; EA Mohamed. J Mol Str. 2013, 1050, 43-52. [18] MS Masoud; AE Ali; GS Elasala. J Mol Stru. 2014, 1084, 259-273.
![Figure 4: ESR of [CuLCl(H2O)]](https://thumb-us.123doks.com/thumbv2/123dok_us/8736876.888856/4.595.172.425.66.306/figure-esr-of-culcl-h-o.webp)