Coding region structural heterogeneity and turnover of
transcription start sites contribute to divergence in expression
between duplicate genes
Chungoo Park and Kateryna D Makova
Address: Center for Comparative Genomics and Bioinformatics, Department of Biology, The Pennsylvania State University, University Park, PA 16802, USA.
Correspondence: Kateryna D Makova. Email: [email protected]
© 2009 Park and Makova; licensee BioMed Central Ltd.
This is an open access article distributed under the terms of the Creative Commons Attribution License (http://creativecommons.org/licenses/by/2.0), which permits unrestricted use, distribution, and reproduction in any medium, provided the original work is properly cited.
Divergent expression of duplicated genes
<p>Gene expression data for duplicated gene pairs in humans provides insights into the regulatory factors affecting the expression diver-gence of these genes and implications for their evolution.</p>
Abstract
Background: Gene expression divergence is one manifestation of functional differences between duplicate genes. Although rapid accumulation of expression divergence between duplicate gene copies has been observed, the driving mechanisms behind this phenomenon have not been explored in detail.
Results: We examine which factors influence expression divergence between human duplicate genes, utilizing the latest genome-wide data sets. We conclude that the turnover of transcription start sites between duplicate genes occurs rapidly after gene duplication and that gene pairs with shared transcription start sites have significantly higher expression similarity than those without shared transcription start sites. Moreover, we find that most (55%) duplicate gene pairs do not retain the same coding sequence structure between the two duplicate copies and this also contributes to divergence in their expression. Furthermore, the proportion of aligned sequences in cis-regulatory regions between the two copies is positively correlated with expression similarity. Surprisingly, we find no effect of copy-specific transposable element insertions on the divergence of duplicate gene expression.
Conclusions: Our results suggest that turnover of transcription start sites, structural heterogeneity of coding sequences, and divergence of cis-regulatory regions between copies play a pivotal role in determining the expression divergence of duplicate genes.
Background
Because of the importance of gene duplication in evolution [1-5], it is crucial to know how duplicate genes diverge and which factors determine their destiny. Recently, genome-wide anal-yses of microarray data [6] have revealed patterns of expres-sion divergence in duplicate genes, which are necessary for understanding the emergence of new functions after gene
duplication. Numerous studies indicated that genes diverge rapidly in their expression after duplication [7-12]. Popula-tion genetic models proposed direcPopula-tional selecPopula-tion and relax-ation of selective constraints as possible forces driving the evolution of expression in duplicate genes, although the rela-tive frequency of these two scenarios in the evolution of para-logs is still being debated [4,5,13]. These population genetic
Published: 28 January 2009
Genome Biology 2009, 10:R10 (doi:10.1186/gb-2009-10-1-r10)
Received: 11 October 2008 Revised: 24 December 2008 Accepted: 28 January 2009 The electronic version of this article is the complete one and can be
models have been implemented under the assumption that two duplicated gene copies are structurally and functionally identical immediately after duplication. However, this assumption is sometimes violated. First, genes duplicated via retrotransposition lose regulatory sequences and include additional sequences at each side (for example, poly(A) tails at 3' terminus and short direct repeats at both termini), so that retrotransposed copies differ from the corresponding parental genes [4,13,14]. Second, tandem duplication by une-qual crossing over might not include the entire coding sequence and/or regulatory elements specifying expression of a parental gene. Indeed, Katju and Lynch [15] demon-strated that more than half of newborn duplicate genes in
Caenorhabditis elegans represent not complete, but rather partial or chimeric duplications. Such structural heterogene-ity may play an important role in rapid expression divergence between human duplicate genes as well; however, it has not been considered in detail in previous studies.
Transposable elements (TEs) represent another factor that might account for the expression divergence of duplicate genes, since several studies provided evidence of TEs altering gene expression. Jordan and colleagues [16] showed that almost 25% of human promoter regions as well as many other
cis-regulatory elements contain, or at least overlap with, TE-derived sequences. This result was later confirmed by another study [17]. A specific example of the importance of TEs in the regulation of gene expression comes from the CYP19 gene, which encodes the aromatase enzyme, important for estrogen biosynthesis [18]. Because of the recent insertion of a long terminal repeat into the first exon of one of the isoforms of human CYP19, the gene gained expression in placenta, while its mouse ortholog has no long terminal repeat and is not expressed there [19].
Finally, alternative promoter usage by duplicate genes should be considered as a mechanism for rapid expression diver-gence. Recent comprehensive studies concluded that many known genes in the human genome are expressed from alter-native promoters [20-23]. Similarly, approximately 22% of genes in the ENCODE regions have functional alternative promoters [24]. The alternative promoters provide a hetero-geneity in tissue-specific expression patterns and levels, developmental activity, and translational efficiency [25-27]. As a result, the use of alternative promoters might be one of the major sources for achieving transcriptome diversity and one of the routes by which duplicate genes acquire divergence in their expression.
To investigate what drives expression divergence of human paralogs on a genome-wide scale, we addressed the following three questions in the present study: how frequently the turn-over of transcription start sites (TSSs) occurs between dupli-cate genes; how often duplidupli-cate gene copies (their coding sequences) differ from each other structurally; and whether the density of copy-specific TEs within cis-regulatory regions
influences expression divergence in duplicated genes. We uti-lized the gene expression profile available for 61 non-redun-dant and non-pathogenic human tissues [28], the largest comprehensive expression profile of human genes available to date, and assessed the contributions of TSS turnover, cod-ing sequence structural heterogeneity, and TE integration to divergence in duplicate gene expression.
Results
Identification of duplicate genes
Utilizing two different methods, FASTA and TRIBE-MCL, we identified 6,536 and 7,027 non-redundant human duplicate gene pairs, respectively (see Materials and methods for details). These pairs represented 3,313 and 3,555 gene fami-lies, respectively. After filtering out duplicate gene pairs with synonymous rate (KS) >2 and/or lacking a start codon, we obtained 2,790 and 2,750 duplicate gene pairs using the former and the latter methods, respectively. A total of 1,600 duplicate gene pairs overlapped between these two data sets (Additional data file 2). All subsequent analyses were carried out for duplicate genes identified with each of the two meth-ods. Because the results were similar, we present the results only for duplicate genes identified with the FASTA method (2,790 gene pairs in group A), as this method is stricter for clustering proteins into families compared with the TRIBE-MCL method [29,30].
From human U133A and GNF1H oligonucleotide arrays [28], we defined 14,505 genes that mapped to probes with a one-to-one correspondence (see Materials and methods), thus mini-mizing cross-hybridization. Among these genes, we were able to detect 2,924 non-redundant duplicate gene pairs belong-ing to 1,792 multiple gene families. After filterbelong-ing out dupli-cate gene pairs with KS >2 and/or lacking a start codon, we obtained 1,015 duplicate gene pairs (group B, representing a subset of group A). In the remainder of the manuscript, we consider duplicate genes of group B when gene expression is investigated and duplicate genes of group A otherwise.
Turnover of TSSs between duplicate genes
pairs. We considered 110 bp (-20 bp to +90 bp) surrounding each TSS (later called the 'TSS region'), because there was a clear peak in the average sequence similarity between TSSs of duplicate genes in this region (Additional data file 3) and because several studies indicated that a region of this size sur-rounding TSSs was well conserved between human and mouse orthologs [32,33]. Sequence similarity between all possible combinations of TSS regions from each duplicate gene pair was considered. If at least one pair of TSS regions had an identity greater than 60%, it was defined as a TSS(s) shared between the two duplicate copies. As a result, 13.6% (153 out of 1,124) of duplicate gene pairs had shared TSSs.
We observed that the relative frequency of gene pairs with shared TSSs decreases with increasing KS, a proxy of time since duplication (Figure 1). The L-shaped distribution observed in Figure 1 implies a rapid turnover of TSSs after gene duplication. Already at KS = 0.1, corresponding to only about 33 million years ago since duplication [34], a mere 64% of duplicate genes share TSSs. Considering an instantaneous
KS rate according to [35] did not alter our results (Additional data file 4).
Interestingly, the turnover of TSSs between human duplicate genes was much more rapid than between human-mouse orthologs. Indeed, for 1,610 human-mouse orthologs consid-ered (see Materials and methods), the mean KS was 0.61 (with a 95% confidence interval of 0.60-0.63), while the proportion of orthologs with shared TSSs was 0.71, several fold higher than the proportion of human duplicate genes with similar KS
(Figure 1).
To estimate the relationship between TSS usage patterns (for example, shared TSSs versus non-shared TSSs) and gene duplication mechanisms, the duplicate genes were divided into three classes: retrotransposed duplicate genes, tandem, and nontandem duplications (see Materials and methods for details). The relative frequencies of gene pairs with shared TSSs in each class were calculated (thus, we analyzed 1,124 non-retransposed genes as above plus 220 retrotransposed genes). Duplicate gene copies in which one of the pair has one exon and the duplicate copy has multiple exons were called retrotransposed duplicate gene copies. We found that among paralogs with shared TSSs, the majority of pairs represented tandem duplicates (Additional data file 1).
The decline in the proportion of group A duplicate gene pairs with shared TSSs (shown in black) depending on the time since duplication (approximated by
KS)
Figure 1
The decline in the proportion of group A duplicate gene pairs with shared TSSs (shown in black) depending on the time since duplication (approximated by KS). The proportion of human-mouse orthologous genes with conserved TSSs is shown for comparison (in gray); in this case variation in KS is due to
regional variation in substitution rates.
0.0 0.2 0.4 0.6 0.8 1.0
[0-0.1) [0.1-0.2) [0.2-0.3) [0.3-0.4) [0.4-0.5) [0.5-2)
Proportion of genes with shared TSSs
Ks
Interestingly, about 30% (67 out of 220) of retrotransposed duplicate gene pairs retained the same TSSs (Additional data file 1). To evaluate whether the retrotransposed gene pairs with shared TSSs tend to undergo stronger purifying selection than those without shared TSSs, the median nonsynony-mous-to-synonymous rate ratios (KA/KS) were compared between these two groups of genes; however, no significant difference was detected (0.475 versus 0.499; P > 0.1, Mann-Whitney U test).
Next, to test whether the turnover of TSSs may contribute to the expression divergence in duplicate genes, the Pearson correlation coefficient of expression values (Rexpression; calcu-lated for 61 non-redundant tissues) between the two copies in each pair was computed and compared among group B dupli-cate gene pairs with shared TSSs versus those without shared TSSs (a total of 581 group B pairs with available TSS data were included in the analysis). Duplicate genes with shared TSSs had significantly higher Rexpression values than those without shared TSSs (0.437 versus 0.080; P < 0.01, Mann-Whitney U test). It is conceivable that the significant difference in R
expres-sion values is due to different synonymous rates in genes with
shared TSSs versus those without shared TSSs. Indeed, we observed that all duplicate genes (belonging to group B) with shared TSSs had KS <0.4, while more than 97% of gene pairs without shared TSSs had KS ≥ 0.4. However, if only genes with
KS <0.4 were considered, the gene pairs with shared TSSs still had higher (but not significantly so) Rexpression values than those without shared TSSs (0.437 versus 0.140; P > 0.05, Mann-Whitney U test).
The 60% identity threshold among the TSS regions that was tentatively inferred from substitution rates between human and mouse ortholog core promoters [36] may be inadequate for estimating the sharing of TSSs among human paralogous genes. Thus, we reclassified the sharing of TSSs between cop-ies of duplicate genes using several identity thresholds (40%, 50%, 70%, and 80%). Although the numbers of duplicate genes with shared TSSs in each bin varied with the threshold, the frequency of gene pairs with shared TSSs decreased over divergent time independent of the threshold used (Additional data file 5), consistent with the pattern observed with the 60% identity threshold (Figure 1). Moreover, regardless of the identity threshold, the Rexpression values were significantly higher in duplicate genes with shared TSSs versus those with-out shared TSSs (data not shown).
Structural heterogeneity in coding regions of human duplicate genes
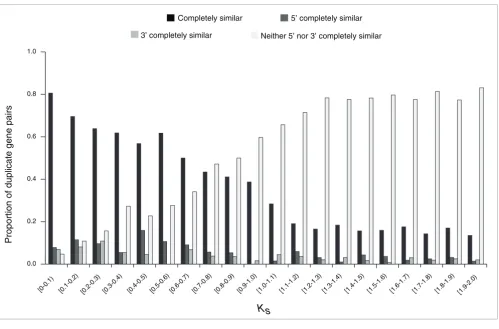
By reconstructing the full-length coding sequences via con-catenating exons from multiple splicing variants for each gene separately, each pair of duplicate genes was classified into one of two structural categories: completely similar and incompletely similar. If the proportion of aligned sequences was greater than 0.9, duplicate gene pairs were categorized as completely similar and as incompletely similar otherwise. For
some analyses, incompletely similar duplicate gene copies were classified in one of the three non-overlapping groups: 5' similar, 3' similar, and neither 5' nor 3' similar. If alignments between the two copies started at the start codons of both copies, then such duplicates were classified as 5' similar. Alternatively, if the alignments ended at the stop codons of both copies, we classified the duplicate genes as 3' similar. The remaining duplicate gene pairs were labeled as neither 5' nor 3' similar.
After excluding genes that lacked start/stop codons or con-sensus splice sites, 2,591 duplicate gene pairs were retained (from 2,790 pairs of group A; for group B, 889 duplicate gene pairs were retained). We found that 55% (1,429 out of 2,591) of duplicate gene pairs had incompletely similar structures. As expected from the divergence of the coding sequence over time, the proportion of duplicate gene pairs with completely similar structures decreased gradually with divergence between the two duplicate copies, approximated by KS (Figure 2). Considering an instantaneous KS rate according to [35] did not alter our results (Additional data file 6). Interestingly, even at the smallest duplicate gene divergence (KS <0.1), the proportion of genes with completely similar structures was only 80% (Figure 2). Although this finding might be affected by misannotations, our results suggest that some duplicate genes might have acquired structural differences during duplication.
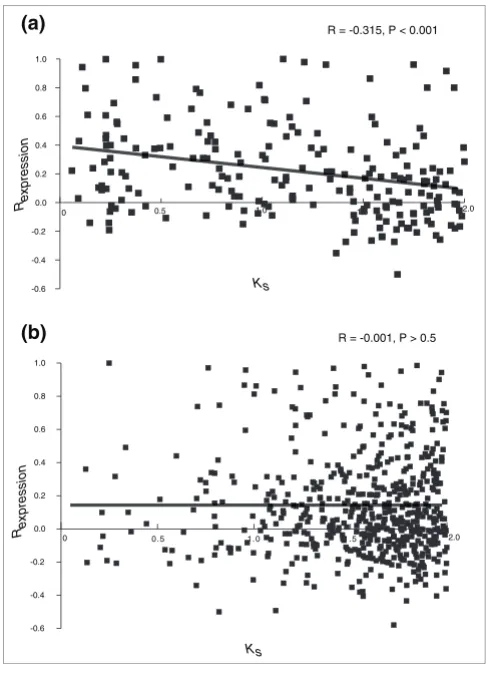
To analyze whether the incompletely similar structures of duplicate genes can lead to expression divergence, we com-pared the relationship between Rexpression and KS for duplicate genes with completely versus incompletely similar structures. Before addressing this issue, retrotransposed duplicate genes (a total of 108 out of 889 genes retained in group B) were excluded because, as retrotransposition does not include a promoter, it can lead to expression divergence regardless of structural heterogeneity in coding sequence between dupli-cates. We found that: the correlation coefficient between R
ex-pression and KS for duplicate gene pairs with completely similar
consid-ered duplicate gene pairs completely similar at the 5' end only (a total of 24 gene pairs from group B that were otherwise genes with incompletely similar structures) and calculated the correlation coefficient between their Rexpression and KS. The correlation was negative, but not significant (Table 1). When duplicate gene pairs having completely similar and 5' similar structures were considered together, the correlation coeffi-cient between Rexpression and KS was somewhat lower than that for duplicate gene pairs with completely similar structures (Table 1), although the difference was not significant (z = -0.093, P > 0.1). We observed that there was no correlation between Rexpression and KS for duplicate genes with 3' similar structure and with neither 5' nor 3' similar structure (Table 1). These results suggest that maintenance of the entire coding region (and not just of its 5' or 3' portion) is important for determining gene expression profile after duplication.
To estimate differences in selective pressure among duplicate genes in different structural categories, their KA/KS ratios were compared (Table 1). We observed that KA/KS was signif-icantly lower for duplicate genes with completely similar structures than for those with incompletely similar structures (P < 0.001, Mann-Whitney U test; Table 1), suggesting that
the former genes are subject to stronger purifying selection than the latter genes.
Divergence of cis-regulatory sequences between duplicate genes
Next, we evaluated the relative contribution of cis-regulatory divergence to differences in expression between copies of duplicate genes in each pair. The 2-kb (from -1.5 kb to +0.5 kb) genomic regions surrounding TSSs were used as putative
cis-regulatory sequences and their divergence was estimated with REALIGNER [37]. For genes with multiple TSSs, a TSS supported by the highest number of CAGE/PET tags was selected. This analysis was limited to group B duplicate genes with completely similar structures (a total of 158 duplicate gene pairs). We found a significant positive correlation (R = 0.242, P < 0.01) between the proportion of aligned sequences in the cis-regulatory region (Pcis) and Rexpression. This implies that the divergence of cis-regulatory regions leads to expres-sion divergence in duplicate genes. After duplicate genes cre-ated by retrotransposition (a total of 23 gene pairs) were excluded, the correlation coefficient was even higher (R = 0.252, P < 0.01). Through comparison between KS (which may serve as a neutral proxy, although see [38]) on the one hand and the proportion (corrected for multiple hits using
[image:5.612.57.556.83.412.2]Proportion of group A duplicate gene pairs classified by coding sequence structural heterogeneity
Figure 2
Proportion of group A duplicate gene pairs classified by coding sequence structural heterogeneity. 0.0
0.2 0.4 0.6 0.8 1.0
[0-0.1) [0.1-0.2) [0.2-0.3) [0.3-0.4) [0.4-0.5) [0.5-0.6) [0.6-0.7) [0.7-0.8) [0.8-0.9) [0.9-1.0) [1.0-1.1) [1.1-1.2) [1.2-1.3) [1.3-1.4) [1.4-1.5) [1.5-1.6) [1.6-1.7) [1.7-1.8) [1.8-1.9) [1.9-2.0)
Proportion of duplicate gene pairs
Ks
Completely similar3’ completely similar Neither 5’ nor 3’ completely similar
HKY85 model) of aligned sequences in the cis-regulatory region on the other hand in each non-retrotransposed dupli-cate gene pair, we estimated whether the cis-regulatory regions evolved neutrally. We found that for 107 out of 135 duplicate gene pairs compared, KS was significantly higher (P
< 0.001, Wilcoxon signed-rank test) than the proportion of
aligned sequences in the cis-regulatory region, suggesting that purifying selection acts at cis-regulatory regions.
To investigate whether copy-specific TEs influence diver-gence in duplicate gene expression, we identified such TEs (TEs that integrated in the cis-regulatory region of only one duplicate gene copy of a pair after duplication) in the same 2-kb regions surrounding TSSs of the above 158 duplicate genes pairs (excluding 23 retrotransposed duplicate pairs; see Materials and methods). However, no significant correlation was found between the proportion of copy-specific TEs and either Pcis for duplicate genes or Rexpression (data not shown). This suggests that the effect of copy-specific TEs on diver-gence in duplicate gene expression may be at best minor, although this issue requires additional studies.
Interplay of multiple predictors in explaining divergence of paralogous gene expression
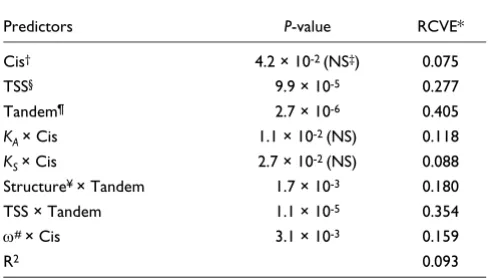
Because several factors studied above might be interrelated, we conducted multiple regression analysis to estimate the rel-ative contribution of each factor to explaining the total varia-bility in Rexpression. A total of four continuous predictors (KA,
KS, the KA/KS ratio, and divergence of cis-regulatory sequences (labeled 'Cis') and three categorical predictors (shared versus not shared TSSs (labeled 'TSS'); completely versus incompletely similar gene structure (labeled 'Struc-ture'); and tandem versus non-tandem gene organization (labeled 'Tandem')) as well as all possible pairwise interaction terms were used to build a regression model. After pruning nonsignificant terms, the final multiple regression model explained approximately 10% of the variation in Rexpression and consisted of eight predictors (Table 2). Five of these predic-tors remained significant after applying Bonferroni correc-tion for multiple tests (Table 2). These predictors included: Tandem, TSS, and interaction terms between Structure and Tandem, between TSS and Tandem, and between KA/KS ratio and Cis (Table 2). Our computation of the relative contribu-tion of the variability explained (RCVE) for significant predic-tors (see Materials and methods for details) indicated that each of them makes a sizeable input into the model.
The relationship between KS and Rexpression for group B duplicate genes with (a) completely similar structures and (b) incompletely similar structures
Figure 3
The relationship between KS and Rexpression for group B duplicate genes with
(a) completely similar structures and (b) incompletely similar structures.
0 0.5 1.0 1.5 2.0
-0.6 -0.4 -0.2 0.0 0.2 0.4 0.6 0.8 1.0
Rexpression
Ks
R = -0.315, P < 0.001 (a)
0 0.5 1.0 1.5 2.0
-0.6 -0.4 -0.2 0.0 0.2 0.4 0.6 0.8 1.0
(b)
Rexpression
Ks
[image:6.612.53.296.85.422.2]R = -0.001, P > 0.5
Table 1
The relationship between KS and Rexpression in each structural category using group B duplicate gene pairs
Structural categories Number of gene pairs KA/KS* KS* Rexpression* Pearson correlation coefficient of KS
versus Rexpression (P-value)
Completely similar 214 0.296 (0.237) 1.153 (1.225) 0.213 (0.162) -0.315 (<0.001)
5' similar 24 0.391 (0.311) 1.292 (1.501) 0.053 (0.026) -0.157 (NS)
3' similar 23 0.302 (0.311) 1.365 (1.610) 0.346 (0.249) 0.019 (NS)
Neither 5' nor 3' similar 520 0.551 (0.456) 1.565 (1.658) 0.126 (0.063) 0.017 (NS)
Incompletely similar (the sum of the above three categories)
567 0.534 (0.444) 1.545 (1.646) 0.132 (0.068) -0.001 (NS)
Completely and 5' similar 238 0.307 (0.246) 1.167 (1.263) 0.197 (0.151) -0.307 (<0.001)
Discussion
Although it has been shown that duplicate genes diverge rap-idly in their expression [10,39-41], little is known about which factors influence their expression divergence at the genomic level [42]. In this study, we investigated three such factors: structural heterogeneity of coding sequences, turnover of TSSs, and divergence of cis-regulatory regions (including insertions of copy-specific TEs).
Our results indicate that structural differences in coding sequences are common among human duplicate genes. We observed a high proportion of duplicate genes with structural differences even among young duplicates (KS <0.1), which is consistent with the findings for C. elegans duplicate genes [15]. Thus, genes might already be structurally different at the point of duplication. In general, duplication by unequal cross-ing over might not contain the entire codcross-ing sequence of a parental gene, and indeed, for the majority of individual young duplicate gene pairs with incompletely similar struc-tures in our data set (for approximately 90% of duplicate pairs of group A), both copies reside on the same chromo-some. Over time, duplicate genes accumulate mutations lead-ing to amino acid changes, premature stop codons, and atypical splicing [4,14,43]. These mutations might lead to decreasing numbers of duplicate genes retaining their ances-tral structure and lead to more rapid divergence in expression and function.
Alteration of TSSs between duplicate gene copies is likely to have a direct impact on expression divergence. Using sequence similarity analysis, we examined whether duplicate genes share their TSSs. A large number of duplicate genes with distinct TSSs between the two copies were observed and these duplicate gene copies usually had different expression
patterns. Although we did not directly estimate the fitness effects of turnover of TSSs on retention of duplicate genes, alteration of TSSs provides a means for the realization of sev-eral models of gene duplication evolution (for example, sub-functionalization and neosub-functionalization [44,45]).
Additionally, we observed that cis-regulatory regions of duplicate genes diverge with time since duplication. This is consistent with several previous reports [46-48]. We investi-gated a potential impact of the density of copy-specific TEs on the divergence of duplicate gene expression and, surprisingly, found no major effect. This result corroborates recent find-ings regarding orthologous mammalian promoters; in human core promoters, the density of most observed repeat classes was significantly below the genomic average, suggesting that insertion of TEs in cis-regulatory regions is prevented by purifying selection [36].
Using multiple regression analysis, we observed that shared versus not shared TSS ('TSS'), completely versus incom-pletely similar structure ('Structure'), divergence of cis -regu-latory sequences ('Cis'), the KA/KS ratio, and tandem versus non-tandem duplicate gene organization played an important role in determining divergence in duplicate gene expression. It is worth noting that all three novel predictors introduced in this manuscript (TSS, Structure, and Cis) significantly influ-ence diverginflu-ence in duplicate gene expression alone and/or through interaction with other predictors. Interestingly, KS, a proxy of evolutionary time, was not a significant predictor in our model. However, as noted above, evolutionary time ences alterations in other predictors and, therefore, the influ-ence of KS on Rexpression might be observed through significance of predictors dependent on KS. While interaction terms are not straightforward to interpret, the finding that several of them significantly contributed to the model sug-gests that considering multiple correlated factors might be essential for understanding patterns of duplicate gene expression divergence.
In this study, expression pattern was used as an indicator of evolution of biological functions after gene duplication. Sev-eral studies have suggested that gene expression density and breadth (for example, in housekeeping versus tissue-specific genes) has significantly influenced the evolution of proteins [49-52]. In addition to gene expression, which is likely a strong predictor [53,54], several additional factors have been implicated in protein evolution. Such factors include gene dispensability [55,56], protein stability and interaction net-work [57,58] as well as codon usage [54,59]. Although these variables individually explain only a small fraction of varia-tion in the rate of protein evoluvaria-tion, studying them might pro-vide important insights into divergence between duplicate genes.
Most gene evolution models have assumed that two duplicate gene copies are expressed equally immediately after
duplica-Table 2
Multiple regression models for expression divergence in duplicate genes
Predictors P-value RCVE*
Cis† 4.2 × 10⁻² (NS‡) 0.075
TSS§ 9.9 × 10⁻⁵ 0.277
Tandem¶ 2.7 × 10⁻⁶ 0.405
KA × Cis 1.1 × 10⁻² (NS) 0.118
KS × Cis 2.7 × 10⁻² (NS) 0.088
Structure¥ × Tandem 1.7 × 10⁻³ 0.180
TSS × Tandem 1.1 × 10⁻⁵ 0.354
ω# × Cis 3.1 × 10⁻³ 0.159
R2 0.093
*RCVE: relative contribution to the variability explained (see Materials and methods for more details). †Cis: divergence of cis-regulatory sequences in 2 kb surrounding TSS (see Materials and methods for more details). ‡NS: not significant after Bonferroni correction for multiple tests. §TSS: shared versus not shared TSSs. ¶Tandem: tandem versus nontandem organization of duplicate genes. ¥Structure: structural heterogeneity in coding sequences. #ω:K
[image:7.612.53.297.128.267.2]tion. However, similarly to coding sequences, promoter regions might also be incompletely duplicated between cop-ies; this possibility needs to be evaluated in future studies. Frequently, because of the complex evolutionary dynamics of promoter sequences [47,60,61], it is difficult to distinguish incomplete promoter duplication from rapid promoter evolu-tion after duplicaevolu-tion.
Reconstruction of ancestral gene expression state can be per-formed using a parsimony-based procedure in multi-gene families [62], instead of using the pairwise analysis employed here. However, rigorous filtering for potential cross-hybridi-zation of transcripts of genes from the same multi-gene fam-ily in our study makes such ancestral reconstruction difficult. Thus, additional studies using different types of expression data may allow us to decompose the expression divergence of genes in multi-gene families and thus provide us with addi-tional methodological insights for understanding gene expression divergence.
In the present study, as expected, we observed a significant negative correlation between the synonymous rate and Pear-son correlation coefficient of expression values between duplicate gene copies; however, the resulting correlation was weaker than in our previous study [10]. There might be sev-eral potential reasons explaining this difference (for example, different KS thresholds used in the two studies and a greater number of tissues used in the present study). However, the major advance of the present study compared with the previ-ous one [10] is a more rigorprevi-ous filtering for potential cross-hybridization of transcripts of two duplicate gene copies to the same probe, and thus we consider the present results more robust.
Conclusion
The present study represents the first report of the effects of structural differences in coding region and of unique TSSs on the divergence of duplicate gene expression. Our observa-tions of frequent turnover of TSSs between duplicate genes and a high proportion of young duplicate genes with incom-pletely similar structures contradict the assumptions of clas-sic gene duplication models, according to which duplicate genes are considered to be equal both structurally and func-tionally at the point of duplication [4,13,14]. Although poten-tial incomplete duplication of promoters will be the subject of future studies, our investigation of factors contributing to expression divergence of duplicate genes provides important information for understanding human transcriptome hetero-geneity, complexity, and evolution.
Materials and methods
Identification of duplicate gene pairs
To cluster genes into families, we downloaded 48,218 protein sequences of consensus coding sequences, known and novel
genes from Ensembl (release 38 of NCBI build 36) and inde-pendently used the FASTA [63] and TRIBE-MCL [64] meth-ods to define duplicate gene families. Briefly, for the FASTA method, each protein sequence was used as a query to search against all other protein sequences using FASTA [65] with E < 10. Two protein sequences formed a link if: the aligned region was >80% of the longer protein; and the identity between two proteins was ≥ 30% for alignments longer than 150 amino acids or ≥ (0.01n + 4.8L-0.32 [1+exp(-L/1000)])
other-wise, where L is the alignable length between two proteins and n = 6. The formula above was derived from empirical data, which suggested that a higher sequence identity was required for shorter proteins [66]. These gene pairs were grouped into gene families according to the single linkage clustering algorithm. For gene families derived by TRIBE-MCL, we downloaded the gene annotations through BioMart in the Ensembl database, and considered gene families with at least two members.
To identify independent pairs of duplicate genes within each gene family, we sorted gene pairs in ascending order of KS and selected the pair with the lowest KS. After excluding genes that had been picked, we chose the next gene pair with the lowest KS. These steps were repeated for each gene family. All genes encoding proteins were realigned using CLUSTALW [67], and the yn00 module [68] of PAML [69] was used to cal-culate KS. We counted duplicate gene pairs in intervals of size
KS = 0.01 to derive the instantaneous rate of KS according to [35].
Duplicate gene copies in which one of the pair has one exon and the duplicate copy has multiple exons were called retro-transposed duplicate gene copies. In addition, duplicate gene pairs were classified as tandem duplicates if there were no genes separating them.
Expression data analysis
Expression data for 61 non-redundant and nonpathogenic human tissues in U133A and GNF1H Affymetrix arrays were obtained from [28]. To validate mapping between probe sets and genes, we aligned the transcripts of consensus coding sequences, known genes, and novel genes downloaded from Ensembl (release 38 of NCBI build 36) with the exemplar and consensus sequences for each array using BLAST [70] with E < 10-20. According to the criteria described in [71,72], the
average difference) was selected. All genes following the third scenario were removed from the analysis due to potential cross-hybridization. Following [28], genes with average dif-ference >200 in a particular tissue were considered to be expressed in this tissue.
Identification of putative TSSs
The putative TSSs were identified using the method described in the ENCODE pilot project [73]. Briefly, we utilized tag clus-ters from two sets of 5'-end-tag-capture technologies: CAGE [20] and PETs [31]. If two tag clusters were located on the same strand and within 60 bp (which was derived from ana-lyzing the distribution of distances between tag clusters in [73]) of each other, they were considered as one tag cluster. To map tag clusters to genes, the following two criteria were considered. First, the strand of a tag cluster was required to be identical to the strand of a gene. Second, a tag cluster was required to be located in the 5' upstream region from the most upstream start codon of a gene. Because we constructed arti-ficial coding regions of genes by including all their exons, our analysis is not affected by alternative start codons. To confirm the reliability of the tag data, RefSeq [74], H-Invitational [75] and human ESTs [76] RNA data from the UCSC Genome Browser [77] were utilized. We excluded tag clusters with a single tag as well as those whose coordinates did not overlap with the genomic coordinates of the 5' end of cDNAs or ESTs. To define a representative tag site (to be used as a putative TSS) for each tag cluster, we selected the tag site that was sup-ported by the highest number of 5' start sites. Otherwise, if several sites in a tag cluster had the same number of 5' start sites, the central coordinate of this tag cluster was defined as the representative tag site.
Analysis of turnover of TSSs between human-mouse orthologous gene pairs
To evaluate conservation of TSSs between human-mouse orthologous genes, we obtained two distinct classes of orthol-ogous genes from [23]. Briefly, 'conserved promoter regions' means that upstream sequences of TSSs between human and mouse orthologous genes were aligned; otherwise, 'non-con-served promoter regions' means there were no significant alignments. We excluded orthologous genes that were classi-fied into both classes because alternatively spliced variants of each gene had different conservation patterns of promoter regions. As a result, 1,610 orthologous gene pairs that were classified into just one class in a mutually exclusive manner were retained. We downloaded human and mouse protein sequences from Ensembl (release 38 of NCBI build 36). All genes were aligned using CLUSTALW [67], and the yn00 module [68] of PAML [69] was used to calculate KS between orthologous genes.
Classification of the type of gene duplication into structural categories
Structural categorization of duplicate genes was performed using reconstructed full-length coding sequences. We
down-loaded annotated human genome data from Ensembl (release 38 of NCBI build 36). Alternatively spliced variants lacking start or stop codons or lacking canonical exon boundaries (5'-GT...AG-3', 5'-GC...AG-3', or 5'-AT...AC-3') were excluded. For each gene with several alternatively spliced variants, all exons were aligned against each other, and, if some exons overlapped, they were merged in a single exon. Next, exons were sorted by their genomic coordinates and were reassem-bled to form reconstructed full-length coding sequences.
The reconstructed full-length coding sequences were aligned using AVID [78] with default parameters. Each pair of dupli-cate genes was classified into one of the four structural dupli- cate-gories: completely similar, 5' similar, 3' similar, and neither 5' nor 3' similar. If the proportion of aligned sequences was greater than 0.9, duplicate gene pairs were categorized as completely similar. The other duplicate gene pairs were exclusively classified in just one category of 5' similar, 3' sim-ilar, or neither 5' nor 3' similar. If alignments between the two copies started at the start codons of both copies, then such duplicates were classified as 5' similar. Alternatively, if the alignments ended at the stop codons of both copies, we clas-sified the duplicate genes into 3' similar. Finally, the remain-ing duplicate gene pairs were labeled as neither 5' nor 3' similar.
Cis-regulatory regions analysis
To detect homologous sequences in cis-regulatory regions, we used a modified version of REALIGNER [37]. Using BL2SEQ (part of the Blast suite [70]) with mismatch penalty equal to -2 and word size equal to 7, we constructed alignments of -2-kb (-1.5 kb to +0.5 kb) genomic regions surrounding putative TSSs between copies in each duplicate gene pair. We selected alignments satisfying three criteria: hit length >7 bp; identity >70%; and identical hit strand. If two local alignments over-lapped, an alignment with the higher bit score was retained. If the bit scores of the two overlapping alignments were iden-tical, a longer alignment or the one closest to TSS was retained. If the two local alignments were not syntenic (the order of blocks in each alignment was inconsistent), an align-ment with the lower bit score was removed. Finally, all local alignments ordered by their genomic coordinates were used as a conserved cis-regulatory region for a duplicate gene pair.
TEs within cis-regulatory regions were classified into two sets: with the insertion occurring in the ancestral sequence before duplication of a genomic region; with the insertion in only one duplicate copy after the duplication event. We used the Repeatmasker [79] tables at the UCSC Genome Browser [77] to map the coordinates of TEs into cis-regulatory regions.
Multiple regression analysis
terms). RCVE [80,81] was utilized to assess the contribution of each predictor to explaining the total variability:
where and are the R2 for the full model and
the model except for the predictor of interest, respectively. In addition, variance inflation factors [82] were calculated for each predictor to diagnose multicollinearity. All predictors and their interaction terms included in the final model had variance inflation factors below 2 (data not shown), suggest-ing that multicollinearity was not adversely affectsuggest-ing the model.
Abbreviations
CAGE: cap analysis of gene expression; KA: nonsynonymous divergence; KS: synonymous rate; PET: paired-end ditag; RCVE: relative contribution to variability explained; TE: transposable element; TSS: transcription start site.
Authors' contributions
CP and KDM designed the experiments and wrote the manu-script. CP performed data analyses.
Additional data files
The following additional data are available with the online version of this paper. Additional data file 1 is a table listing the classification of duplicate gene pairs based on the absence or presence of shared TSSs and different duplication mecha-nisms. Additional data file 2 is a Venn diagram depicting the number of duplicate gene pairs that were identified by the FASTA and TRIBE-MCL methods. Additional data file 3 shows average sequence identity between TSS regions of duplicate genes. Additional data file 4 shows number of dupli-cate gene pairs with shared TSSs (A) and without shared TSSs (B) plotted against the instantaneous rate of KS. Additional data file 5 shows proportions of group A duplicate gene pairs with shared TSSs depending on different identity thresholds. Additional data file 6 shows number of duplicate gene pairs in different structure categories plotted against the instantane-ous rate of KS.
Additional data file 1
Classification of duplicate gene pairs based on the absence or pres-ence of shared TSSs and different duplication mechanisms Classification of duplicate gene pairs based on the absence or pres-ence of shared TSSs and different duplication mechanisms. Click here for file
Additional data file 2
Number of duplicate gene pairs that were identified by the FASTA and TRIBE-MCL methods
Number of duplicate gene pairs that were identified by the FASTA and TRIBE-MCL methods.
Click here for file Additional data file 3
Average sequence identity between TSS regions of duplicate genes The identities were obtained by BL2SEQ [70] with default parame-ters. Black bars represent 110 bp (-20 bp to +90 bp) surrounding each TSS.
Click here for file Additional data file 4
Number of duplicate gene pairs with shared TSSs and without shared TSSs plotted against the instantaneous rate of KS
Number of duplicate gene pairs (A) with shared TSSs and (B) with-out shared TSSs plotted against the instantaneous rate of KS. Click here for file
Additional data file 5
Proportions of group A duplicate gene pairs with shared TSSs depending on different identity thresholds
Proportions of group A duplicate gene pairs with shared TSSs depending on different identity thresholds.
Click here for file Additional data file 6
Number of duplicate gene pairs in different structure categories plotted against the instantaneous rate of KS
Number of duplicate gene pairs in different structure categories plotted against the instantaneous rate of KS.
Click here for file
Acknowledgements
We thank Ross Hardison, Webb Miller, Francesca Chiaromonte, Laura Carrel, and Claude dePamphilis for valuable discussions. We are grateful to Melissa Wilson for comments on the manuscript. This work was supported by start-up funds from Penn State (to KDM).
References
1. Ohno S: Evolution by Gene Duplication New York: Springer Verlag; 1970.
2. Taylor JS, Raes J: Duplication and divergence: the evolution of new genes and old ideas. Annu Rev Genet 2004, 38:615-643. 3. Wagner A: Selection and gene duplication: a view from the
genome. Genome Biol 2002, 3:reviews1012.
4. Zhang J: Evolution by gene duplication: an update. Trends Ecol Evol 2003, 18:292-298.
5. Lynch M, Conery JS: The evolutionary fate and consequences of duplicate genes. Science 2000, 290:1151-1155.
6. Shiu SH, Borevitz JO: The next generation of microarray research: applications in evolutionary and ecological genom-ics. Heredity 2008, 100:141-149.
7. Conant GC, Wagner A: Asymmetric sequence divergence of duplicate genes. Genome Res 2003, 13:2052-2058.
8. Gu X, Zhang Z, Huang W: Rapid evolution of expression and regulatory divergences after yeast gene duplication. Proc Natl Acad Sci USA 2005, 102:707-712.
9. Gu Z, Nicolae D, Lu HH, Li WH: Rapid divergence in expression between duplicate genes inferred from microarray data. Trends Genet 2002, 18:609-613.
10. Makova KD, Li WH: Divergence in the spatial pattern of gene expression between human duplicate genes. Genome Res 2003, 13:1638-1645.
11. Wagner A: Decoupled evolution of coding region and mRNA expression patterns after gene duplication: implications for the neutralist-selectionist debate. Proc Natl Acad Sci USA 2000, 97:6579-6584.
12. Zhang P, Gu Z, Li WH: Different evolutionary patterns between young duplicate genes in the human genome. Genome Biol 2003, 4:R56.
13. Lynch M, Katju V: The altered evolutionary trajectories of gene duplicates. Trends Genet 2004, 20:544-549.
14. Hurles M: Gene duplication: the genomic trade in spare parts. PLoS Biol 2004, 2:E206.
15. Katju V, Lynch M: The structure and early evolution of recently arisen gene duplicates in the Caenorhabditis elegans genome. Genetics 2003, 165:1793-1803.
16. Jordan IK, Rogozin IB, Glazko GV, Koonin EV: Origin of a substan-tial fraction of human regulatory sequences from transposa-ble elements. Trends Genet 2003, 19:68-72.
17. Thornburg BG, Gotea V, Makalowski W: Transposable elements as a significant source of transcription regulating signals. Gene 2006, 365:104-110.
18. Kamat A, Hinshelwood MM, Murry BA, Mendelson CR: Mecha-nisms in tissue-specific regulation of estrogen biosynthesis in humans. Trends Endocrinol Metab 2002, 13:122-128.
19. Lagemaat LN van de, Landry JR, Mager DL, Medstrand P: Transpos-able elements in mammals promote regulatory variation and diversification of genes with specialized functions. Trends Genet 2003, 19:530-536.
20. Carninci P, Sandelin A, Lenhard B, Katayama S, Shimokawa K, Ponjavic J, Semple CA, Taylor MS, Engstrom PG, Frith MC, Forrest AR, Alkema WB, Tan SL, Plessy C, Kodzius R, Ravasi T, Kasukawa T, Fukuda S, Kanamori-Katayama M, Kitazume Y, Kawaji H, Kai C, Nakamura M, Konno H, Nakano K, Mottagui-Tabar S, Arner P, Chesi A, Gustincich S, Persichetti F, et al.: Genome-wide analysis of mammalian promoter architecture and evolution. Nat Genet 2006, 38:626-635.
21. Kim TH, Barrera LO, Zheng M, Qu C, Singer MA, Richmond TA, Wu Y, Green RD, Ren B: A high-resolution map of active promot-ers in the human genome. Nature 2005, 436:876-880.
22. Kimura K, Wakamatsu A, Suzuki Y, Ota T, Nishikawa T, Yamashita R, Yamamoto J, Sekine M, Tsuritani K, Wakaguri H, Ishii S, Sugiyama T, Saito K, Isono Y, Irie R, Kushida N, Yoneyama T, Otsuka R, Kanda K, Yokoi T, Kondo H, Wagatsuma M, Murakawa K, Ishida S, Ishibashi T, Takahashi-Fujii A, Tanase T, Nagai K, Kikuchi H, Nakai K, et al.: Diversification of transcriptional modulation: large-scale identification and characterization of putative alternative promoters of human genes. Genome Res 2006, 16:55-65. 23. Tsuritani K, Irie T, Yamashita R, Sakakibara Y, Wakaguri H, Kanai A,
Mizushima-Sugano J, Sugano S, Nakai K, Suzuki Y: Distinct class of putative "non-conserved" promoters in humans: compara-tive studies of alternacompara-tive promoters of human and mouse genes. Genome Res 2007, 17:1005-1014.
24. Cooper SJ, Trinklein ND, Anton ED, Nguyen L, Myers RM:
Compre-RCVE R full Rreduced R full
= −
2 2
2
hensive analysis of transcriptional promoter structure and function in 1% of the human genome. Genome Res 2006, 16:1-10.
25. Landry JR, Mager DL, Wilhelm BT: Complex controls: the role of alternative promoters in mammalian genomes. Trends Genet 2003, 19:640-648.
26. Strausberg RL, Levy S: Promoting transcriptome diversity. Genome Res 2007, 17:965-968.
27. Trinklein ND, Aldred SJ, Saldanha AJ, Myers RM: Identification and functional analysis of human transcriptional promoters. Genome Res 2003, 13:308-312.
28. Su AI, Wiltshire T, Batalov S, Lapp H, Ching KA, Block D, Zhang J, Soden R, Hayakawa M, Kreiman G, Cooke MP, Walker JR, Hogenesch JB: A gene atlas of the mouse and human protein-encoding transcriptomes. Proc Natl Acad Sci USA 2004, 101:6062-6067. 29. Horan K, Lauricha J, Bailey-Serres J, Raikhel N, Girke T: Genome
cluster database. A sequence family analysis platform for Arabidopsis and rice. Plant Physiol 2005, 138:47-54.
30. Yang J, Lusk R, Li WH: Organismal complexity, protein com-plexity, and gene duplicability. Proc Natl Acad Sci USA 2003, 100:15661-15665.
31. Ng P, Wei CL, Sung WK, Chiu KP, Lipovich L, Ang CC, Gupta S, Sha-hab A, Ridwan A, Wong CH, Liu ET, Ruan Y: Gene identification signature (GIS) analysis for transcriptome characterization and genome annotation. Nat Methods 2005, 2:105-111. 32. Suzuki Y, Yamashita R, Shirota M, Sakakibara Y, Chiba J,
Mizushima-Sugano J, Nakai K, Mizushima-Sugano S: Sequence comparison of human and mouse genes reveals a homologous block structure in the promoter regions. Genome Res 2004, 14:1711-1718. 33. Jin VX, Singer GA, Agosto-Perez FJ, Liyanarachchi S, Davuluri RV:
Genome-wide analysis of core promoter elements from con-served human and mouse orthologous pairs. BMC bioinformat-ics 2006, 7:114.
34. Yi S, Ellsworth DL, Li WH: Slow molecular clocks in Old World monkeys, apes, and humans. Mol Biol Evol 2002, 19:2191-2198. 35. Hughes T, Liberles DA: The pattern of evolution of
smaller-scale gene duplicates in mammalian genomes is more con-sistent with neo- than subfunctionalisation. J Mol Evol 2007, 65:574-588.
36. Taylor MS, Kai C, Kawai J, Carninci P, Hayashizaki Y, Semple CA: Heterotachy in mammalian promoter evolution. PLoS Genet 2006, 2:e30.
37. Iwama H, Gojobori T: Highly conserved upstream sequences for transcription factor genes and implications for the regu-latory network. Proc Natl Acad Sci USA 2004, 101:17156-17161. 38. Chamary JV, Parmley JL, Hurst LD: Hearing silence: non-neutral
evolution at synonymous sites in mammals. Nat Rev Genet 2006, 7:98-108.
39. Li WH, Yang J, Gu X: Expression divergence between duplicate genes. Trends Genet 2005, 21:602-607.
40. Scannell DR, Wolfe KH: A burst of protein sequence evolution and a prolonged period of asymmetric evolution follow gene duplication in yeast. Genome Res 2008, 18:137-147.
41. Semon M, Wolfe KH: Preferential subfunctionalization of slow-evolving genes after allopolyploidization in Xenopus laevis . Proc Natl Acad Sci USA 2008, 105:8333-8338.
42. Ha M, Li WH, Chen ZJ: External factors accelerate expression divergence between duplicate genes. Trends Genet 2007, 23:162-166.
43. Prince VE, Pickett FB: Splitting pairs: the diverging fates of duplicated genes. Nat Rev Genet 2002, 3:827-837.
44. Lynch M, Force A: The probability of duplicate gene preserva-tion by subfuncpreserva-tionalizapreserva-tion. Genetics 2000, 154:459-473. 45. Shiu SH, Byrnes JK, Pan R, Zhang P, Li WH: Role of positive
selec-tion in the retenselec-tion of duplicate genes in mammalian genomes. Proc Natl Acad Sci USA 2006, 103:2232-2236.
46. Papp B, Pal C, Hurst LD: Evolution of cis-regulatory elements in duplicated genes of yeast. Trends Genet 2003, 19:417-422. 47. Castillo-Davis CI, Hartl DL, Achaz G: cis-Regulatory and protein
evolution in orthologous and duplicate genes. Genome Res 2004, 14:1530-1536.
48. Leach LJ, Zhang Z, Lu C, Kearsey MJ, Luo Z: The role of cis-regu-latory motifs and genetical control of expression in the diver-gence of yeast duplicate genes. Mol Biol Evol 2007, 24:2556-2565. 49. Zhang L, Li WH: Mammalian housekeeping genes evolve more slowly than tissue-specific genes. Mol Biol Evol 2004, 21:236-239. 50. Subramanian S, Kumar S: Gene expression intensity shapes evo-lutionary rates of the proteins encoded by the vertebrate
genome. Genetics 2004, 168:373-381.
51. Pal C, Papp B, Hurst LD: Highly expressed genes in yeast evolve slowly. Genetics 2001, 158:927-931.
52. Duret L, Mouchiroud D: Determinants of substitution rates in mammalian genes: expression pattern affects selection intensity but not mutation rate. Mol Biol Evol 2000, 17:68-74. 53. Drummond DA, Raval A, Wilke CO: A single determinant
dom-inates the rate of yeast protein evolution. Mol Biol Evol 2006, 23:327-337.
54. Rocha EP, Danchin A: An analysis of determinants of amino acids substitution rates in bacterial proteins. Mol Biol Evol 2004, 21:108-116.
55. Hirsh AE, Fraser HB: Protein dispensability and rate of evolu-tion. Nature 2001, 411:1046-1049.
56. Zhang J, He X: Significant impact of protein dispensability on the instantaneous rate of protein evolution. Mol Biol Evol 2005, 22:1147-1155.
57. Fraser HB, Hirsh AE, Steinmetz LM, Scharfe C, Feldman MW: Evolu-tionary rate in the protein interaction network. Science 2002, 296:750-752.
58. Drummond DA, Wilke CO: Mistranslation-induced protein mis-folding as a dominant constraint on coding-sequence evolu-tion. Cell 2008, 134:341-352.
59. Wall DP, Hirsh AE, Fraser HB, Kumm J, Giaever G, Eisen MB, Feld-man MW: Functional genomic analysis of the rates of protein evolution. Proc Natl Acad Sci USA 2005, 102:5483-5488.
60. Cusack BP, Wolfe KH: Not born equal: increased rate asymme-try in relocated and retrotransposed rodent gene duplicates. Mol Biol Evol 2007, 24:679-686.
61. Liang H, Lin YS, Li WH: Fast evolution of core promoters in pri-mate genomes. Mol Biol Evol 2008, 25:1239-1244.
62. Rossnes R, Eidhammer I, Liberles DA: Phylogenetic reconstruc-tion of ancestral character states for gene expression and mRNA splicing data. BMC Bioinformatics 2005, 6:127.
63. Gu Z, Cavalcanti A, Chen FC, Bouman P, Li WH: Extent of gene duplication in the genomes of Drosophila, nematode, and yeast. Mol Biol Evol 2002, 19:256-262.
64. Enright AJ, Van Dongen S, Ouzounis CA: An efficient algorithm for large-scale detection of protein families. Nucleic Acids Res 2002, 30:1575-1584.
65. Pearson WR, Lipman DJ: Improved tools for biological sequence comparison. Proc Natl Acad Sci USA 1988, 85:2444-2448. 66. Rost B: Twilight zone of protein sequence alignments. Protein
Eng 1999, 12:85-94.
67. Thompson JD, Higgins DG, Gibson TJ: CLUSTAL W: improving the sensitivity of progressive multiple sequence alignment through sequence weighting, position-specific gap penalties and weight matrix choice. Nucleic Acids Res 1994, 22:4673-4680. 68. Yang Z, Nielsen R: Estimating synonymous and nonsynony-mous substitution rates under realistic evolutionary models. Mol Biol Evol 2000, 17:32-43.
69. Yang Z: PAML: a program package for phylogenetic analysis by maximum likelihood. Comput Appl Biosci 1997, 13:555-556. 70. Altschul SF, Madden TL, Schaffer AA, Zhang J, Zhang Z, Miller W,
Lip-man DJ: Gapped BLAST and PSI-BLAST: a new generation of protein database search programs. Nucleic Acids Res 1997, 25:3389-3402.
71. Chung WY, Albert R, Albert I, Nekrutenko A, Makova KD: Rapid and asymmetric divergence of duplicate genes in the human gene coexpression network. BMC Bioinformatics 2006, 7:46. 72. Huminiecki L, Lloyd AT, Wolfe KH: Congruence of tissue
expres-sion profiles from Gene Expresexpres-sion Atlas, SAGEmap and TissueInfo databases. BMC Genomics 2003, 4:31.
73. Birney E, Stamatoyannopoulos JA, Dutta A, Guigo R, Gingeras TR, Margulies EH, Weng Z, Snyder M, Dermitzakis ET, Thurman RE, Kuehn MS, Taylor CM, Neph S, Koch CM, Asthana S, Malhotra A, Adzhubei I, Greenbaum JA, Andrews RM, Flicek P, Boyle PJ, Cao H, Carter NP, Clelland GK, Davis S, Day N, Dhami P, Dillon SC, Dor-schner MO, Fiegler H, et al.: Identification and analysis of func-tional elements in 1% of the human genome by the ENCODE pilot project. Nature 2007, 447:799-816.
74. Pruitt KD, Tatusova T, Maglott DR: NCBI reference sequences (RefSeq): a curated non-redundant sequence database of genomes, transcripts and proteins. Nucleic Acids Res 2007, 35:D61-65.
Thi-erry-Mieg J, ThiThi-erry-Mieg D, Ashurst J, Jia L, Nakao M, Thomas MA, Mulder N, Karavidopoulou Y, Jin L, Kim S, Yasuda T, Lenhard B, Eveno E, et al.: Integrative annotation of 21,037 human genes validated by full-length cDNA clones. PLoS Biol 2004, 2:e162. 76. Benson DA, Karsch-Mizrachi I, Lipman DJ, Ostell J, Wheeler DL:
GenBank: update. Nucleic Acids Res 2004, 32:D23-26.
77. Karolchik D, Kuhn RM, Baertsch R, Barber GP, Clawson H, Diekhans M, Giardine B, Harte RA, Hinrichs AS, Hsu F, Kober KM, Miller W, Pedersen JS, Pohl A, Raney BJ, Rhead B, Rosenbloom KR, Smith KE, Stanke M, Thakkapallayil A, Trumbower H, Wang T, Zweig AS, Haus-sler D, Kent WJ: The UCSC Genome Browser Database: 2008 update. Nucleic Acids Res 2008, 36:D773-779.
78. Bray N, Dubchak I, Pachter L: AVID: A global alignment pro-gram. Genome Res 2003, 13:97-102.
79. Jurka J: Repbase update: a database and an electronic journal of repetitive elements. Trends Genet 2000, 16:418-420. 80. Kvikstad EM, Tyekucheva S, Chiaromonte F, Makova KD: A
macaque's-eye view of human insertions and deletions: dif-ferences in mechanisms. PLoS Comput Biol 2007, 3:1772-1782. 81. Kelkar YD, Tyekucheva S, Chiaromonte F, Makova KD: The
genome-wide determinants of human and chimpanzee mic-rosatellite evolution. Genome Res 2008, 18:30-38.