International Journal of Emerging Technology and Advanced Engineering
Website: www.ijetae.com (ISSN 2250-2459,ISO 9001:2008Certified Journal, Volume 3, Issue 8, August 2013)
134
Trend Analysis of Micro & Small Enterprises in North East
India: with Reference to Entrepreneur Development Programme
under KVIC, Assam
N. Sarma
1, Dr. P.H. Talukdar
21
Assistant Director of Training, Assam Administrative Staff College, Guwahati-22
2
Professor, Deptt. Of Instrumentation & USIC, Gauhati University, Guwahati- 14
Abstract-- Khadi and Village Industry Commission (KVIC) India is an organization engaged in the task of promoting and developing khadi and village industries, with the mission for creating employment opportunities in the rural areas, thereby strengthening the rural economy. This paper deals with knowledge discovery in databases for KVIC scheme, namely- Rural Employment Generation Programme, for state of Assam and four districts –Barpeta, Jorhat, Kamrup and Nagaon for the year 2002-08. This is to identify Performance Trends of Assam along with district wise Trends for EDP Participants under KVIC patronage. It is expected that the aforesaid parameters shall unfold vital trend/ aspect that delineate the rural industrial setting.
Keywords-- Economy, Entrepreneur, KVIC, PMEGP, REGP, Village Industry.
I. INTRODUCTION
In developing countries across Asia, small and medium enterprises (SMEs) (i) make up 80%–90% of all enterprises, (ii) provide over 60% of the private sector jobs, (iii) generate over 30%–40% of total employment, and (iv) contribute about 50% of sales or value added -a Asian Association of Management Organization Report—SMEs in Asian Region: Harnessing the Growth Potential. According to UNCTAD-2003, OECD-2000, and Country reports -In India, they constitute 95% of all enterprises. However, in a study of 53 countries done by Fortune Small Business Survey, June 2007 on ‗Most and Least Friendly Countries to Small Businesses‘, India ranked 46th, well behind the other neighbouring Asian countries such as Singapore (5th), Hong Kong (6th), Thailand (15th), Malaysia (28th), etc.
In nearly three decades, the structure of rural employment in India has not changed much. (NSS 2004-05, Report 515) Male and female employment in industry in rural areas has risen from 8% and 6.7%, respectively in 1977-78 to 15.5% and 10%, respectively in 2004-05.
According to the NSS figures (61st Round), agriculture continues to employ 70% of our rural workforce, industry (14.4%) and services (14.8%) make up for the rest. The Mid-Term Appraisal (MTA) for the Tenth Five Year Plan had drawn attention to the loss of dynamism in agriculture and allied sectors after the mid-1990s. In view of the decline in agriculture‘s contribution to Gross Domestic Product (GDP) and the near constant proportion of workers dependent on it, there is need for generation of off-farm employment. In Brazil, Micro & Small Enterprise (MSE)s represent 20% of the total GDP; informal and micro enterprises contribute to 24% of the GDP in South Africa. In India MSEs are more than just GDP earners, they are instruments of inclusive growth for the most vulnerable, marginalised – rural people, women etc. 1.1 Micro and Small Enterprises
International Journal of Emerging Technology and Advanced Engineering
Website: www.ijetae.com (ISSN 2250-2459,ISO 9001:2008Certified Journal, Volume 3, Issue 8, August 2013)
135
Thus in India MSEs allow the rural poor including some of the most marginalized and vulnerable stratum such as rural woman, youth and landless to diversify their incomes, create new sources of economic growth and generateadditional employment (including self-employment) in rural areas. The Enterprises have been defined in terms of investment as given in the Table(I) [11]:
Table I
Definition of Micro, Small and Medium Enterprises
Investment in plant and machinery/equipment ( excluding land and building)
Manufacturing Enterprises Service Enterprises
Micro Up to Rs. 25 lakh Up to Rs. 10 lakh
Small More than Rs. 25 lakh and up to Rs. 5 Crore More than Rs. 10 lakh and up to Rs. 5 Crore Medium More than Rs. 5 Crore and up to Rs. 10 Crore More than Rs. 2 Crore and up to Rs. 5 Crore Source: MSMED Act, 2006
This is under Micro, Small and Medium Enterprise Development (MSMED) Act, 2006-concept of ‘Industry’ has been widened to that of ‗Enterprise‘ including both the manufacturing and service sector besides defining the medium enterprises. The MSEs in India comprises of modern and traditional enterprises. A modern segment includes MSEs under Small Industries Development Organisation (SIDO) and power looms.
MSEs under SIDO comprise the residual enterprises that are not covered by any assistance programme of the sector specific statutory bodies viz., the Handicraft, Handloom, Sericulture and Coir. The other segments of traditional enterprises are looked after by Khadi & Village Industry Commission (KVIC) [1].
1.2 Sector-wise Outlays/Expenditure
Table II
Sector-wise Outlays/Expenditure (Rs. In Crore) S Industry/Sub-Sector 2005-06
Actual
2006-07(BE) 2007-08(RE)/Exp. 2007-08
I Ministry of MSME Outlay BS IEBR Exp. BS IEBR Outlay BS IEBR
1 SIDO 352.69 378.11 378.11 -- 338.34 386.24 -- 490.00 490.00 -- 2 NSIC 41.80 106.95 44.95 62 44.95 44.95 57.22 68.25 20.00 48.25 3 Other Schemes 6.87 10.40 10.40 -- 8.03 10.40 -- 15.00 15.00 -- 4 National Comm. On
Eus
2.69 32.87 32.87 -- 5.60 24.74 -- 5.00 5.00 --
1 KVIC 558.56 592.93 592.93 -- 589.82 592.93 -- 708.00 708.00 -- 2 Coir 35.43 23.00 23.00 -- 22.90 23.00 -- 55.00 55.00 -- 3 PMRY 272.47 324.98 324.98 -- 248.51 252.60 -- 320.00 320.00 -- 4 SFURTI 1.50 25.97 25.97 -- 25.53 25.97 -- 26.00 26.00 -- 5 National Programme
for RI
0.07 0.12 0.12 -- -- -- -- -- -- --
6 Mahatma Gandhi Institute of RIWardha
-- -- -- -- -- -- -- 3.00 3.00 --
Total – MSME 1272.35 1495.33 1433.33 62 1283.68 1360.83 57.22 1690.25 1642.00 48.25
BS: Budget Support,IEBR: Internal and Extra Budgetary Resources,RE: Revised Estimate,PMRY: Prime Minister’s Rozgar Yojana RI: Rural Industries, NSIC: National Small Industries Corporation, Source:[13] Planning Commission India, Annual Plan 07-08
The data on expenditure incurred/outlay proposed for Micro, Small & Medium Enterprises (MSME) for the years 2005-06 to 2007-08 are presented in the Table (II) above; from which one can say Rural Industrialisation has been
International Journal of Emerging Technology and Advanced Engineering
Website: www.ijetae.com (ISSN 2250-2459,ISO 9001:2008Certified Journal, Volume 3, Issue 8, August 2013)
136
1.3 Performance of MSME and others
Table III
Physical Achievement of MSME and Others
Sector/Sub Unit Annual Plan
2005-06 ( Actual)
Annual Plan 2006-07 Annual Plan 2007-08
MSME Sector Target Achievement Target Achievement
Production
MSME Rs. Crore 497842 566404 587196 682613 NA
Khadi Cloth Rs. Crore 468.30 485.18 491.52 525.00 94.50
Village Industries Rs. Crore 11915.54 14264.82 13537.19 14550.00 2589.90
Coir Fibre 000 Tonne 410000 450000 430025 470000 189750
Exports
MSME Rs. Crore 150242
Coir Industries Rs.Crore 508.45 560.00 605.17 680.00 227.71
Employment
MSME Lakh Persons 299.85 306.93 312.52 322.28 NA
Khadi & Village Industries Lakh Persons 82.77 85.22 88.92 96.25 89.65
PMRY Lakh Persons 4.01 3.825 3.056 4.12 0.11
Coir Industries Lakh Persons 6.22 6.40 6.40 6.60 6.47
P: Provisional MT: Metric Tonne Source: [13] Planning Commission India, Annual Plan 2007-08
Under MSME sector, along with MSME there is Khadi and Village Industry, Coir etc. also. Performance of MSME and others are given in Table (III) above.
1.4 Performance of the Sector in NE Region of India
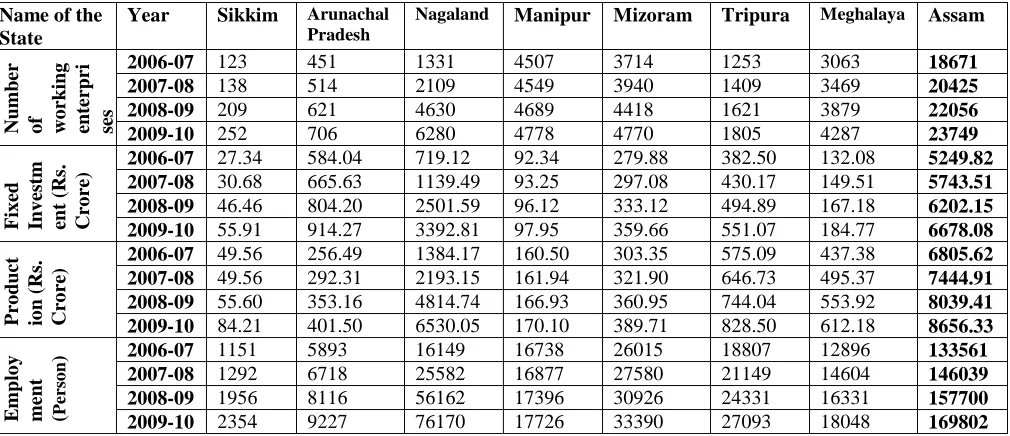
[image:3.612.57.562.487.705.2]The estimated number of registered working MSE units in North-Eastern region, their fixed investment, production and employment for the year 2009-10 (Projected) have been incorporated in Table (IV):
Table IV
North East and the MSEs (2009-10) Projected Name of the
State
Year Sikkim Arunachal Pradesh
Nagaland Manipur Mizoram Tripura Meghalaya Assam
Numb
er
o
f
wo
rking
ent
er
pri
ses
2006-07 123 451 1331 4507 3714 1253 3063 18671
2007-08 138 514 2109 4549 3940 1409 3469 20425
2008-09 209 621 4630 4689 4418 1621 3879 22056
2009-10 252 706 6280 4778 4770 1805 4287 23749
F
ix
ed
Inv
estm
ent
(
Rs.
Cro
re
) 2006-07 27.34 584.04 719.12 92.34 279.88 382.50 132.08 5249.82
2007-08 30.68 665.63 1139.49 93.25 297.08 430.17 149.51 5743.51 2008-09 46.46 804.20 2501.59 96.12 333.12 494.89 167.18 6202.15 2009-10 55.91 914.27 3392.81 97.95 359.66 551.07 184.77 6678.08
P
ro
du
ct
io
n (
Rs.
Cro
re
) 2006-07 49.56 256.49 1384.17 160.50 303.35 575.09 437.38 6805.62
2007-08 49.56 292.31 2193.15 161.94 321.90 646.73 495.37 7444.91 2008-09 55.60 353.16 4814.74 166.93 360.95 744.04 553.92 8039.41 2009-10 84.21 401.50 6530.05 170.10 389.71 828.50 612.18 8656.33
E
mp
lo
y
ment (Per
so
n
) 2006-07 1151 5893 16149 16738 26015 18807 12896 133561
2007-08 1292 6718 25582 16877 27580 21149 14604 146039
2008-09 1956 8116 56162 17396 30926 24331 16331 157700
2009-10 2354 9227 76170 17726 33390 27093 18048 169802
International Journal of Emerging Technology and Advanced Engineering
Website: www.ijetae.com (ISSN 2250-2459,ISO 9001:2008Certified Journal, Volume 3, Issue 8, August 2013)
137
Though Assam is lagging behind in Indian scenario, it is much ahead of other states of North Eastern Region. There is dearth of job avenues in the NE Region in both government and semi government sectors. A micro/small enterprise can be set up for self-employment, where one can choose an activity depending upon his/her interest and suitability not only to become self-employed but also to generate employment for others.Estimates say that in order to achieve the target of 10% growth in the Eleventh Plan, the MSE sector needs to grow at 12% -Planning Commission GOI Report 2007-12. Along with other support, there comes the requirement for Entrepreneur Development Programme(EDP)s. The most important aspect of development lies in economically empowering the individuals by enhancing their entrepreneurial skills for managing sustainable enterprises [4].II. METHODOLOGY
Based on the above background, the present study adopted a methodology wherein both primary and secondary data are analysed on KVIC and its rural employment generation schemes- REGP, PMEGP etc. The Secondary data formed the basis of analysis, for the present study. The Knowledge Discovery in Databases (KDD) is the process of automatic discovery of previously unknown patterns, rules and other regular contents implicitly present in large volume of data [2]. Data stored in databases cannot be used directly- one has to use Report, Query etc. For large volume of data one has to go for automation of data analysis tasks and Data Mining (DM) comes into picture [7]. The KDD process consists of the following steps:
2.1 Selection:
The data base used in the present study is collected from IIE Guwahati Training Database. Data mining applied to this huge amount of data, to extract EDP training participant‘s data for KVIC REGP scheme, for State of Assam. EDP Training Participants data /profiles of First Generation entrepreneurs under REGP schemes of KVICs in Assam were selected for the year 2002-2008. The study area covered four districts of the State of Assam comprising Barpeta, Jorhat, Kamrup and Nagaon districts. Undivided Kamrup and Nagaon districts are purposively selected considering high number of KVIC REGP EDP training participants- 1637 and 1370 respectively.
One lower Assam district, Barpeta and one upper Assam district Jorhat selected with 755 and 669 number of EDP participants respectively. The four districts together have 4431number of EDP training participant‘s data.
2.2 Preprocessing:
The data to be used by the process may have incorrect or missing data, which requires preprocessing. Our data are scrutinized for these and erroneous/ missing data are corrected/added/removed, such as -erroneous /missing Industry type etc. Number of attributes was reduced to make it more effective.
2.3 Transformation:
Data from different sources are converted into a common format for processing. Here some data are transformed into more usable formats. Data reduction and district wise processing is done for selected four districts of Assam.
2.4 Derive correlations:
Its objective is to derive patterns that summarize the underlying relationship in data. Descriptive data mining (DM) tasks are exploratory in nature. Here we are computing the Trend Values for the number of participants participated in the KVIC REGP EDP trainings, in year 2002- 2008 and project trend for 2013, using the method of curve fitting by Principle of Least Square method. The four districts considered for the study are: Barpeta, Jorhat, Kamrup and Nagaon district of Assam. The curve fitting by the principles of least square is the only technique which enables one to obtain the rate of growth per annum, for yearly data, if linear trend is fitted. If the trend fitted is linear trend y=a+bx, where x is obtained from t (time) by change of origin such that ∑x=0, the time period allotted the value 0 is known as the ‗period of origin‘; then for the yearly data, the annual rate of growth is b or 2b according as the number of years is odd or even respectively [3].
III. PERFORMANCE TRENDS OF KVICASSAM
International Journal of Emerging Technology and Advanced Engineering
Website: www.ijetae.com (ISSN 2250-2459,ISO 9001:2008Certified Journal, Volume 3, Issue 8, August 2013)
138
3.1 Trend values of REGP (PMEGP) for Assam
Table V
Trend Values in terms of Number of REGP Units setup (2004-2008)
Computation of s traight Line Trend by the method of 'leas t s quares ' ( trend values & trend es timate)
REGP Performance
t y x xy x² y=a+bx Projected
Year No of Unit Trend value Error Year Trend es timate
2004 1223 -2 -2446 4 1330.8 -107.8 2008 2376.8
2005 1658 -1 -1658 1 1592.3 65.7 2009 2638.3
2006 2229 0 0 0 1853.8 375.2 2010 2899.8
2007 1599 1 1599 1 2115.3 -516.3 2011 3161.3
2008 2560 2 5120 4 2376.8 183.2 2012 3422.8
2013 3684.3
∑ 9269 0 2615 10 9269 0.00
∑y=na+b∑x ∑xy=a∑x+b∑x²
a= 1853.8 b= 261.5
[image:5.612.72.541.375.522.2]Source: Calculated (on the data source of KVIC Reports [10])
Table VI
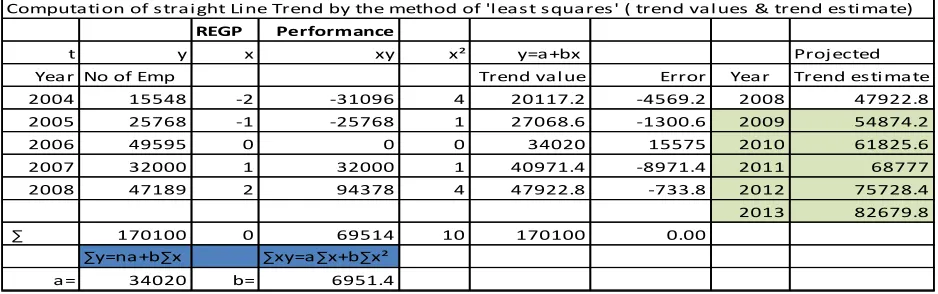
Trend value of REGP in terms of No.of Employment Generated (2004-08)
Computati on of s trai ght Li ne Trend by the method of 'l eas t s quares ' ( trend val ues & trend es ti mate)
REGP Performance
t y x xy x² y=a+bx Projected
Year No of Emp Trend val ue Error Year Trend es ti mate
2004 15548 -2 -31096 4 20117.2 -4569.2 2008 47922.8
2005 25768 -1 -25768 1 27068.6 -1300.6 2009 54874.2
2006 49595 0 0 0 34020 15575 2010 61825.6
2007 32000 1 32000 1 40971.4 -8971.4 2011 68777
2008 47189 2 94378 4 47922.8 -733.8 2012 75728.4
2013 82679.8
∑ 170100 0 69514 10 170100 0.00
∑y=na+b∑x ∑xy=a∑x+b∑x²
a= 34020 b= 6951.4
Source: Calculated (on the data source of KVIC Reports [10])
Table (V) shows Units setup increased from 1223 in 2004 to 2560 in 2008; Table (VI) shows employment generation increased from 15548 in 2004 to 47189 in 2008. However after 2008, REGP merged as Prime Minister‘s Employment Generation Programme (PMEGP).
3.2 Computation of Trends for EDP Participants
International Journal of Emerging Technology and Advanced Engineering
Website: www.ijetae.com (ISSN 2250-2459,ISO 9001:2008Certified Journal, Volume 3, Issue 8, August 2013)
139
[image:6.612.71.540.175.334.2]3.2.1 Trend values of EDP Participants (REGP) for Barpeta
Table VII
Trend value of EDP participants year-wise & 2013 projection (Barpeta)
Computation of straight Line Trend by the method of 'least squares' and the trend values & trend estimate
Barpeta Projected
t y x xy x² Trend value Error Year Trend estimate
2002 13 -3 -39 9 65.21428571 -52.2143 2008 150.5
2003 91 -2 -182 4 79.42857143 11.5714 2009 164.7142857
2004 138 -1 -138 1 93.64285714 44.3571 2010 178.9285714
2005 117 0 0 0 107.8571429 9.14286 2011 193.1428571
2006 133 1 133 1 122.0714286 10.9286 2012 207.3571429
2007 165 2 330 4 136.2857143 28.7143 2013 221.5714286
2008 98 3 294 9 150.5 -52.5
∑ 755 0 398 28 755 0
∑y=na+b∑x ∑xy=a∑x+b∑x²
a= 107.8571 b= 14.21428571 y=a+bx
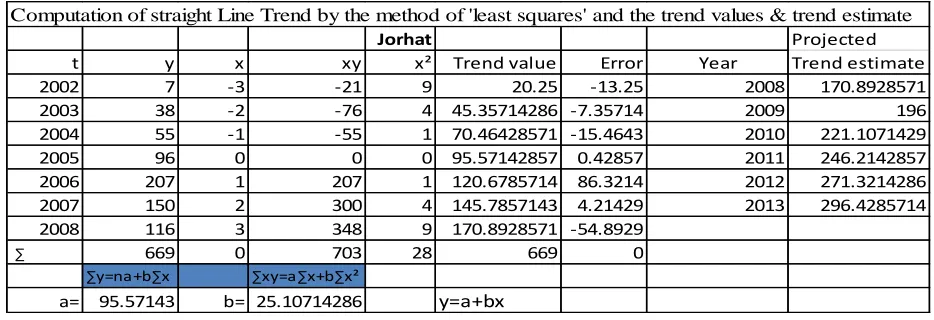
[image:6.612.72.539.382.542.2]3.2.2 Trend values of EDP Participants (REGP) for Jorhat
Table VIII
Trend value of EDP participants year-wise & 2013 projection (Jorhat)
Computation of straight Line Trend by the method of 'least squares' and the trend values & trend estimate
Jorhat Projected
t y x xy x² Trend value Error Year Trend estimate
2002 7 -3 -21 9 20.25 -13.25 2008 170.8928571
2003 38 -2 -76 4 45.35714286 -7.35714 2009 196
2004 55 -1 -55 1 70.46428571 -15.4643 2010 221.1071429
2005 96 0 0 0 95.57142857 0.42857 2011 246.2142857
2006 207 1 207 1 120.6785714 86.3214 2012 271.3214286
2007 150 2 300 4 145.7857143 4.21429 2013 296.4285714
2008 116 3 348 9 170.8928571 -54.8929
∑ 669 0 703 28 669 0
∑y=na+b∑x ∑xy=a∑x+b∑x²
International Journal of Emerging Technology and Advanced Engineering
Website: www.ijetae.com (ISSN 2250-2459,ISO 9001:2008Certified Journal, Volume 3, Issue 8, August 2013)
140
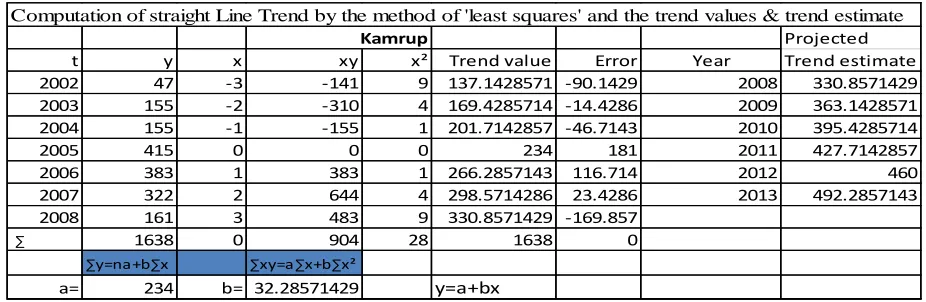
[image:7.612.74.537.175.326.2]3.2.3 Trend values of EDP Participants (REGP) for Kamrup
Table IX
Trend value of EDP participants year-wise & 2013 projection (Kamrup)
Computation of straight Line Trend by the method of 'least squares' and the trend values & trend estimate
Kamrup Projected
t y x xy x² Trend value Error Year Trend estimate
2002 47 -3 -141 9 137.1428571 -90.1429 2008 330.8571429
2003 155 -2 -310 4 169.4285714 -14.4286 2009 363.1428571
2004 155 -1 -155 1 201.7142857 -46.7143 2010 395.4285714
2005 415 0 0 0 234 181 2011 427.7142857
2006 383 1 383 1 266.2857143 116.714 2012 460
2007 322 2 644 4 298.5714286 23.4286 2013 492.2857143
2008 161 3 483 9 330.8571429 -169.857
∑ 1638 0 904 28 1638 0
∑y=na+b∑x ∑xy=a∑x+b∑x²
a= 234 b= 32.28571429 y=a+bx
[image:7.612.76.534.374.541.2]3.2.4 Trend values of EDP Participants (REGP) for Nagaon
Table X
Trend value of EDP participants year-wise & 2013 projection (Nagaon)
Computation of straight Line Trend by the method of 'least squares' and the trend values & trend estimate
Nagaon Projected
t y x xy x² Trend value Error Year Trend estimate
2002 8 -3 -24 9 15.42857143 -7.42857 2008 376.2857143
2003 55 -2 -110 4 75.57142857 -20.5714 2009 436.4285714
2004 86 -1 -86 1 135.7142857 -49.7143 2010 496.5714286
2005 257 0 0 0 195.8571429 61.1429 2011 556.7142857
2006 290 1 290 1 256 34 2012 616.8571429
2007 411 2 822 4 316.1428571 94.8571 2013 677
2008 264 3 792 9 376.2857143 -112.286
∑ 1371 0 1684 28 1371 0
∑y=na+b∑x ∑xy=a∑x+b∑x²
a= 195.8571 b= 60.14285714 y=a+bx
Table (VII) shows, for Barpeta district in 2002, 13 no. of EDP participants joined training and the growth value (b) calculated is 14.2. Projection for 2013 is 222, i.e. by 2013 222 participants may join EDP (PMEGP) training.
Table (VIII) shows, for Jorhat district, 7 no. of KVIC REGP EDP participants joined training in 2002, which goes up to 116 in 2008 and the growth value (b) calculated is 25.1. Calculated Projection for 2013 is 296.
Table (IX) shows, for Kamrup district in the year 2002, 47 number of EDP participants joined REGP EDP training, which goes up to 161 in the year 2008 and the growth value (b) calculated is 32.3. Projection for 2013 is 492.
Table (X) shows, for Nagaon district in the year 2002, 8 number of KVIC REGP participants joined EDP training, which grows to 264 in 2008 and the growth value (b) calculated is 60.1. Projection for 2013 is 677.
IV. INFERENCES
[image:7.612.77.538.377.541.2]International Journal of Emerging Technology and Advanced Engineering
Website: www.ijetae.com (ISSN 2250-2459,ISO 9001:2008Certified Journal, Volume 3, Issue 8, August 2013)
141
These projected trend values may be applicable for renamed and merged REGP called PMEGP. However PMEGP target for 2013 are: No. of Unit=2876 and No. of Employment Generated =23008; taking average 8 No. of employees per unit [KVIC website]. These are more realistic than our projected trend estimates at Table (V & VI).District wise Projections for 2013, for Number of participants joining KVIC EDPs; along with geographical area [9]:
Barpeta=222 Participants (with Yearly addition of 14); area=2677.33 sq. kilometer
Jorhat = 296 Participants (with Yearly addition of 25); area= 2851.00 sq. kilometer
Kamrup=492 Participants (with Yearly addition of 32); area=3483.77 sq. kilometer
Nagaon=677 Participants (with Yearly addition of 60); area=3975.00 sq. kilometer
o Thus, we can see that larger the geographical area, larger the number of participants -joining EDP training.
o Moreover, districts with large number of EDP participants are from Kamrup and Nagaon, infer- more awareness are there in districts nearer to the state HQ; while Barpeta and Jorhat have less number of EDP participants and thus implies -less awareness in districts further away from state head quarter .
This information may be useful not only for KVIC, but also other Micro industry/entrepreneur sponsoring organization in Assam, especially for planning awareness generation programmes etc. Taking the present study as base, one can further go on integrating data/ information for other Micro industry/entrepreneur sponsoring organizations in Assam. Which could be very much useful for strategic planning not only for KVIC, but also for other sponsoring organizations. For example let us take the case of conducting ‗Awareness programme‘ or ‗People‘s education programme‘; this is a common activity for KVIC and other Micro industry/entrepreneur sponsoring organizations for generating awareness on self-employment, entrepreneurship etc. From our earlier drawn inferences we can say that-
o We have got, larger the geographical area of a district, larger the number of participants joining EDP training. So for larger geographical area more number of ‗Awareness programme‘ or ‗People‘s education programme‘ may be planned.
o Similarly, more number of ‗Awareness programme‘ or ‗People‘s education programme‘ may be planned for districts further away from state head quarter.
V. CONCLUSION
This paper is an attempt for motivating towards application of data mining technology as an aid, in the decision making process, in place of or along with traditional processes followed by Entrepreneurship development organizations, such as KVIC etc. This data mining technology can be useful not only for general trends, but also for finding trends in area wise selection of village industry type etc.[6]. The attractiveness of this data mining is that –most of the required knowledge can be extracted from the existing databases. Furthermore instead of only selected area, overall computerization may improve efficiency of KVIC like organizations. [8] Demonstrates the use of an approach for the development of performance measurement system at one end and a workable framework of balanced scorecard at other end for a real case company KVIC.
REFERENCES
[1] Day, N.B. and Rahman, M. 2010, ―Micro and Small Enterprises in NE India- problems & prospects‖, EBH Publishers (India). [2] Devedzic, V., 2001 ―Knowledge Discovery and DM in Databases‖,
FON- School of Business Administration, University of Belgrade, Yugoslavia.
[3] Gupta, S.C. and Gupta, I., 2012, ―Business Statistics‖, Himalaya Publishing House (India).
[4] Inayatullah, J. and Birley, S.1997, ―The Orangi Pilot Project: The evaluation of a Micro enterprise Credit Institution,‖ Entreprenuership & Regional Development, 9(4), pp 299-318. [5] Lall, S. 1997, ―Learning from the Asian Tigers: Studies in
Technology and Industrial policy‖. London: Macmillan Press Ltd. [6] Sarma N. and Talukdar P.H. 2013, ―Cluster Identification for Micro
& Small Enterprises in North East India: A case study on KVIC sponsored Village Industries in Assam‖, International Journal of Computer Communications and Networks, Vol.2 No:2, pp 49-59 . [7] Tan, P., Steinback, M., and Kumar, V. 2009, ―Introduction to Data
Mining‖, Pearson Education.
[8] Thakkar, J., Deshmukh, S.G., Gupta, A.D. and Sankar, R., 2006 ―Development of balanced scorecard-An integrated approach of interpretive Structural Modeling (ISM) and Analytical Network Process (APN)‖, International Journal of Productivity and Performance Management, Vol. 56 Iss:1, pp 25-59.
[9] http://www.assam.gov.in/ - Govt.of Assam web link. [10] http://www.kvic.org.in/ - KVIC web link. [11] http://www.msme.gov.in /- Ministry of MSMEs. [12] http://www.nird.org.in/ - NIRD web link.