2016, Volume 3, e3072 ISSN Online: 2333-9721 ISSN Print: 2333-9705
Enhancing the NaCl Tolerance Potential of
Wheat on Root Morphology and
Osmoregulation Substance by Exogenous
Application of
Bacillus subtilis
QM3
Ruiqing Liu, Caifang Wen, Zhifang Zhao, Guang Rong, Jianguo Xu, Qingping Hu
*College of Life Sciences, Shanxi Normal University, Linfen, China
Abstract
Bacillus subtilis QM3 is a strain of antagonistic strains which have biological control function. Salinity is the most important limiting plant factor for agriculture devel-opment and growth changes in wheat. The present study was carried out to test to-lerance involved in salt stress alleviation in wheat (Triticum aestivum L.) through the root application of B. subtilis QM3. Experiment was performed after germinating for two days. Wheat root was first grown under B. subtilis QM3 with four levels (108
CFU/ml B. sutilis QM3 (M1), 107 CFU/ml B. subtilis QM3 (M2), 106 CFU/ml B.
sub-tilis QM3 (M3) and 105 CFU/ml B. subtilis QM3 (M4)), then poured with saline
re-gime of NaCl of six concentrations (50, 100, 150, 200, 250, 300 mmol/L) compared along with control. The results of present study showed that B. subtilis QM3 clearly promoted the growth of the root morphology and the content of osmoregulation substance (p < 0.05), and 106 CFU/ml B. subtilis QM3 (M3) was found to be very
ef-fective in mitigation of NaCl stress by promoting the growth of the wheat root and adjusting the content of osmoregulation substance in wheat root.
Subject Areas
Microbiology
Keywords
B. subtilis QM3, Salinity, Osmoregulation Substance, Root Morphology, NaCl Stress
1. Introduction
Salinity is one of the major environmental challenges and it causes a substantial crop
How to cite this paper: Liu, R.Q., Wen, C.F., Zhao, Z.F., Rong, G., Xu, J.G. and Hu, Q.P. (2016) Enhancing the NaCl Tolerance Potential of Wheat on Root Morphology and Osmoregulation Substance by Exoge- nous Application of Bacillus subtilis QM3. Open Access Library Journal, 3: e3072. http://dx.doi.org/10.4236/oalib.1103072
Received: October 19, 2016 Accepted: November 10, 2016 Published: November 14, 2016
Copyright © 2016 by authors and Open Access Library Inc.
This work is licensed under the Creative Commons Attribution International License (CC BY 4.0).
revenue loss [1]. At present, soils of salt affected existed mostly under arid, semiarid climate because low humidity and high temperature covered approximately 800 million hectares of world [1]. According to incomplete statistics, 20% agriculture lands are af-fected by salinity at world level [2]. Growth of the crops is usually diminished due to high or fluctuating salt concentrations. Salt inclusion is one of the principal mechan-isms which impair the osmotic adjustment due to accumulation of inorganic ions and particularly Na+ and Cl− to the toxic levels within plants through transpiration stream.
The study showed that accumulation of Na+ and Cl− was increased and K+ was
de-creased as concentration of NaCl was inde-creased [3]. Generally, those plants have high affinity for K+ uptake, while transporters will have low Na+ uptake. Similar results had
been observed in other reports [4] [5]. High concentration of NaCl in the soil poses os-motic stress and ionic stress, which reduce the ability of plants to absorb water and min-erals [6]. Excessive accumulation of sodium (Na+) ion in the cytosol damages cell
mem-brane, which leads to leakage of electrolytes and affects metabolic activities in cytosol. Seedling growth of several crops was affected by a detrimental factor, which created an osmotic potential in the rhizosphere of the plant. Na+ and Cl– compete with other
nutrients including K+, Ca2+, and NO3–, which may cause unbalance distribution and
act negatively on biophysical and metabolic processes [7]. Roots and the whole crop in-hibit the absorption of water or create toxic effect due to Na+ and Cl− [8]. A study
con-ducted by Ahmad and Riffat [9] on peas showed that all these changes were associated with reduction in relative water contents and K+ uptake. According to this study,
pro-line and sugar contents were significantly increased while nitrate reductase activity and chlorophyll contents were decreased.
Wheat is the third largest crop products and occupies an important position in the globe. A world population growing in number will require more grain each year. How-ever, the salinization of the soil and other abiotic factors severely restrict the enhance-ment of wheat production. So, it is necessary to find methods to improve the ability of wheat to tolerate salinity. It is well known that root is the most important part of cereal, which not only can support fixation plant, but also can absorb and store salinity in the soil. Therefore, the study of plant root system has important significance on effects of salinity in soil.
In the recent past, many researchers have focused on the performance of plant growth promoting rhizobacter. A few studies have focused on alleviation of salt stress of plant, while the studies on the mitigate effect of bacteria on plant growth under salt stress are limited. Bacillus subtilis, a prokaryotic life form all around the world, is a big family that exhibits adaptation to include high salinity, drought, high and low temper-atures and contaminated soils. B. subtilis QM3, a strain of antagonistic strains, has bio-logical adjustment and control functions and is isolated from dung of Qinghai yak. Some studies have showed that B. subtilis QM3 improved germination rate of wheat seed and eased heavy metal stress of wheat seeding. So it is necessary to probe whether
The present investigation intends to study the influence of B. subtilis QM3 on mor-phology and metabolites (total soluble sugar, soluble proteins, proline and malon dial-dehyde) of wheat root growing under different concentrations of salinity stress. The re-search results will provide some theoretical and practical bases to increase crop produc-tion in salt lick.
2. Materials and Methods
2.1. Plant Material and Bacterial Suspension Preparati
Seeds were purchased from the Research Institute of wheat in Shanxi Province of china
B.subtilis strains QM3 were isolated from Shanxi normal university, college of life science microbiology laboratory. These strains were inoculated in a flask of 250 mL vo-lume containing nutrient broth media (NB) and vigorous shaking (200 rpm) at 37˚C three to four days. These cultures were centrifuged 4000rpm for 10minutes at 20˚C each time, then refuse to go to clear liquid. This process was repeated use of sterile wa-ter three times. Finally these bacwa-terial suspension liquid diluted to until the OD600nm in
0.8 to 0.9 (108 CFU/ml B. subtilis QM3). Followed, 108 CFU/ml B. subtilis QM3 which
bacterial suspension liquid was diluted 10 times (107 CFU/ml B. subtilis QM3), 100
times (106 CFU/ml B. subtilis QM3) and 1000 times (105 CFU/ml B. subtilis QM3) to
reserve.
2.2. Wheat Germination, Bacterium Suspension
Treatment and NaCl Stress Treatment
Seeds were selected to uniform, sterilized of 0.1% HgCl for 10 minutes then rinsed three times with sterile water and placed onto meter glass soaked in sterile water for 24 h. Then seeds were divided into five large groups germination of two days, each large group was placed in 7 petri dishes, five large groups respectively cultivated with sterile water (CK), 108 CFU/ml B. subtilis QM3 (M1), 107 CFU/ml B. subtilis QM3 (M2), 106
CFU/ml B. subtilis QM3 (M3) and 105 CFU/ml B. subtilis QM3 (M4) for 2 days. Then
exogenous application of NaCl with seven doses (50, 100, 150, 200, 250 and 300 mmol/L) were applied along with control. After three days’, root morphological indexes were measured and osmoregulation substance content were evaluated. In total, the seedlings were grown in a constant temperature light incubator (25˚C; 14 h/10 h light/ dark period; and 55% relative humidity). There were three replications for each treatment.
2.3. Root Growth Analysis
Plants were harvested at day 7 and were divided into shoots and roots. Each gradient randomly selected three uniform roots to determine the root morphology index using the Win-RHIZO system [10]. There were three replications for each treatment.
2.4. Physiological Attributes
2.4.1. Soluble Total Sugar Content Assay
roots were cut up into 20 ml calibration tubes with 10 ml distilled water, which were li-able to boil over about 30 min. The supernatant was filtrated to a volume of 20 ml cali-bration tube. There were three replications for extraction. Soluble total sugar were ana-lyzed by reacting of 0.5 ml of sample extraction buffer with 1.5ml distilled water, 7.0 ml freshly prepared anthrone (1 g anthrone + 50 ml ethyl acetate + 98% H2SO4) which
were incubated one minutes in boiling water bath. Then determination of the samples of natural cooled at 630 nm.
2.4.2. Soluble Total Protein Content Assay
Total protein concentration of the supernatant was determined according to the me-thod described by [12] with bovine serum albumin as a standard. An amount of 2 gm of samples were grinded in mortar with 5 ml of phosphate buffer (pH 7.6) and was then transformed to the centrifuge tubes. The homogenate was centrifuged at 8000 rpm for 20 minutes. The supernatant of different samples were made equal by adding phos-phate buffer solution. After extraction, 30 μl of different samples were mixed with 70 μl of distilled water separately. In all of these separate sample tubes 2.9 ml of Coomassie Brilliant Blue solution was then added and mixed thoroughly. The Total volume now was 3ml in each tube. All these tubes were incubated for 5 minutes at room tempera-ture and absorbance at 600 nm was recorded against the reagent blank. A standard curve of Absorbance (600 nm) versus Concentration (μg) of protein was calculated.
2.4.3. The Content of Proline
Proline was assayed according to sulfosalicylic acid colorimetry [13]. 0.25 g fresh roots were put into large test tubes with 10 ml 30% sulfosalicylic acid, which was liable to boil over about 10 min. Supernatants were filtrated to clean the tubes. Proline were meas-ured that 2 ml of proline extraction buffer, 4.0 ml reaction liquid (2 ml of acid ninhy-drin + 2 ml of glacial acetic acid) and which were stayed 30 minutes in boiling water bath. The reaction was stopped by placing test tubes in an ice water bath and then mix-ing vigorously with toluene. The chromophore containmix-ing toluene was separated and absorbance read at 520 nm using toluene as a blank.
2.4.4. The Content of MDA
The content of MDA was measured by thiobarbituric acid colorimetry [14] [15].
2.5. Statistical Analysis
The obtained results were analyzed statistically by SPSS (version 17.0) statistical soft-ware. Data were analyzed by the analysis of variance (ANOVA) and treatment mean comparison by using least significance difference (LSD; P = 0.05). Values were ex-pressed as means ± standard deviation (SD).
3. Results
3.1.
B. subtilis
QM3 Inoculation Effect on Wheat Root
Morphology under NaCl Stress
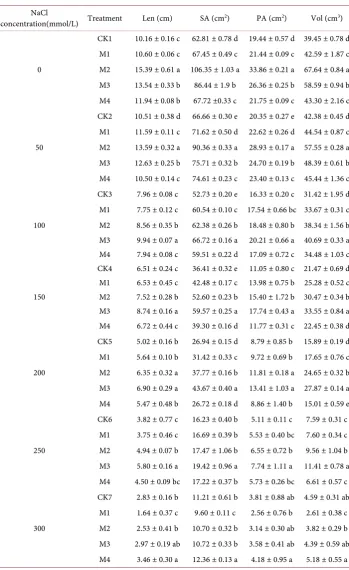
Table 1. Effects of B. subtilis QM3 on the growth of root under NaCl stress. NaCl
concentration(mmol/L) Treatment Len (cm) SA (cm2) PA (cm2) Vol (cm3) CK1 10.16 ± 0.16 c 62.81 ± 0.78 d 19.44 ± 0.57 d 39.45 ± 0.78 d
M1 10.60 ± 0.06 c 67.45 ± 0.49 c 21.44 ± 0.09 c 42.59 ± 1.87 c 0 M2 15.39 ± 0.61 a 106.35 ± 1.03 a 33.86 ± 0.21 a 67.64 ± 0.84 a M3 13.54 ± 0.33 b 86.44 ± 1.9 b 26.36 ± 0.25 b 58.59 ± 0.94 b M4 11.94 ± 0.08 b 67.72 ±0.33 c 21.75 ± 0.09 c 43.30 ± 2.16 c CK2 10.51 ± 0.38 d 66.66 ± 0.30 e 20.35 ± 0.27 e 42.38 ± 0.45 d M1 11.59 ± 0.11 c 71.62 ± 0.50 d 22.62 ± 0.26 d 44.54 ± 0.87 c 50 M2 13.59 ± 0.32 a 90.36 ± 0.33 a 28.93 ± 0.17 a 57.55 ± 0.28 a M3 12.63 ± 0.25 b 75.71 ± 0.32 b 24.70 ± 0.19 b 48.39 ± 0.61 b M4 10.50 ± 0.14 c 74.61 ± 0.23 c 23.40 ± 0.13 c 45.44 ± 1.36 c CK3 7.96 ± 0.08 c 52.73 ± 0.20 e 16.33 ± 0.20 c 31.42 ± 1.95 d M1 7.75 ± 0.12 c 60.54 ± 0.10 c 17.54 ± 0.66 bc 33.67 ± 0.31 c 100 M2 8.56 ± 0.35 b 62.38 ± 0.26 b 18.48 ± 0.80 b 38.34 ± 1.56 b M3 9.94 ± 0.07 a 66.72 ± 0.16 a 20.21 ± 0.66 a 40.69 ± 0.33 a M4 7.94 ± 0.08 c 59.51 ± 0.22 d 17.09 ± 0.72 c 34.48 ± 1.03 c CK4 6.51 ± 0.24 c 36.41 ± 0.32 e 11.05 ± 0.80 c 21.47 ± 0.69 d M1 6.53 ± 0.45 c 42.48 ± 0.17 c 13.98 ± 0.75 b 25.28 ± 0.52 c 150 M2 7.52 ± 0.28 b 52.60 ± 0.23 b 15.40 ± 1.72 b 30.47 ± 0.34 b M3 8.74 ± 0.16 a 59.57 ± 0.25 a 17.74 ± 0.43 a 33.55 ± 0.84 a M4 6.72 ± 0.44 c 39.30 ± 0.16 d 11.77 ± 0.31 c 22.45 ± 0.38 d CK5 5.02 ± 0.16 b 26.94 ± 0.15 d 8.79 ± 0.85 b 15.89 ± 0.19 d M1 5.64 ± 0.10 b 31.42 ± 0.33 c 9.72 ± 0.69 b 17.65 ± 0.76 c 200 M2 6.35 ± 0.32 a 37.77 ± 0.16 b 11.81 ± 0.18 a 24.65 ± 0.32 b M3 6.90 ± 0.29 a 43.67 ± 0.40 a 13.41 ± 1.03 a 27.87 ± 0.14 a M4 5.47 ± 0.48 b 26.72 ± 0.18 d 8.86 ± 1.40 b 15.01 ± 0.59 e CK6 3.82 ± 0.77 c 16.23 ± 0.40 b 5.11 ± 0.11 c 7.59 ± 0.31 c M1 3.75 ± 0.46 c 16.69 ± 0.39 b 5.53 ± 0.40 bc 7.60 ± 0.34 c 250 M2 4.94 ± 0.07 b 17.47 ± 1.06 b 6.55 ± 0.72 b 9.56 ± 1.04 b M3 5.80 ± 0.16 a 19.42 ± 0.96 a 7.74 ± 1.11 a 11.41 ± 0.78 a M4 4.50 ± 0.09 bc 17.22 ± 0.37 b 5.73 ± 0.26 bc 6.61 ± 0.57 c CK7 2.83 ± 0.16 b 11.21 ± 0.61 b 3.81 ± 0.88 ab 4.59 ± 0.31 ab
M1 1.64 ± 0.37 c 9.60 ± 0.11 c 2.56 ± 0.76 b 2.61 ± 0.38 c 300 M2 2.53 ± 0.41 b 10.70 ± 0.32 b 3.14 ± 0.30 ab 3.82 ± 0.29 b M3 2.97 ± 0.19 ab 10.72 ± 0.33 b 3.58 ± 0.41 ab 4.39 ± 0.59 ab M4 3.46 ± 0.30 a 12.36 ± 0.13 a 4.18 ± 0.95 a 5.18 ± 0.55 a
CK, M1, M2, M3 and M4 respectively represent the control group (treated with sterile water), 108 CFU/ml B. subtilis
QM3 (M1), 107 CFU/ml B. subtilis QM3 (M2), 106 CFU/ml B. subtilis QM3 (M3) and 105 CFU/ml B. subtilis QM3
M2, M3, M4) significantly increased wheat root growth as compared to control group (CK) at all NaCl (50, 100, 150, 200 and 250 mmol/L) levels, but at the NaCl concentra-tion was 300 mmol/L, Compared with control group (CK7), M3 and M4 increased, M1 and M2 decreased wheat root growth. When without NaCl stress, even NaCl concen-tration was 0 mmol/L, M1, M2 ,M3 and M4 treatments compared with CK1, root length (Len), showed a obviously increase of 4.33%, 51.48%, 33.27% and 17.52%; sur-face area (SA), showed a respectively increase of 7.39%, 69.32%, 37.62% and 7.82%; projection area (PA), showed a respectively increase of 10.29%, 74.18% , 35.6% and 11.88%; volume (Vol), showed a respectively increase of 7.96%, 71.46%, 48.52%, and 9.76%. When without B. subtilis QM3 treatment, even, NaCl concentration were 50, 100, 150, 200, 250 and 300 mmol/L, wheat root growth were increased and then de-creased. Under the NaCl concentration was 50 mmol/L, wheat root growth reached the maximum, CK2, M1, M2, M3 and M4 compared with CK1, root length (Len), showed a obviously increase of 3.44%, 14.07%, 33.76%, 24.31% and 3.35%; surface area (SA), showed a obviously increase of 6.13%, 14.03%, 45.32%, 21.76% and 19.99%; projection area (PA), showed a obviously increase of 4.68%, 16.36%, 48.82%, 27.06% and 20.37%; volume (Vol), showed a obviously increase of 2.39%, 12.90%, 45.88%, 22.66% and 15.18%. The above data shows, when NaCl concentration were 0 and 50 mmol/L,M1, M2, M3, and M4 was higher than that of CK, and M2 treatment was most significant than any other treatments. However, when NaCl concentration were 100, 150, 200 and 250 mmol/L, M1, M2, M3, and M4 were higher than that of CK, M3 treatment was most significant than any other treatments. So, When NaCl concentration were 50, 100, 150, 200, 250 and 300 mmol/L, not all concentrations of the B. subtilis QM3 bacteria liquid have a role in remission, and between different NaCl concentration stress , the effect of the same concentration of B. subtilis QM3 is different. In a certain degree, B. subtilis QM3 had an alleviation effect on the growth of the wheat root under NaCl stress.
3.2.
B. subtilis
QM3 Inoculation Effect on Wheat Root
Soluble Sugar Content under NaCl Stress
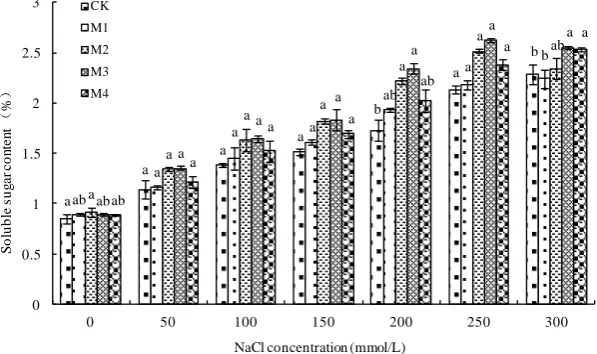
NaCl treatment caused soluble sugar content of M1, M2, M3 and M4 treatments for wheat root and the CK showed a tendency that soluble sugar content were gradually increased with the increase of NaCl concentration (Figure 1). Under the NaCl concen-tration were 50, 100, 150, 200 and 250 mmol/L, the content of soluble sugar of M1, M2, M3 and M4 treatment were higher than that of CK, M3 treatment was enhanced signif-icantly as compared with any other treatments. However, when the NaCl concentration were 300 mmol/L, the content of MDA of wheat root of M2, M3 and M4 treatment were higher than that of CK, M1 treatment the content of soluble sugar was lowest. Among all the NaCl treatment, the higher the salt concentration, the better B. subtilis
Figure 1. Effects of B. subtilis QM3 on content of soluble total sugar of wheat root under differ-ent NaCl stress. Values represdiffer-ent means of three independdiffer-ent replicates ± SD. CK, M1, M2, M3 and M4 respectively represent the control group (treated with sterile water), 108 CFU/ml B. subti-lis QM3 (M1), 107 CFU/ml B. subtilis QM3 (M2), 106 CFU/ml B. subtilis QM3 (M3) and 105
CFU/ml B. subtilis QM3 (M4). Different letters within a column mean statistically significant differences between the means (p < 0.05).
3.3.
B.subtilis
QM3 Inoculation Effect on Wheat Root
Total Protein Content under NaCl Stress
With the increasing of NaCl concentration, the results showed that change of soluble protein content were increased after decreased in wheat root (Figure 2). Under the NaCl concentration was 150 mmol/L, wheat root soluble protein content reached the maximum. when without NaCl stress, B. subtilis QM3 had an obvious promotion to soluble protein content, compared with CK1, M1, M2 , M3 and M4 respectively in-creased by 3.98%, 10.45%, 4.13% and 6.10%. Under NaCl concentrations were 200 mmol/L, 250 mmol/ L, 300 mmol/L, soluble protein content of wheat root under the treatment of M1, M2, M3 and M4 were higher than that of CK, while under the NaCl concentrations were 50 mmol/L and 100 mmol/L, soluble protein content of wheat root under the treatment of M1, M2 and M3 were higher than that of CK and M4, while so-luble protein content of M4 treatment was the lowest. When NaCl concentration was 150 mmol/L, there was no difference between CK, M1, M2 and M3, while soluble pro-tein content of M4 treatment was the highest. In the NaCl solution concentrations were 0 mmol/L, 200 mmol/L, 250 mmol/L and 300 mmol/L, soluble protein content of B. subtilis QM3 treatment was enhanced obviously than CK. While the NaCl concentra-tion were 50 mmol/L, 100 mmol/L, Some of the concentraconcentra-tion of B. subtilis QM3 treatment was enhanced than CK, and 150 mmol/L among different treatments there was a slight change in the soluble protein content.
3.4.
B.subtilis
QM3 Inoculation Effect on Wheat Root
Proline Content under NaCl Stress
Without B. subtilis QM3 treatment, the results exhibit that the content of proline were
a a a a b a b ab a a a ab a b a a a a a a ab ab a a a a a a ab a a a ab a a 0 0.5 1 1.5 2 2.5 3
0 50 100 150 200 250 300
S ol ubl e s ug a r c on te n t ( % )
NaCl concentration (mmol/L) CK
M1 M2
Figure 2. Effects of B. subtilis QM3 on content of total protein of wheat root under different NaCl stress. CK, M1, M2, M3 and M4 respectively represent the control group (treated with ste-rile water), 108 CFU/ml B. subtilis QM3 (M1), 107 CFU/ml B. subtilis QM3 (M2), 106 CFU/ml B. subtilis QM3 (M3) and 105 CFU/ml B. subtilis QM3 (M4). Values in the chart are given as mean
± SD for 3 replicates. Different letters in the same NaCl concentration column mean significant difference among treatments (p < 0.05).
increased under the increasing of NaCl concentration, under 300mmol/L NaCl concen-tration which reached the maximum (Figure 3). Under the different concentrations of NaCl stress, a certain concentration of B. subtilis QM3 treatment significantly de-creased the content of proline. On the whole, the content of proline of wheat root under the NaCl treatment of M1, M2 and M3 were lower than that of CK and M4, However, when NaCl concentrations were 0 mmol/l and 50 mol/L, M1 treatment was reduced obviously than any other treatment, and when NaCl concentrations were 100 mmol/l, 150 mmol/L, 200 mmol/L, 250 mmol/L and 300 mmol/L, M3 treatment was the lowest at all. In all treatment groups, compared with CK, the M4 treatment almost didn’t have any relief effect.
3.5.
B.subtilis
QM3 Inoculation Effect on Wheat Root
MDA Content under NaCl Stress
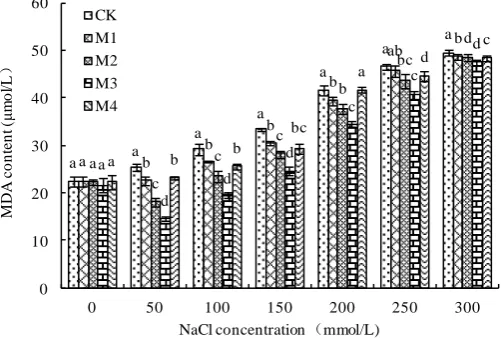
With the increasing of NaCl concentration, the content of MDA of wheat root of M1, M2, M3 and M4 treatments for wheat root and CK showed a tendency that the content of MDA were increased in NaCl treatment levels(Figure 4). Under the NaCl concentra-tion were 50, 100, 150, 200, 250 and 300 mmol/L, the content of MDA of M1, M2, M3 and M4 treatment were lower than that of CK, M3 treatment was significantly as com-pared with any other treatments. M1, M2, M3 and M4 respectively increased by 11.37%, 28.68% 42.36% and 8.94% when the NaCl concentration was 50 mmol/L. Un-der the NaCl concentration was 0 mmol/L, the content of MDA of wheat root, com-pared with CK1, M1, M2 and M4 no obvious different, M3 was the lowest.
a a a b d c b a a a b bc abc b a a a b ab ab b a a a b a a a a a a a cd c a 0 10 20 30 40 50 60
0 50 100 150 200 250 300
S o lu b le p ro te in c o n te n t ( m g /g )
NaCl concentration (mmol/L)
Figure 3. Effects of B. subtilis QM3 on content of proline of wheat root under different NaCl stress. CK, M1, M2, M3 and M4 respectively represent the control group (treated with sterile wa-ter), 108 CFU/ml B. subtilis QM3 (M1), 107 CFU/ml B. subtilis QM3 (M2), 106 CFU/ml B. subtilis
QM3 (M3) and 105 CFU/ml B. subtilis QM3 (M4). Values in the chart are given as mean ± SD for
3 replicates. Different letters in the same NaCl concentration column mean significant difference among treatments (p < 0.05).
Figure 4. Effects of B. subtilis QM3 on content of MDA of wheat root under different NaCl
stress. Values represent means of three independent replicates ± SD. CK, M1, M2, M3 and M4 respectively represent the control group (treated with sterile water), 108 CFU/ml B. subtilis QM3
(M1), 107 CFU/ml B. subtilis QM3 (M2), 106 CFU/ml B. subtilis QM3 (M3) and 105 CFU/ml B. subtilis QM3 (M4). Different letters within a column mean statistically significant differences between the means (p < 0.05).
4. Discussion
Higher NaCl concentration, the dominant salt in the soil, has a direct effect on plant growth, poses osmotic stress and ionic stress, which reduces the ability of plants to ab-sorb water and minerals [6] [16].
NaCl stresses affect negatively first seed germination and then root length. Plant ear-ly growth stage is more sensitive as compared to later stages so inoculation with bacte-ria having ability to mitigate salinity stress can be helpful for plants to overcome from
ab a a a a a a b c b b b ab b ab b b bc b b b ab ab c a c b b a a a c ab a a 0 20 40 60 80 100 120 140 160
0 50 100 150 200 250 300
P ro lin e c o n te n t ( μg /g )
NaCl concentration (mmol/L) CK M1 M2 M3 M4 a a a a a a a a b b b b ab b a c c c b bc d a d d d c c d
a b b
bc a d c 0 10 20 30 40 50 60
0 50 100 150 200 250 300
M D A c o n te n t ( μm o l/L )
NaCl concentration (mmol/L)
[image:9.595.249.500.329.498.2]stress [17] [18] [19].
Different researchers have also reported that PGPR inoculation also improved seed genrmination under salinity stress [20] [21] [22]. Na+ and Cl- are necessary to plant
growth, then a number of reports have showed that high concentration of NaCl stress inhibit plant root and proliferation [23] [24] [25] [26]. Our result was carried out to evaluate exogenous application of Bacillus subtilis QM3 enhancing NaCl tolerant po-tential of wheat through assessing on root morphology and osmoregulation substance attributes, which showed that NaCl stress caused a significant inhibition on wheat root growth, including the root length, root surface area, root volume and root projection. However, under the NaCl concentration of 50 mmol/L, the wheat root growth was promoted, it may due to the dual role of NaCl in plant. From other NaCl concentra-tions stress, in a certain degree, B. subtilis QM3 had an enhanced the NaCl tolerance potential on the growth of the wheat root.
As plant osmoregulation substances are concerned in regulating a series of physio-logical and biochemical processes, changes in physiophysio-logical conditions like proline, protein and carbohydrate [27], biosynthesis the analysis of the role of new plant growth regulators in crop abiotic stress tolerance is being a great deal of focus these days [28]. It has been commonly reported that salt stress is one of the major causes of oxidative damage to plant tissues [29].
Sugars perform important regulatory functions in plants including photosynthesis
[30] and carb ohydrate partitioning [31] [32]. Soluble sugar to osmotic adjustment, the increase of its concentration could increase the concentration of cell protoplasm, to maintain normal membrane function.
Excessive salt accumulation is the obvious effects on protein metabolism, which in-hibit synthesis and promote decomposition. The inin-hibit protein synthesis directly causes may be the synthesis of amino acids.
The accumulation of amino acids was involved in osmotic adjustment, free radical scavenging, maintenance of protein and membrane integrity [33]. A number of reports have showed the amount of the content of proline increased significantly and gradually with increasing NaCl concentration. Proline serves as an important compatible osmo-lyte, and its accumulation is believed to reduce cellular water potential and avoid dele-terious toxicity of high ionic strength, has also been proposed to serve as reactive oxy-gen species scavenger [34] and its accumulation can stabilize the structure of mem-branes and proteins to minimize the damage of cells under salt stress.
It was reported that MDA content on different plant species increased significantly with the processing salt level rising [35] [36]. These increases may be attributed to that salinity could modify the membrane structure and stimulate O2 production, which
faci-litates lipid peroxidation [37].
treatment compared with control group, under the different level can be increased or decreased osmoregulation substance to increase the osmotic regulation ability of wheat root, enhancing the NaCl tolerance potential on wheat root, and M3 treatment is most obvious effect than any other treatments.
On the whole, plant self-protection ability is limited, a certain of NaCl concentration stresses in wheat root, compared with the control group, the treatment of B. subtilis
QM3 contributed to osmotic regulation ability of the wheat root improved to a certain degree, so as to restrain the excessive accumulation of Na+ and Cl- caused permeability
damage, reduce lipid peroxidation of cell membrane and maintain the relative integrity and orderliness, at last, enhanced the NaCl tolerance potential on the growth of the wheat root. By comparison, 106 CFU/ml B. subtilis QM3 bacteria liquid treatment was
enhanced obviously than any other treatments. 108 CFU/ml B. subtilis QM3 and 107
CFU/ml B. subtilis QM3 has a higher concentration, and 106 CFU/ml B. subtilis QM3
has a lower concentration, these two reasons may lead to their alleviate effect are not as good as 106 CFU/ml B.subtilis QM3 solution.
5. Conclusion
When the plants suffer NaCl stress, bacterium induces the concentration of osmoregu-lation content to improve the penetration ability by combining with wheat roots, re-sulting in increased plant tolerance to NaCl. In this study, the wheat root inoculated with 106 CFU/ml B. subtilis QM3 conformed better effect in terms of root morphology,
soluble sugar content, total protein content, MDA content and proline content as compared to 108 CFU/ml B. subtilis QM3, 107 CFU/ml B. subtilis QM3 and 105 CFU/ml
B. subtilis QM3. Such studies are necessary to select a suitable bacterium and an optim-al concentration of a suitable bacterium to be used as bioinoculant for sustainable wheat production under saline areas.
Acknowledgements
This work was financially supported by a Project of the Natural Science Foundation of Shanxi Province, China (Project No. 201601D011070).
References
[1] Khan, A.H., Singh, A.K., Mubeen, Singh, S., Zaidi, N.W., Singh, U.S. and Haefele, S.M. (2014) Response of Salt-Tolerant Rice Varieties to Biocompost Application in Sodic Soil of Eastern Uttar Pradesh. American Journal ofPlant Sciences, 5, 7-13.
http://dx.doi.org/10.4236/ajps.2014.51002
[2] Yeo, A.R. (1999) Predicting the Interaction between the Effects of Salinity and Climate Change on Crop Plants. Scientia Horticulturae, 78, 159-174.
http://dx.doi.org/10.1016/S0304-4238(98)00193-9
[4] Maathuis, F.J.M. and Amtmann, A. (1999) K+ Nutrition and Na+ Toxicity: The Basis of
Cellular K+/Na+ Ratios. Annals of Botany, 84, 123-133.
http://dx.doi.org/10.1006/anbo.1999.0912
[5] Cengiz, K., Tuna, A.L., Muhammad, A. and Hakan, A. (2007) Improved Salt Tolerance of Melon (Cucumis Melo L.) by Addition of Proline and Potassium Nitrate. Environmental and Experimental Botany, 60, 397-403. http://dx.doi.org/10.1016/j.envexpbot.2006.12.008 [6] Munns, R., James, R.A. and Läuchli, A. (2006) Approaches to Increasing the Salt Tolerance
of Wheat and Other Cereals. Journal of Experimental Botany, 57, 1025-1043.
http://dx.doi.org/10.1093/jxb/erj100
[7] Mansour, M., Salama, K. and Ali, F. (2005) Cell and Plant Responses to NaCl in Zea mays
L. Cultivars Differing in Salt Tolerance. General and Applied Plant Physiology, 35, 29-41. [8] Khajeh-Hosseini, M., Powell, A.A. and Bimgham, I.J. (2003) The Interaction between
Salin-ity Stress and Seed Vigor during Germination of Soybean Seeds. Seed ScienceTechnology, 31, 715-725.http://dx.doi.org/10.15258/sst.2003.31.3.20
[9] Ahmad, P. and Riffat, J. (2005) Effect of Salt Stress on Growth and Biochemical Parameters of pisum sativum L. Archives of Agronomy and Soil Science, 51, 665-672.
http://dx.doi.org/10.1080/03650340500274151
[10] Hao, Y., Wu, H.T., Liu, Y.F. and Hu, Q.P. (2015) Mitigative Effect of Bacillus subtilis QM3 on Root Morphology and Resistance Enzyme Activity of Wheat Root under Lead Stress.
Advances in Microbiology, 5, 469-478.http://dx.doi.org/10.4236/aim.2015.56048
[11] Ding, Y., Luo, W. and Xu, G. (2006) Characterization of Magnesium Nutrition and Interac-tion of Magnesium and Potassium in Rice. Annals of Applied Biology, 149, 111-123. http://dx.doi.org/10.1111/j.1744-7348.2006.00080.x
[12] Badford, M.M. (1976) A Rapid and Sensitive Method for the Quantitation of Microgram Quantities of Protein Utilizing the Principle of Protein Dye Binding. Analytical Biochemi-stry, 72, 248-254. http://dx.doi.org/10.1016/0003-2697(76)90527-3
[13] Bates, L.S., Waldren, R.P. and Reare, I.D. (1973) Rapid Determination of Free Proline for Water Stress Studies. Plant and Soil, 39, 205-207. http://dx.doi.org/10.1007/BF00018060 [14] Heath, R.L. and Packer, L. (1968) Photoperoxidation in Isolated Chloroplasts: I. Kinetics
and Stoicchiometry of Fatty Acid Peroxidation. Archives of Biochemtry Biophysics, 125, 189-198. http://dx.doi.org/10.1016/0003-9861(68)90654-1
[15] Shah, K., Kumar, R.G., Verma, S. and Dubey, R.S. (2001) Effect of Cadmium on Lipid Pe-roxidation, Superoxide Anion Generation and Activities of Antioxidant Enzymes in Grow-ing Rice SeedlGrow-ings. Plant Science, 161, 1135-1144.
http://dx.doi.org/10.1016/S0168-9452(01)00517-9
[16] Munas, R. and Testar, M. (2008) Mechanism of Salinity Tolerance. Annual Review of Plant Biology, 59, 651-681. http://dx.doi.org/10.1146/annurev.arplant.59.032607.092911
[17] Nadeem, S.M., Zahir, Z.A., Naveed, M., Asghar, H.N. and Arshad, M. (2010) Rhizobacteria Capable of Producing ACC-Deaminase May Mitigate Salt Stress in Wheat. Soil Science So-ciety of America Journal, 74, 533-542. http://dx.doi.org/10.2136/sssaj2008.0240
[18] Foolad, M.R. (2000) Genetic Basis of Salt Tolerance and Cold Tolerance in Tomato. Cur-rent Opinion in Plant Biology, 2, 35-49.
[20] Ashraf, M., Zafar, R. and Ashraf, M.Y. (2003) Time-Course Changes in the Inorganic and Organic Components of Germinating Sunflower Achenes under Salt (NaCl) Stress. Flora, 198, 26-36. http://dx.doi.org/10.1078/0367-2530-00073
[21] Nelson, L.M. (2004) Plant Growth Promoting Rhizobacteria (PGPR): Prospects for New Inoculants. Crop Management, 10, 301-305. http://dx.doi.org/10.1094/cm-2004-0301-05-rv [22] Barassi, C.A., Ayrault, G., Creus, C.M., Sueldo, R.J. and Sobrero, M.T. (2006) Seed
Inocula-tion with Azospirillum mitigates NaCl Effects on Lettucee. Scientia Horticulturae, 109, 8-
14. http://dx.doi.org/10.1016/j.scienta.2006.02.025
[23] Mishra, M., Kumar, U., Mishra, P.K. and Prakash, V. (2010) Efficiency of Plant Growth Promoting Rhizo-Bacteria for the Enhancement of Cicer arietinum L. Growth and Germi-nation under Salinity. Advances in Biological Research, 4, 92-96.
[24] Ashraf, M. (1994) Breeding for Salinity Tolerance in Plants. Critical Reviews Plant Sciences, 13, 17-42. http://dx.doi.org/10.1080/713608051
[25] Marschner, H. (1988) Mineral Nutrition of Higher Plants. Journal of Ecology, 76, 681-861. [26] Glick, B.R., Liu, C., Ghosh, S. and Dumbroff, E.B. (1997) Early Development of Canola
Seedlings in the Presence of the Plant Growth-Promoting Rhizobacterium Pseudomonas putida GR12-2. Soil Biology and Biochemistry, 29, 1233-1239.
http://dx.doi.org/10.1016/S0038-0717(97)00026-6
[27] Tang, D., Shi, S., Li, D., Hu, C. and Liu, Y. (2007) Physiological and Biochemical Responses of Scytonema javanicum (Cyanobacterium) to Salt Stress. Journal of Arid Environments, 71, 312-320. http://dx.doi.org/10.1016/j.jaridenv.2007.05.004
[28] Zvi, P. and Eduardo, B. (2011) Hormone Balance and Abiotic Stress Tolerance in Crop Plants. Current Opinion in Plant Biology, 14, 290-295.
http://dx.doi.org/10.1016/j.pbi.2011.02.001
[29] Sanjib, K.P., Lal, B.S. and Mohammad, H.K. (2003) Does Aluminum Phytotoxicity Induce Oxidative Stress in Green Gram (Vigna radiata)? Bulgarian Journal of Plant Physiology, 29, 77-86. https://www.researchgate.net/publication/237134047
[30] Rolland, F., Moore, B. and Sheen, J. (2002) Sugar Sensing and Signaling in Plants. Plant Cell, 14, 185-205.
[31] Tzyy-Jen, C. and Daniel, R.B. (1998) Sucrose Is a Signal Molecule in Assimilate Partition-ing. Proceedings of the National Academy of Sciences of the United States of America, 95, 4784-4788. http://dx.doi.org/10.1073/pnas.95.8.4784
[32] Fred, R. and Michael, W.B. (2003) Genetic Approaches to Understanding Sugar-Response Pathways. Journal of Experimental Botany, 54, 495-501.
http://dx.doi.org/10.1093/jxb/erg054
[33] Keutgen, A.J. and Pawelzik, E. (2008) Contribution of Amino Acids to Strawberry Fruit Quality and Their Relevance as Stress Indicators under NaCl Salinity. Food Chemistry, 111, 642-647. http://dx.doi.org/10.1016/j.foodchem.2008.04.032
[34] Verbruggen, N. and Hermans, C. (2008) Proline Accumulation in Plants: A Review. Amino Acids, 35, 753-759. http://dx.doi.org/10.1007/s00726-008-0061-6
[35] El-Beltagi, H.S., Salama, Z.A. and El Hariri, D.M. (2008) Some Biochemical Markers for Evaluation of Flax Cultivars under Salt Stress Conditions. Journal of Natural Fibers, 5, 316- 330. http://dx.doi.org/10.1080/15440470802252487
32, 89-106.
[37] Zhang, J. and Kirkham, M.B. (1996) Sorghum and Sunflower Seedlings as Affected by As-corbic Acid, Benzoic Acid and Prophyl Gallate. Journal of Plant Physiology, 149, 489-493. http://dx.doi.org/10.1016/S0176-1617(96)80323-3
Submit or recommend next manuscript to OALib Journal and we will provide best service for you:
Publication frequency: Monthly
9 subject areas of science, technology and medicine
Fair and rigorous peer-review system Fast publication process
Article promotion in various social networking sites (LinkedIn, Facebook, Twitter, etc.) Maximum dissemination of your research work
Submit Your Paper Online: Click Here to Submit