2018 International Conference on Physics, Computing and Mathematical Modeling (PCMM 2018) ISBN: 978-1-60595-549-0
A Study of Positioning Approach of Underground Blasting Based on
LS-DYNA Virtual Platform
Hao CHENG
1and Zhi-jie ZHANG
1,2,3,*1School of Instrument and Electronics, North University of China, Taiyuan, China
2Key Laboratory of Instrumentation Science & Dynamic Measurement (North University of China),
Ministry of Education, Taiyuan, China
3Automatic Test Equipment and System Engineering Research Center of Shanxi Province, North
University of China, Taiyuan, China
*Corresponding author
Keywords: Blasting center positioning, LS-DYNA, Distributed measurement system.
Abstract. The illegal exploitation of coal mine in China has been a threat to the national economy and the security of people's lives. It is necessary to efficiently monitor the illegal mining of coal, guarantee the safety of exploiters and restrain these unlawful activities. In order to determine the location of the blasting center, the theories of earthquake positioning were applied to get the location of underground blasting in this paper. The feasibility of these theories was testified by simulating the explosions on LS-DYNA virtual platform, and the optimal distribution method of test systems was obtained by comparing the results of different placement methods. Experimental results show that Multi-point circumferential distributed placement is most suitable for determining blasting center.
Introduction
China has an abundant reserve of coal resource. Shanxi, as a province with huge amount of mining, has made a significant contribution to the domestic industrial development. With the rising demand on this resource and the increase of the price level, some people illegally exploit the coal mine in order to earn the abnormal benefit, disregarding the national interests, disturbing the functioning of market economy, affecting the stability of society and more importantly, having a threat to the life safety of the exploiters[1].
The approach of blasting is widely applied in the private coal exploitation process, which will vibrate the earth crust at some extent [2]. Hence, this article tends to locate the underground blasting using the principles of earthquake positioning in order to stop the illicit activities in time, efficiently reduce the harm to people's welfare and guarantee the security of the production.
Study on Location Method of Underground Blasting Center
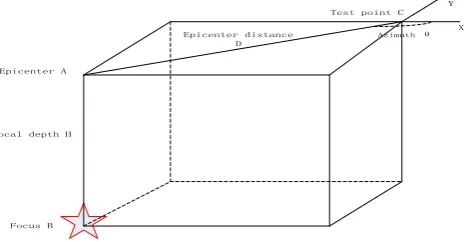
Traditionally, earthquakes can be divided into natural earthquakes and artificial earthquakes. The so-called artificial earthquakes refer to earthquakes caused by human activities [3]. The professional concepts include focus, the source of the earthquake; azimuth; epicenter distance; focal depth, etc.
Focus: The source of the earthquake. The blasting position of artificial blasting is indicated in this paper.
Epicenter: The point on the earth's surface directly above the focus is called the epicenter.
Azimuth: The right angle coordinate system is established with the test point as the origin. The azimuth is defined as the angle at which the test point rotates along the positive pointer of the x axis to the epicenter. The test point is on the horizontal ground with the epicenter.
Epicenter distance: Distance between test point and epicenter. Focal depth: Vertical distance from focus to epicenter.
Epicenter A
Focus B
Test point C
Azimuth θ
Focal depth H
Epicenter distance D
[image:2.595.179.413.74.195.2]X Y
Figure 1. Burst center location. Calculation Method of Azimuth Angle (θ)
The acceleration values of the x axis y axis and z axis produced by the explosion were collected at
the test point, denoted by x(t),y(t),z(t).
The three-dimensional covariance matrix of x(t),y(t),z(t) is obtained, such as Eq. 1.
)) ( var( )) ( ), ( cov( )) ( ), ( cov( )) ( ), ( cov( )) ( var( )) ( ), ( cov( )) ( ), ( cov( )) ( ), ( cov( )) ( var( t z t y t z t x t z t z t y t y t x t y t z t x t y t x t x
M (1)
The eigenvector corresponding to eigenvalue 1,2,3 is u1,u2,u3, and u1 satisfies the Eq. 2.
The azimuth is obtained by polarization analysis, as shown in Eq. 4:
] , , [ 11 12 13
1 u u u
u
(2)
arctan , 0 90
12 13 u u (3) 0 , 0 , 0 , 0 , 0 , 0 , 0 , 0 , 0 , 2 0 , 0 , 0 , 0 , 0 , 0 , 2 0 , 0 , 0 , 0 , 0 , 0 , 0 , 0 , 0 , 13 12 11 13 12 11 13 12 11 13 12 11 13 12 11 13 12 11 13 12 11 13 12 11 u u u u u u u u u u u u u u u u u u u u u u u u (4)
Calculation Method of Epicentral Distance (D)
In this paper, the epicentral distance is expressed by D. The P-band in the seismic wave can be quantitatively described by the gradual signal model, as shown in Eq. 5.
) ( ) exp( ) ( 0
0 t B t At i t u t
S
(5)
0
) ( ) exp(
)
(t B t At u t
Se
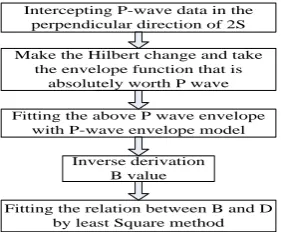
(6) Next, the concrete steps of calculating epicentral distance are given. First, the P wave in the vertical direction of 2S is captured; then the signal is transformed by Hilbert and the envelope function of P wave is obtained by taking the absolute value. Then, the 2S signal is transformed by Hilbert and the absolute value is taken as the envelope function of P-wave. Then the P-wave envelope function above is fitted with the P-wave envelope model in Eq. 6. The relation between B value and epicentral distance D is fitted by least square method after the inverse derivation of B value. The block diagram is shown in Fig. 2.
Calculation Method of Focal Depth (H)
The determination of depth can be seen from Fig. 1. In the right triangle composed of the explosive center, the epicenter and the test point. The epicentral distance is known, so the depth can be obtained according to the Pythagorean Theorem as long as the distance from the center of explosion to the test point is obtained [6].
V t
t H
D2 2 ( 1 0)
(7)
The t1 in Eq. 7 indicates the time point at which the seismic wave generated by the explosion
arrives at the test point. t0 indicates the time of the explosion and V represents the average velocity
of seismic waves propagating underground. Because of the attenuation of seismic wave propagation and the infeasibility of underground velocity measurement,so velocity V is hard to get. Now use the distributed test system to solve this problem.
Intercepting P-wave data in the perpendicular direction of 2S
Make the Hilbert change and take the envelope function that is
absolutely worth P wave
Fitting the above P wave envelope with P-wave envelope model
Inverse derivation B value
Fitting the relation between B and D by least Square method
5 6
2 3
X
Y
[image:3.595.119.260.400.516.2] [image:3.595.359.483.406.511.2]1 4
Figure 2. Epicentral distance solution flow chart. Figure 3. Layout test diagram.
As shown in Fig. 3, six test points are distributed on the circle of the same radius on the ground, in which the center of explosion lies at the origin. Each test point is an independent test system. In theory, every system is tested at the same depth, so take three test systems as a set of buildable Eq.
8-10, where D1/D2/D3 represents the epicentral distance of test point 1/2/3 respectively. t1/t2/t3
represents the time point at which the seismic wave reaches the test point 1/2/3, respectively. t0 is
the initiation time and H is the depth of explosion.
2 2
1 ( 1 0)
D H t t V
(8)
V t
t H
D ( 1 0)
2 2
2
(9)
V t
t H
D32 2 ( 1 0)
1 2
1 3
2 1
2 3
2 1
2 2
2 2
2 2
t t
t t
H D
H D
H D
H D
(11) At this point, three parameters determining the position of the core have been determined. Theoretically, the location of the center of explosion can be determined.
LS-DYNA Simulation
LS-DYNA finite element simulation has good applicability for underground explosion simulation [7]. In this paper, Hperwork is used for finite element mesh generation, ANSYS calculation K file and post-processing analysis for LS-prepost. Fig. 4 is the result of simulation. The left image shows the result of grid division and defines three kinds of materials: air, soil and explosives. The
explosion environment of 1 m3is simulated in which the air is above and the explosive is located inside the soil with a depth of 0.4 m. The right picture shows an instant of the dynamic process of an explosion [8].
1 5 13 21 9
17
7 15 23 3 11
19 X
Y
2
6 8
4 10 12
18 20
16 14 24
22
Figure 4. Simulation map. Figure 5. Distributed test system placement. The distributed test system can centrally manage the test equipment in different locations through local area network, which can meet the new requirements of the test under the new situation, and the accuracy of the test results is higher than that of a single test [9].
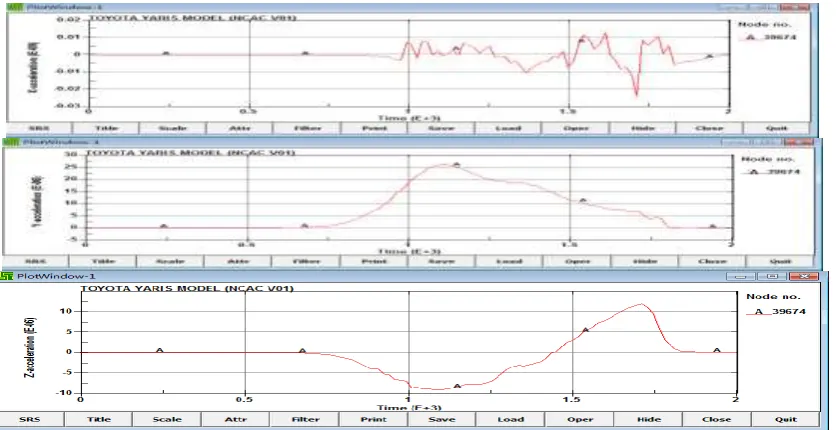
As shown in Fig. 5, 8 test points are distributed on a circle of the same radius, and the distance from the test point to the epicenter is 10cm, 20cm, 30cm, respectively, with a cobweb distribution.
[image:4.595.91.510.544.759.2]Fig. 6 is the simulated acceleration of the X/Y/Z three axes of the selected test points, where the units of the horizontal coordinate are ms and the unit of the vertical coordinate is g.
Optimal Distribution of Test System
[image:5.595.67.529.370.427.2]The data of 24 points in the Fig. 5 is used to obtain the result distribution in Table 1. The circles show the epicenter coordinates of each test point, and the triangles are the coordinates after the integration.
Table 1. Test point coordinates.
Test point 1 2 3 4 5 6 7 8 9 10 11 12 x 0.52 0.49 0.53 0.46 0.48 0.56 0.4 1 0.53 0.57 0.41 0.45 0.62 y 0.47 0.53 0.46 0.51 0.43 0.48 0.49 0.62 0.49 0.58 0.61 0.52 Test point 13 14 15 16 17 18 19 20 21 22 23 24
x 0. 42 0.39 0.55 0.67 0.58 0.55 0.60 0.61 0.32 0.36 0.64 0.33 y 0.47 0.54 0.58 0.52 0.54 0.4 0.56 0.55 0.45 0.50 0.4 0 0.55
The distance between the test point and the center of explosion and the way around the test point will affect the experimental data. In the actual test, there may be a deviation between the installation center of the device and the actual explosion center. As a result, only some of the data obtained in the distributed test system are available. In order to obtain a realistic distribution of points, four groups of observation points are defined: the first group (1-8), the second group (9-17), the third group (18-24), the fourth group (1-3), the fifth group (13-15) and the sixth group (19-21). Get the results shown in Table 2.
Table 2. Coordinates for each group.
Group 1 2 3 4 5 6
x 0.52 0.53 0.55 0.53 0.45 0.56 y 0.48 0.47 0.46 0.48 0.53 0.42 Error 0.04 0.06 0.09 0.05 0.08 0.14
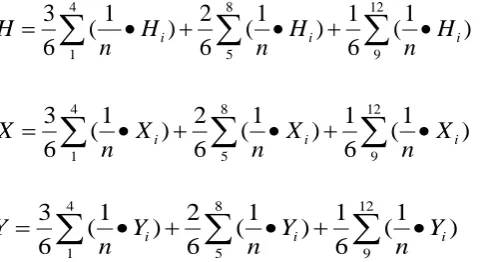
The analysis of one, two and three groups of data shows that the closer to the epicenter, the higher the measurement accuracy. According to the analysis of one and four groups, two and five groups, three and six groups, when the distance from the epicenter is the same, the error of surround distribution is smaller than that of the same quadrant. In this paper, the weighted idea is used to integrate the data, that is, the more close to the epicenter, the larger the proportion of the test points. The data are integrated and analyzed by using the Eq. 12-14.
12
9 8
5 4
1
) 1 ( 6 1 ) 1 ( 6 2 ) 1 ( 6 3
i i
i H
n H
n H
n H
(12)
12
9 8
5 4
1
) 1 ( 6 1 ) 1 ( 6 2 ) 1 ( 6 3
i i
i X
n X
n X
n X
(13)
12
9 8
5 4
1
) 1 ( 6 1 ) 1 ( 6 2 ) 1 ( 6 3
i i
i Y
n Y
n Y
n Y
(14)
Where H is the depth and XY is the vertical coordinate of the epicenter (After determining the
azimuth and epicentral distance will be known). Hi,Xi,Yi is the parameter measured by a single
[image:5.595.77.323.536.667.2]Conclusion
The illegal exploitation of coal mining has a series of grievous effects. The positioning of underground blasting was analyzed by applying the method of earthquake positioning in this paper. Based on the simulation of the blasting on the virtual platform of LS-DYNA, the optimal method of distributing test points that Multi-point surround with different distances was obtained by comparing different patterns of placement. The points are arranged at different distances from the epicenter, and the points at the same distance are distributed in a circumferential shape. The minimum error of the statistical data obtained is compared with the real data. This conclusion is applicable for monitoring the unlawful coal mining exploitation and can help to prevent the negative influence of illegal coal mining process.
Acknowledgement
The paper is sponsored by the Fund of Underground Target Damage Technology Laboratory.
References
[1]Meng Xiuzhi. Research and Application of Real-time Monitoring and Positioning Systems for Underground Blasting Source. Bingjing: China Mining University, 2014.
[2]Zhao Huabin. The research of blasting center positioning method and the design of distributed test system. Taiyuan: North University of China, 2017.
[3]Shan Bin, Xiong Xiong, Zheng Yong, Jin Bikai, Liu Chengli, Xie Zhujun, Hsu HouTze. Stress changes on major faults caused by 2013 Lushan earthquake and its relationship with 2008 Wenchuan earthquake. Science China (Earth Sciences), 2013, 07:1169-1176.
[4]Liu Xiqiang. Research on Real-time Evolutionary Earthquake Epicentral Location. Northwestern Seismological Journal, 2012, 34(04):342-349.
[5]Liu Xiqiang, Zhou Yanwen, Qu Junhao, Shi Yuyan, Li Bo. Real-time detection of regional events and automatic P-phase identification from the vertical component of a single station record. Acta Seismologica Sinica, 2009,31(3): 260--271.
[6]Luo Yan, Progress on the determination of focal depth. Progress in Geophys. 2013, 28(5):2309-2321.
[7]Zhou Shuang-tao. Numerical Simulation of Soil in Explosive Consolidation with ANSYS/LS-DYNA. Journal of Military Transportation University, 2016, 18(10):82-86.
[8]Jing Yi. Safety Analysis of Anti-explosive and Anti-impacted Airtight Wall Based on ANSYS Numerical Simulation. Safe in coal mines, 2017,48(11):194-197.