A Neuro-Fuzzy System for Modeling the Depression Data
Anish Dasari
Student, Mechanical Engineering, NIT Durgapur NIT Durgapur, West Bengal,713209 India
Nirmal Baran Hui
Associate Professor, Mechanical Engineering, NITDurgapur
NIT Durgapur, West Bengal, 713209 India
Subhagata Chattopadhyay
Principal, Bankura UnnayaniInstitute of Engineering BUIE, Bankura, West Bengal,
722146, West Bengal India
ABSTRACT
Depression is a psychological disorder, which, if untreated, may deteriorate the quality of one’s life. Therefore, to tackle it, its early screening and accurate grading are much needed. The success of soft computing largely stands on its effective ways of handling uncertainty, which is often encountered in a clinical diagnosis. This paper proposes application of soft computing techniques to automate depression diagnosis. In order to achieve our goal, an intelligent Neuro-Fuzzy model has been developed. It has been trained with a sample of real-world depression data. Experiments with test data reveal that the Mean Squared Error in prediction is nominal for most of the cases. Such a system could assist the doctors to take decisions in much needed situations.
General Terms
Mental Health Informatics, Depression Data, Neuro-Fuzzy, Modeling.
Keywords
Mental Health Informatics, Depression Data, Neuro-Fuzzy, Modeling.
1.
INTRODUCTION
Health informatics (HI) is an interdisciplinary domain, which attempts to merge ‘Healthcare’ and ‘Technology’, effectively. In addition to e-Health (i.e., applications of Information Communication Technology in healthcare delivery [1]) and genomic research (applications of bioinformatics for disease diagnosis and control [2]), one developing domain of HI is the application of intelligent algorithms in the clinical decision making, popularly known as ‘Artificial Intelligence in Medicine’ (AIM) [3]. Studies have revealed that intelligent algorithms are better suited in clinical medicine than traditional methods due to its ability to (i) handle uncertainty and (ii) gain maturity with time [4]. Thus, AIM research is mostly application-based in nature to examine the efficacies of these algorithms on clinical data, for example symptoms and signs [5]. Its key focus is to handle (i.e., capture, quantify, analyze, and model) subjective clinical symptoms for decision making, such as screening, diagnosis, and prognostic determination [6].
Psychiatry is a special domain in Health Sciences that deals with organic brain disorders due to various causes [7]. Psychiatric diseases or mental illnesses present with subjective symptoms, which cannot be measured directly. Major depression is a common psychiatric illness [8]. According to World Health Organization (WHO), 30% of global population is suffering from detectable depression and of course, this is the tip of the iceberg, and the real number might be very high [9]. There are several reasons which continuously contribute to maintain the sizable depression
pool of population, such as (i) unpredictable onset [10], (ii) silent progression [11], (iii) widespread social stigma [12], and (iv) perception differences among doctors, which often leads to ‘under’ or ‘over’ diagnoses [13]. Therefore, early screening and diagnosis is required in reducing the disease load [14].
Application of Soft Computing (SC) techniques in depression-screening and predicting the respective severity yields a huge research challenge, especially in the construction of the proposed models and their interpretations. Over the last two decades, researchers attempted to handle much subjective psychiatry data with SC techniques. Concepts of Fuzzy-C Means (FCM) and K-means (KM) clustering techniques were used for classifying depression grades using Beck’s Depression Inventory-II (BDI-II) [15]. In another study, Brief Psychiatric Rating Scale-F2 (BPRS-F2) had been used to capture the symptoms of seven look-alike psychiatric diseases and depression was one of them [16]. Neural Networks (NNs) had been tried to grade depression into ‘mild’, ‘moderate’, and ‘severe’ [17]. In another study, Radial Basis Function Net (RBFN) had been used to predict suicidal risks associated with depression in Taiwanese soldiers [18]. Feed-forward back propagation neural net with adaptive approach to handle the symptom loads of adult depression have also been tried [19]. To best handle the symptomatic variations in depression, neuro-fuzzy modeling has been performed using various membership function distributions during the fuzzification phase, where the membership functions are basically intended to accommodate the range and the overlapping among the grades, e.g., mild-moderate-severe [20]. Apart from soft computation, depression grading has also been tried with simple linear regressions with an appreciable success [21]. Traditional decision tree induction followed by fuzzy modeling has also been tried to handle similar type of complex illness, where based on the entropy values significant symptoms are identified and then used for the fuzzy modeling [22]. However, it is important to note that the number of researches using SC in psychiatry does not score much. This is the key motivation behind this contribution.
2.
METHODOLOGY
In this section, we have discussed the Data Collection and Neuro-Fuzzy Model Construction, as follows.
2.1
Data Collection
excluded as those require urgent treatment. Seven common symptoms, namely Feeling Sad (FS), Loss of Pleasure (LP), Weight Loss (WL), Insomnia (IN), Hypersomnia (H), Loss of appetite (LA) and Psychomotor Agitation (PA) were considered for this work after consulting with three senior psychiatrists (mean experience of 10.4 yrs.). The grade of each symptom and the corresponding probability of depression were unanimously assigned [0, 1] by them.
2.2
Neuro-Fuzzy Model Construction
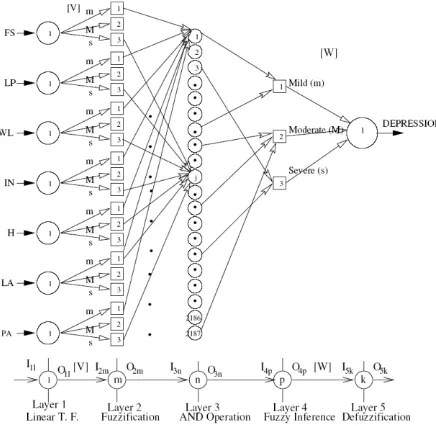
[image:2.595.57.275.232.445.2]An attempt has been made by the second author to model Mamdani Approach [23] of FLC using the structure of a feed-forward NN [24]. The schematic diagram of a Neuro-Fuzzy System (NFS) is shown in Fig. 1.
Fig. 1. The proposed Neuro-Fuzzy model.
It consists of five layers, namely ‘Layer 1’ (input layer), ‘Layer 2’ (fuzzification layer), ‘Layer 3’ (AND operation implementing layer), ‘Layer 4’ (fuzzy inference layer), and ‘Layer 5’ (defuzzification layer). There are seven neurons in the first layer corresponding to seven different symptoms as the input variables of the FLC. In the second layer, corresponding to the all the seven inputs, there exist three different neurons separately, which represent three different grades of the inputs, namely mild (m), moderate (M) and severe (s). It is important to mention that in all these seven cases, the weights [V] of the second layer are taken equal to the half base-width of the fuzzy membership function distributions. Since there are 2187 possible rules for these seven input variables, 2187 different neurons are considered in the Layer 3. Every neuron, in this layer, represents a corresponding fuzzy rule. In the fourth layer, three neurons are considered for indicating three different grades (i.e., ‘m’, ‘M’, and‘s’) of the depression output. The connectivity between a neuron lying in the third layer and a neuron lying in the fourth layer represents the output of a particular rule. In the last layer, there exists only one neuron representing the depression output. The weights between the fourth and fifth layers, i.e., [W] are also taken to be equal to the half base-width of the membership function distributions of the output. The formulation of the developed neuro-fuzzy system is explained layer-by-layer as shown in Fig. 1. The following notations are used in this system: Iij and Oij represent the input
and output, respectively of the jth neuron lying in ith layer, ij
indicates membership function value of the jth neuron lying in the ith layer. Let us assume that lth, mth, nth, pth and kth neurons
are lying in the first, second, third, fourth and fifth layers, respectively, of the network.
2.3
Layer 1 (Input Layer)
Seven symptoms of depression are fed as inputs to the network. The nodal output will be the same as the input, as a linear transfer function has been considered in this layer.
2.4
Layer 2 (Fuzzification Layer)
The inputs of this layer are taken to be equal to the outputs of the first layer. Thereafter, these crisp values of the inputs are converted into the fuzzy membership function values, with the help of membership function distributions. For all the inputs, the membership function distributions are taken to be triangular, for simplicity. I2m and O2m denote the input and
output, respectively of the mth neuron lying in the 2nd layer. S2m indicates the starting point of the crisp value
corresponding to a membership function distribution of mth
neuron lying in the 2nd layer, vlm represents the link weight
between lth neuron of 1st layer and mth neuron of the 2nd layer.
The following assumptions are made to simplify the analysis:
)
(
3
1
3 2 1
,avg i i i
i
v
v
v
v
And
avg i i
i
i
v
v
v
v
1
2
3
,2.5
Layer 3
This layer performs the task of logical AND operation. Each neuron lying in this layer is connected to seven neurons of the previous layer (see Fig.1). Membership function values calculated in the previous layer are considered as the inputs of a particular neuron (say nth) lying in this layer. These seven membership function values are compared and the minimum of these is taken as the output of that nth neuron.
2.6
Layer 4
This layer is the fuzzy inference layer, which identifies the fired rules through logical OR operation corresponding to the set of input variables.
2.7
Layer 5
The connecting weights between the 4th and 5th layers indicate the membership function distributions of the output variables. Once the membership function distributions are known, this layer calculates the output of all the fired rules (in terms of area of membership function distributions). After the outputs of all the fired rules have been determined, they are superimposed to get the fuzzified output. As the fuzzified output is not suitable for implementation as a control action, a crisp value corresponding to this fuzzified output is calculated. This process is known as de-fuzzification. The final output O5k of the kth neuron lying in thislayer can be
expressed as follows.
fk k f
k
k k k
A
M
A
O
1 1
Where, Ak and Mk are the area and center of area, respectively
for kth fired rule and
f
is the total number of fired rules. Thus, in the present work, an FLC has been developed based on Mamdani’s Approach [23].Let us suppose that a batch mode of training has been adopted to optimize the performance of the controller. It can be implemented using a Back-Propagation (BP) algorithm, as explained below.
2.8
Tuning of the Neuro-Fuzzy System
Using a Back Propagation Algorithm
Let us assume that the Rule Base (RB) of the FLC has been kept unaltered during its training. Let us also suppose that the Data Base (DB) (that is, membership function distributions of the variables) of the FLC has been optimized during its training. It is to be noted that the DB of the FLC can be represented using the connecting weights of the Neural Network, that is, [V] and [W]. A BP algorithm can be utilized to update these weight values.
Let us consider C training scenarios and Mean Squared Deviation (MSD) in prediction can be calculated as follows:
21 51 51
2
1
C c c cO
T
C
E
(2)where, T51c and O51c represent the target and calculated
outputs, respectively, of the output neuron of the network, corresponding to cth training scenario.
The updated value of connecting weight wpk can be
determined as
pk previous
pk updated
pk
w
w
w
,
,
(3)where the change in wpk can be calculated as follows:
pk pk
w
E
w
(4)where η indicates the learning rate. For simplicity, the momentum term α has been neglected in the above expression. Now, pk
w
E
can be determined like the following:
pk c c pk
w
I
I
O
O
E
E
E
w
E
51 51 51 51 (5)Therefore, the updated value of w51 can be determined.
Similarly, the connecting weight vlm can be updated according
to the rule given below.
lm previous
lm updated
lm
v
v
v
,
,
(6)Where, the change in vlm can be obtained as follows:
lm lm
v
E
v
(7). Now, lmv
E
can be calculated like the following:
lm m m m m n n n n p p p p c c lm v I I O O I I O O I I O O I I O O E E E v E 2 2 2 2 3 3 3 3 4 4 4 4 51 51 51 51 (8)
Therefore, the updated value of vlm can be calculated.
3.
RESULTS AND DISCUSSIONS
In the developed neuro-fuzzy approach, the FLC is trained off-line with the help of a BPNN. For tuning of the FLC, a set
of 78 training data (responses of the 78 different doctors for different input conditions) is considered. There are seven inputs and one output of the system. Therefore, both training as well as test data consists of variation of depression output corresponding to the different values of seven inputs, namely Feeling Sad (I1), Loss of Pleasure (I2), Weight Loss (I3),
Insomnia (I4), Hypersomnia (I5), Loss of appetite (I6) and
Psychomotor Agitation (I7). With all such training data, the
amount of corrections necessary in the weight values is calculated. It is to be noted that a batch mode of training has been adopted in this paper. After the tuning of the FLC is over, the performance of the FLC is compared for a set of 10 test scenarios. During optimization / training, weights (vi,avg
for i= 1 to 7) for the input as well as output (w1,avg) variables
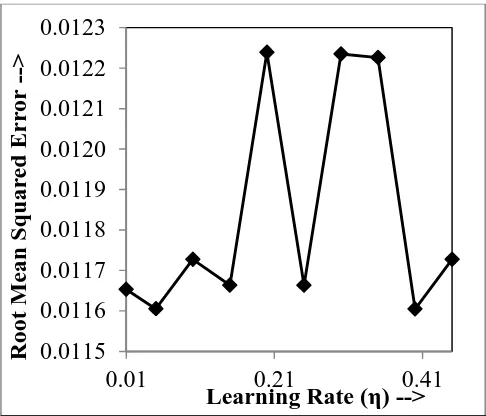
[image:3.595.315.558.349.557.2]are varied in a range of (0.1 to 0.45). Performance of the back-propagation algorithm largely depends on the learning rate (η) value. Therefore, an attempt has also been made to get a value of learning rate (η), for which the value of Mean Squared Error (MSE) (see equation 5) becomes minimum. This study has been carried out systematically varying η in a range of (0.01 to 0.5). Large values of η have been neglected as it excessively reduces the saturation time. Fig. 2 shows the variation of η with MSE. It has been observed that with η = 0.05, MSD becomes minimum. It is important to mention that maximum number of iterations was restricted to 15 during this study.
Fig. 2: Selection of optimal η (Error vs. learning rate).
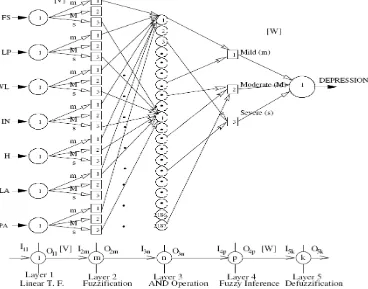
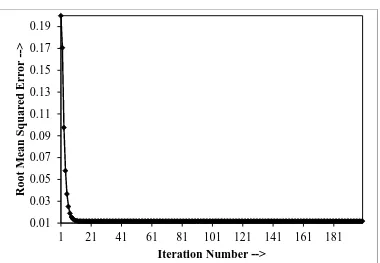
For further optimization with η = 0.05, the same program is run for 200 number of epochs and it has been noted that MSE saturates with a value of 0.0116043 after 30-th iteration (refer to Fig. 3). It is important to mention that the Rule Base (RB) of the FLC was not optimized in the present case, only Data Base (DB) optimization was considered. After tuning, best result was obtained with the following weight values: (v1, avg =
0.4161; v2, avg = 0.4469; v3, avg = 0.4507; v4, avg = 0.4469; v5, avg
= 0.4405; v6, avg = 0.4232; v7, avg = 0.4357 and w1, avg =
0.3425). These weights were used to predict the degree of depression for ten different test cases collected through the responses of ten different doctors.
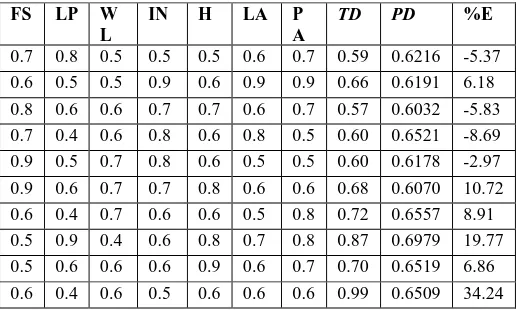
Table 1 shows the result corresponding to the test cases. After comparing the predicted depression (output of the Neuro-Fuzzy System) with that of the Target depression
0.0115
0.0116
0.0117
0.0118
0.0119
0.0120
0.0121
0.0122
0.0123
0.01
0.21
0.41
Root
M
ean
S
q
u
ar
ed
E
rr
or
-->
(responses of the doctors), it has been observed that the percentage error is very nominal leaving the tenth case. Low percentage error ensures that the developed NFS is suitable for the present problem. Little deviation can happen either due to the improper optimization of the NFS or because of the data generated from the little experienced doctor. However, the main advantage of the present NFS is that it can give an approximate idea to the doctors about their diagnosis.
Fig. 3: Error vs. Iteration Number with optimal η = 0.1.
Table 1: Predicted Depression vs. Target Depression.
FS LP W
L
IN H LA P
A
TD PD %E
0.7 0.8 0.5 0.5 0.5 0.6 0.7 0.59 0.6216 -5.37 0.6 0.5 0.5 0.9 0.6 0.9 0.9 0.66 0.6191 6.18 0.8 0.6 0.6 0.7 0.7 0.6 0.7 0.57 0.6032 -5.83 0.7 0.4 0.6 0.8 0.6 0.8 0.5 0.60 0.6521 -8.69 0.9 0.5 0.7 0.8 0.6 0.5 0.5 0.60 0.6178 -2.97 0.9 0.6 0.7 0.7 0.8 0.6 0.6 0.68 0.6070 10.72 0.6 0.4 0.7 0.6 0.6 0.5 0.8 0.72 0.6557 8.91 0.5 0.9 0.4 0.6 0.8 0.7 0.8 0.87 0.6979 19.77 0.5 0.6 0.6 0.6 0.9 0.6 0.7 0.70 0.6519 6.86 0.6 0.4 0.6 0.5 0.6 0.6 0.6 0.99 0.6509 34.24
4.
CONCLUSIONS AND FUTURE
WORK
Mental health is still neglected globally due to the prevailing social taboo. Also, the number of psychiatrists is much less compared to the number of patients. Given this scenario, an automatic tool could be useful to handle these issues, especially in the rural and remote sectors, where general physicians have to handle psychiatric diseases. Using this automatic tool, they can screen and grade possible cases of depression and take appropriate referral decisions and reduce unnecessary referrals, which may cost huge time and money [25]. It could be a genuine contribution in the field of Mental Health Informatics, if studies with larger sample, standardization, and handling issues of user adoption are appropriately considered.
In this paper, we have optimized the database. We are now working for the optimization of rule base of the controller,
which would make the tool more flexible and faster in clinical decision making.
5.
ACKNOWLEDGMENTS
The authors gratefully acknowledge the assistance and support of psychiatrist colleagues in collecting the quantified data, developing the controller, and interpretation of the results.
6. REFERENCES
[1] J.H Li, L. Land, P. Ray and S. Chattopadhyay, “E-Health readiness framework from electronic health records perspective”, IJIEM, vol. 6, pp. 326-348, 2010.
[2] S. D. Shapiro, “Merging personalized medicine and biology of aging in chronic obstructive pulmonary disease” Am J Respir. Crit. Care Med, vol. 184, pp. 864-866. 2011.
[3] J.M. Tenório, A.D. Hummel, F.M. Cohrs, V.L. Sdepanian, I.T. Pisa, and H. de-F. Marin, “Artificial intelligence techniques applied to the development of a decision-support system for diagnosing celiac disease”, IJMI, vol. 80, pp. 793-802, 2011
[4] Y. Wang, H. Yan, R. Guo, F. LI, C. Xia, J. Yan, Z. Xu, G. Liu and J. Xu, “Study on intelligent syndrome differentiations in traditional Chinese medicine based on multiple information fusion methods”, IJDMB, vol. 5, pp. 369-382, 2011.
[5] S. Chattopadhyay, D.K. Pratihar, S.C. DeSarkar, “Fuzzy logic-based screening and prediction of adult psychoses: a novel approach”, IEEE Trans. Syst. Man Cybernetics Part-A, vol.39, pp. 381-387, 2009.
[6] S. Chattopadhyay, D.K. Pratihar, “Towards developing intelligent autonomous systems in psychiatry: its present state and future possibilities”, Intelligent Autonomous Systems Studies in Computational Intelligence, vol. 275, pp. 143-166, Springer 2010.
[7] A. Carson, “The human illnesses: neuropsychiatric disorders and the nature of human brain”, BJPsych., vol. 200, p. 85, 2012.
[8] A. Bramesfeld, T. Grobe, F.W. Schwartz, “Prevalence of depression diagnosis and prescription of antidepressants in East and West Germany: an analysis of health insurance data”, Social Psychiatry and Psychiatric Epidemiology, vol. 45, pp. 329-335, 2010. [last accessed on 08/03/2012]
[9] WHO: Mental Health and Substance Abuse. URL: http://www.searo.who.int/en/Section1174/Section1199/S ection1567/Section1826_8101.htm [last accessed on 08/03/2012]
[10]O. J. Robinson, C. Overstreet, A. Letkiewicz, and C. Grillon, “Depressed mood enhances anxiety to unpredictable threat”, Psychological Medicine, pp. 1-11, (online first) DOI: 10.1017/S0033291711002583, 2011.
[11]L. Eloul, A. Ambusaidi, and S. Al-Adwai, “Silent epidemic of depression in women in the Middle East and North Africa region,”, Sultan Qaboos Univ. Med J, vol. 9, pp. 5-15, 2009.
[12]A.K. Surbey, “Adaptive significance of low levels cooperation in depression”, Evolution and Human Behavior, vol. 32, pp. 29-40, 2011.
0.01
0.06
0.11
0.16
1 21 41 61 81101121141161181
Root
M
ean
S
q
u
ar
ed
E
rr
or
-->
[image:4.595.38.298.404.559.2][13]S. Titmarsh and I. Goodyer, “Psychiatric diagnosis needs a more scientific approach”, Progress in Neurology and Psychiatry, vol. 15, pp. 21-22, 2011.
[14]B.M. Kwan, S. Dimidjian, and S.L. Rizvi, “Treatment preference, engagement, and clinical improvement in pharmacotherapy versus psychotherapy for depression”, Behaviour Research and Therapy, vol. 48, pp. 799-804, 2010.
[15]S-C.Yu and U. H. Lin "Applications of fuzzy theory on health care: an example of depression disorder classification based on FCM," WSES Transactions of Information Science and Applications, vol. 5, pp. 31-36, 2008.
[16]S. Chattopadhyay, D. K. Pratihar, and S. C. De Sarkar "Some studies on fuzzy clustering of psychoses data," International Journal of Business Intelligence and Data mining, vol. 2, pp. 143-159, 2007.
[17] S. Chattopadhyay P. Kaur, F. Rabhi, and U. R. Acharya "Neural Network Approaches to Grade Adult Depression ," Journal of Medical Systems , vol. 36, issue 5, pp. 2803-2815, 2011.
[18]Y-M Tai, and H-W Chiu "Artificial Neural Network Analysis on Suicide and Self-Harm History of Taiwanese Soldiers," in Second International Conference on Innovative Computing, Information and Control, 2007 (ICICIC'07) pp. 363 – 363, 2007.
[19] Chattopadhyay S., –“Neurofuzzy Models to Automate
the Grading of Old-age Depression”. Expert Systems: the
Journal of Knowledge Engineering (2012); (in press).
[20] Chattopadhyay S., – “A Prototype Depression Screening Tool for Rural Healthcare: A Step towards e-Health
Informatics”, Journal of Medical Imaging and Health
Informatics (2012),in press
[21] Chattopadhyay S., Banerjee S., Rabhi F.A, Acharya R.
U. – “A Case-based Reasoning System for Complex
Medical Diagnoses”. Expert Systems: the Journal of
Knowledge Engineering (2012); DOI: 10.1111/j.1468-0394.2012.00618.x (in press).
[22] Chattopadhyay S., Acharya U. R. "A Novel
Mathematical Approach to Diagnose Premenstrual
Syndrome", Journal of Medical Systems(2012); 36(4):
2177-2186.
[23]E. H. Mamdani, and S. Assilian, “An experiment in linguistic synthesis with a fuzzy logic controller”, International Journal of Man-Machine Studies, vol. 7, pp. 1-13, 1975.
[24]N. B. Hui, V. Mahendar, and D. K. Pratihar, “Time-optimal collision-free navigation of a car-like robot using a neuro-fuzzy approach”, Fuzzy Sets & Systems, vol. 157, pp. 2171-2204, 2006.
[image:5.595.113.481.444.733.2][25]F. Smit, H. van Hout, P. van Oppen, H. van der Horst, A. and Beekman, H. van Marwijk, “Cost-effectiveness of a stepped care intervention to prevent depression and anxiety in late life: randomized trail”, BJPsych, vol. 196, pp. 319-325, 2010.
Fig. 2: Selection of optimal η (Error vs. learning rate).
Fig. 3: Error vs. Iteration Number with optimal η = 0.1.