2017 2nd International Conference on Computer Science and Technology (CST 2017) ISBN: 978-1-60595-461-5
The Color Model of Rice Leaf Based on SVM
and BP Neural Network
Yu-ting SUN
1,a, Hong-yun YANG
2,3,b,*,Ying-long WANG
1,3,
Qiong ZHOU
1, Wen-ji YANG
2,3, and Cang-hai WU
21 School of Computer and Information Engineering, Jiangxi Agricultural University, Nanchang Jiangxi 330045, China
2School of Software, Jiangxi Agricultural University, Nanchang Jiangxi 330045, China
3Key Laboratory of Agricultural Information Technology of Colleges and Universities in Jiangxi Province, Nanchang Jiangxi 330045, China
a[email protected], b[email protected]
*Corresponding author
Keywords: Rice, SVM, BP neural network, RGB.
Abstract: In order to construct a color model of rice leaf based on physiology and ecology, a modeling method based on SVM and BP neural network was proposed for the relationship between the chlorophyll, carotenoid of rice leaf and its RGB value. The chlorophyll a, chlorophyll b and carotenoid were used as model input parameters, the R, G and B values of the rice leaf image were used as the model output parameters respectively and the corresponding RGB component values of leaf image were predicted by using SVM and BP neural network. The results show that the prediction accuracy of BP neural network is significantly higher than that of SVM. The research can meet the needs of agriculture research and provide a theoretical basis for rice leaf color simulation modeling. It also provides a theoretical basis for the digitization and visualization of plant growth. The research method has good universality and generalization.
Introduction
BP neural network. WANG, et al [6], proposed a method of cotton moisture detection based on BP neural network. SUN, et al [7], used SVM to predict leaf nitrogen content in rice by collecting rice canopy spectral reflectance. YU,et al [8],proposed a recognition method of wheat leaf disease based on SVM.
In summary, BP neural network and SVM are widely applied in the agricultural field. However, the simulation of plant leaf color focused on statistical regression analysis. Recently, it has not been reported that the model based on the relationship between the content of chlorophyll, carotenoid and the color value of the image can be constructed by machine learning. In this paper, the relationships of them were analyzed by data obtained from rice cultivation test. And the color model of rice leaf based on SVM and BP neural network was constructed. It provides a theoretical basis for the study of virtual rice growth system based on physiological and ecological characteristics. In the shortening of the research cycle of the premise, the quantitative test results and virtual experience of the sensory perception are obtained by the complex and long cycle of life science research under the control of quantitative spatial and temporal coordinates. And also provides a new idea for plant leaf color modeling.
Materials and Methods Test Scheme
Rice variety Jinyou 458 which was widely popularized in Jiangxi Province was planted in the agronomic experiment station of Jiangxi Agricultural University. The experiment was carried out from April to July in 2015. The contents of experiment were chlorophyll a, chlorophyll b, and carotenoid and RGB values.
Data Collection
Rice was tested in vitro and the test content were chlorophyll a, chlorophyll b, carotenoid (spectrophotometer) and the RGB value of leaf digital image of rice leaf (Epson V300 flatbed scanner scan). The absorbance of rice leaf pigment extraction with maximum absorption wavelength was determined by spectrophotometer, carotenoid was 449nm. However, the chlorophyll a and chlorophyll b had two maximum absorption, 645nm and 663nm respectively. Therefore, the absorbance of the extraction wavelengths of 645nm and 663nm was measured; the content of chlorophyll a was calculated by subtracting the absorbance at 663 nm and 645 nm of chlorophyll b. A digital image was obtained by scanning rice leaf with an Epson V300 flatbed scanner. After processing, the mean values of R, G and B corresponding to the three position images were obtained.
BP Neural Network
Figure 1.Topology diagram of BP neural network.
BP neural network must first train the network and then predict, the training process is as follows.
1) Initializing the network, initializing the threshold of the hidden layer and the link weights between the neurons of each layer, giving the learning rate and iteration times, we can get the output value of the hidden layer.
. ,..., 2 , 1 ) ( 1 l j a x w f H n i j i ij
j=
− ==
(1)
Hj is the output value of the hidden layer, wij is the link weights of the hidden layer,
xi is the input variable, aj is the threshold value of hidden layer, l is the number of neurons in the hidden layer, f is the activation function of hidden layer, and the
function used in this paper is as follow.
. 1 1 ) ( x e x f − + = (2) f(x) is logsig.
2) Then, we can calculate the value of the output layer . ,..., 2 , 1 1 m k b w H
O jk k
l
j j
k =
− ==
(3)
O is the value of the output layer , wjk is the link weights of output layer, bk is the threshold value of output layer, m is the number of neurons in the output layer.
The error is calculated by the expected output value and the predicted output value of network. If the error is less than error performance target, the learning is finished and the optimal threshold value and weight are obtained. Otherwise, the error signal is propagated in the opposite direction, and the link weights and threshold values of the layers are adjusted according to the error until the error is less than the error performance target or the algorithm iterates reach the maximum value.
Figure 2. Leaf Pigment and RGB Topological Structure.
In Fig. 2, X1, X2, and X3 are chlorophyll a, chlorophyll b and carotenoid,
respectively, and Y is R / G / B value.
SVM
Support vector machine (SVM) contains three ideas: the concept of optimal hyperplane, soft space, and kernel function [10]. SVM is a machine learning method based on small sample. It successfully solves the problem of learning on small samples, and obtains the global optimal solution under the condition of small samples. Applying the technique of kernel function, the low-dimensional space is mapped to the high-dimensional feature space by non-linear transformation, which avoids the problem of dimensional disaster. However, when the sample size is large, the convergence rate is slow and the efficiency is low.SVM topology is shown in Fig. 3.
Figure 3. Topology diagram of SVM.
Results and Analysis
To eliminate the influence of different dimensions on the results,520 sets of data obtained in the experiment are normalized. The first 480 sets of data are the training sample sets and the last 40 sets of data are the test sample sets. SVM and BP neural network models are constructed.
For SVM, the type and the parameters of kernel function are related to its performance. This paper adopted the RBF kernel function and the grid search algorithm. The algorithm is used to optimize the coefficient C in the regression model and the coefficient g in the kernel function. The cross-validation method is used to obtain the global optimal solution. Finally, the optimal R model, G model and B model of the regression model are selected.
[image:4.612.234.405.416.523.2]which respectively represent the chlorophyll a, chlorophyll b and carotenoid of rice leaf. The number of neurons in the output layer is 1, which respectively represent the R value, G value and B value of rice leaf color image in the three models. According to the empirical formula mentioned in the relevant literature, the number of neurons in the hidden layer is 5.The transfer functions of hidden layer is logsig and output layer
is purelin, BP training function is traingdx. The maximum number of iterations is 10000,
the learning rate is 0.1, and the error performance target is 0.00004.
The predicted values of the test samples obtained by SVM and BP neural network
value are shown in Fig.4.
[image:5.612.132.490.196.303.2](a) (b) (c) Figure 4. Comparison of actual and predicted values. (a) R value; (b) G value; (c) B value.
The predicted values obtained by SVM and BP neural network are compared with the actual values, and the error figures are shown in Fig.5.
[image:5.612.132.493.358.471.2](a) (b) (c)
Figure 5. Absolute error of data. (a)R model; (b)B model; (c)G model.
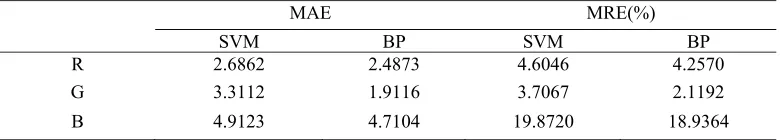
From Fig.4 and Fig.5, as for the R value and G value, the prediction of SVM model and BP neural network model is good. However, neither SVM nor BP neural network prediction on B value is effective. In order to more intuitively compare the advantages and disadvantages of the two models, the average absolute error (MAE) and mean relative error (MRE) between the real value and predicted value of R, G and B value are calculated respectively. The comparison table is shown in Table 1.
Table 1. Comparison of analysis on error.
MAE MRE(%)
SVM BP SVM BP
R 2.6862 2.4873 4.6046 4.2570
G 3.3112 1.9116 3.7067 2.1192
B 4.9123 4.7104 19.8720 18.9364
[image:5.612.112.502.588.658.2]1.3996 and 0.2019 respectively, and MRE is increased by 0.3476%, 1.5875% and 0.9356%, respectively.
In summary, the model based on BP neural network can better predict the R, G and B value of rice leaf color image. It has good prediction accuracy.
Conclusions
Rice leaf color is an important indicator reflecting the growth status of rice. It is also an important organ for virtual rice visualization. The relationship between chlorophyll a, chlorophyll b, the caroteneoid and the RGB value of leaf color components of rice leaf was constructed by using SVM and BP neural network, and the RGB value of leaf color was predicted. The results show that both the SVM and the BP neural network model well predict the R and G values in the leaf color image. And the predictive precision of the model constructed by BP neural network is higher than that of SVM. For the B value of the leaf color image, the two models are not good enough to predict and the error is relatively large. The measured range of B value is limited to 25 ~ 38, the computer simulation of rice leaf color modeling can take its mean (about 33) and the change of rice leaf color was mainly determined by its R value and G value. In future research, other machine learning methods can be used to predict the B value. And BP neural network algorithm itself also has the limitation, its initial weights and threshold values are random. In the future, genetic algorithm can be used to optimize the initial weights and threshold values of BP neural network in order to achieve better predictions.
Acknowledgements
1.National Natural Science Foundation of China: Study on modeling method of rice growth process based on machine learning (NO: 61562039).
2. National Natural Science Foundation of China: Research and application of gesture interactive technology based on depth information and significant computation (NO: 61462038).
3.National Natural Science Foundation of China: Rice leaf color modeling and simulation based on physiological and ecological (NO: 61363041).
4.Youth Science Foundation of Jiangxi, China: Research on extensible method of variable structure parallel algorithm (NO:20161BAB212047).
References
[1] Gang-meng GONG, Jun YANG, Huo-jiao HE, et al. Chinese Agricultural Science Bulletin, 2015 (24): 19-24. In Chinese.
[2] Jing-bo LIU, Hong-xia ZHAO. Science and Technology of Food Industry, 2003 (S1): 62-66. In Chinese.
[3] Riccardi, M., Mele, G., Pulvento, C., et al. Photosynthesis Research, 2014, 120(3):263-72.
[4] Ming-xia HE, Su-juan ZHANG, Jin-cai LI, et al. Journal of Tianjin University, 2010, 43 (5): 464-468. In Chinese.
[6] Wei WANG, Wang-yuan ZONG, Wen-fu WU, et al. Journal of Huazhong Agricultural University, 2010, 29 (4): 533-536. In Chinese.
[7] Sun J, Mao H P, Yang Y Q. Journal of Jiangsu University, 2010, 31(1):6-10. [8] Xiu-li YU, Chao XU, Dan-dan WANG, et al. Journal of Agricultural Mechanization Research, 2014 (11): 151-155. In Chinese.
[9] Xiao-chuan WANG. Analysis of 43 cases of MATLAB neural network. Beihang University Press, 2013: 1-10. In Chinese.
[10] Yan-ping ZHANG, Ling ZHANG, et al. Machine learning theory and algorithm. Beijing: Science Press, 2012: 27-51. In Chinese.
[11] Yong-feng LIU, Run-xiang LI, Chun-bin LI, et al. Journal of Arid Land Resources and Environment, 2014, 28 (5): 158-165. In Chinese.
[12] Yu-qing ZHOU, Meng-zhi QIN, Zhi-hong MA. Journal of Tianjin Agricultural University, 2016, 23 (2): 49-52. In Chinese.
[13] Dong LI, Ke-fa ZHOU, Wei-dong SUN, et al. Arid Land Geography, 2015, 38 (1): 128-134. In Chinese.
[14] Tao ZHANG. Study on Hot-air Drying Prediction Model of Ginger Based on BP Neural Network and Support Vector Machine. Inner Mongolia Agricultural University, 2014. In Chinese.
[15]Li D, Liu L, Peng J, et al. Chinese Journal of Rare Metals, 2011, 35(5):759-763. [16] A-li CHAI, Bao-ju LI, Qian WANG, et al. Actacta Horticulturae Sinica, 2009, 36 (1): 45-52. In Chinese.
[17] Guo-qiang YU, Mao-sheng ZHANG, Gen-long WANG, et al. Journal of Hydraulic Engineering, 2012 (s2): 105-110. (in Chinese)
[18] Dong LIANG, Qing-song GUAN, Wen-jiang HUANG, et al. Transactions of Chinese Society of Agricultural Engineering, 2013 (7): 117-123.
[19] Dan GAO, Dao-cai CHI, Tie-liang WANG. Journal of Shenyang Agricultural University, 2005, 36 (5): 599-602. In Chinese.