2018 International Conference on Modeling, Simulation and Optimization (MSO 2018) ISBN: 978-1-60595-542-1
Detection Algorithm of Trapped Personnel Based on
Sound Processing Technology
You-rong CHEN
1,2,*, Si-yi
LU
2, Dong-dong LI
1, Ban-teng LIU
1, Hai-bo YANG
1and Yun-kai ZHU
31College of Information Science and Technology, Zhejiang Shuren University,
Hangzhou, Zhejiang, 310015, China
2School of Information Science & Engineering, Changzhou University, Changzhou,
Jiangshu, 213164, China
3Zhejiang Hangjia Technology Development Co. Ltd, Hangzhou, Zhejiang, 310015, China
*Corresponding author
Keywords: Sound processing technology, Trapped personnel, Life detection, Feature extraction.
Abstract. In the China's major disasters, the equipment which is used to rescue trapped personnel has high cost, needs to carry and has low efficiency. In order to solve the problems, a detection algorithm of trapped personnel based on sound processing technology (DATP) is proposed. In the DATP algorithm, sound signal is collected. The data with large energy is selected. Preprocessing method is used, such as Kalman filter and normalization. FFT transform is used to frequency domain analysis. The data is extracted in the band of 18400-19240 Hz and 20811-22050 Hz. The corresponding similarity is calculated. According to the similarity values, whether there is trapped personnel is determined. The simulation results show that DATP algorithm improves recognition rate and reduces false judgment rate and computation time. In short, in the sound recognition of trapped personnel when major disaster occurs, DATP is better than MFCC algorithm, and is suitable for embedded devices.
Introduction
Nowadays, major disasters such as earthquakes causes a large number of casualties and huge economic losses, and produces a chain reaction. Therefore it is of great importance to rescue timely. At present, life detector is the commonly used equipment [1]. It could detect electric field of ultra-low frequency electromagnetic wave generated by of the human body (heartbeat production) to find position of “living person”. But it is very expensive and mostly imports, and needs rescue workers to bring to the affected areas and has lower rescue efficiency, reduces and delays the best rescue time [2]. So when rescuer workers are unable to enter the disaster areas, a new method of life detection solving problem of trapped personnel is needed.
in different environments by combining OOMP with DBN. Reference [9] extracts mel-frequency cepstral coefficients as features, then uses MFCC feature to train the mixed Gauss model, and uses GMM to classify unknown samples. Reference [10] acquires speech signal, and analyzes how to deal with speech signal.
Although references [3-10] apply sound signal to various application, none of them does not consider the actual situation of major disasters. So a detection algorithm of trapped personnel based on sound processing technology (DATP) is proposed. When rescuer workers are unable to enter the disaster areas in major disaster, unmanned equipment moves and collects sound of trapped personnel automatically. Then it analyzes the possibility of trapped personnel with energy analysis, Kalman filtering, normalization, spectrum analysis, feature extraction and recognition. The DATP algorithm can detect trapped personnel, record their locations, and provide information to rescue workers, thus solves the life detection problem of unmanned equipment, improves search and rescue efficiency, and reduces casualties.
Detection Principle
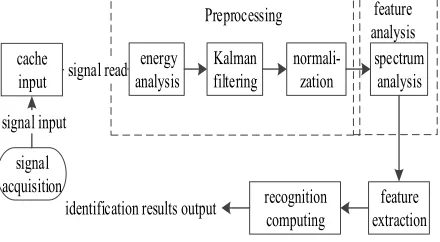
Because DATP algorithm needs to be applied in embedded devices, the complexity of DATP is not too high. As shown in Figure 1, sound acquisition module is used to acquire sound signal. Then, after sound signal preprocessing, feature analysis, feature extract and recognition computing, recognition results output. But the problem which is how to carry out the sound signal preprocessing, feature analysis, feature extract and recognition computing of low complexity still needs to be solved. Specific solutions are as follows.
signal
acquisition feature
extraction recognition
computing cache
input
signal input
identification results output
normali-zation
feature analysis spectrum
analysis signal read energy
analysis
[image:2.612.199.419.356.477.2]Kalman filtering Preprocessing
Figure 1. Principle flow chart.
Sound Signal Acquisition
Sound playback module plays “is there anyone around, please make a sound by hand, stone and iron”. If there is trapped personnel, he makes a sound with the tools around. Sound acquisition module acquires signal of T second sound. And the signal is converted into binary signal and sent to the embedded processor.
Preprocessing of Sound Signal
The processor divides the T second sound signal into M data groups, and uses Kalman filter and the normalization to process each data group.
Energy Analysis. Because the energy of sound signal changes obviously with time, and instantaneous energy of sound signal reacts the change, instantaneous average intensity is defined as energy Emcontained in the short time t. The calculation formula is as follows.
1 2
0
1
( ) L | ( ) |
m a
E t S a
L
. (1)means that the energy is low. The sound mainly is the sound of the environment and has less sound content of trapped personnel. So the sound can be not processed directly, otherwise frequency domain analysis is used.
Kalman Filtering. Kalman filtering process of sound is a kind of data processing technology to remove noise and restore real data. Kalman filtering can estimate the state of dynamic system to remove noise among a series of data with measurement noise when measurement variance has been known. It does not require that the signal and noise are stationary process. Just make some appropriate assumptions to the statistical nature of system perturbation and observation error at each moment, the estimate of true signal with smallest error can be obtained by dealing with the observed signal, and the best sound quality can be obtained.
Normalization. The sample data is x n n( ), 1, 2,...,L .The mean method can be used to normalization. The average value is the trend number of the group data. The value is that the sum of all data in the group divided by the number of data ( )
n
x n L
, where L represents the number of the group data. All group data is subtracted by the average from and is normalized to the average.Feature Analysis
The sound signal is theoretically a dynamic signal composed of different times, different frequencies and different energy amplitude of the sound wave. Only part of the information can be got in the time domain. More information exists in the frequency domain and needs to be analyzed by frequency domain analysis. The Fourier transform is to establish a transformation relationship between signal with time as independent variable and spectral function with frequency as independent variable. So, it forms a variety of different Fourier transform pairs when the independent variable time or frequency are continuous values or discrete values.
Continuous Fourier transform of nonperiodic signalx t( ) results in continuous aperiodic spectral density functionX jw( ). The transform is as follow.
= j
( ) ( ) t
X j x t e dt
. (2)π 1
( ) ( )
2
j t
x t X ed
. (3)Feature Extraction
The FFT transform of large energy data is used, and its spectral characteristics are analyzed. Therefore, frequency distribution of sound signal is analyzed by short time spectrum of sound, and the energy distribution and spectral characteristics of each sound signal in the database are analyzed by three-dimensional sound and spectrum figures. It is found that the frequency domain points of sound signal of trapped personnel is mainly concentrated in some special frequency bands. So the first data selection band are the ranges of 18400-19240 Hz and 20811-22050 Hz. The second data selection band is the range of 20304-22050 Hz. The first V points with highest value is analyzed and the number of points distributed in the two bands are 1
i
N andNi.
Recognition Computing
The similarity values of two bands are calculated.
1
1 100%
i i
N Q
M V
, 2 100%
i i
N Q
M V
. (4) The Q value of two bands are selected, because trapped personnel generates some types of sound. When calculated similarity valueQ1is larger than similarity threshold
1
Th
specified threshold, it is determined as the sound of trapped personnel, and current location information is recorded, otherwise there is no trapped personnel.
Algorithm Implementation
The specific steps of DATP algorithm are as follows.
Step 1: Program initialization. Sound data with T time length is collected; Step 2: M groups of sound data are divided, and m = 1;
Step 3: The m-th group of sound data is selected to determine whether average signal strength is larger than preset signal strength threshold Eth. If so, then go to the step 4, otherwise, m=m+1, go to step 3;
Step 4: Kalman filter is used to filter, remove noise, and normalize the operation;
Step 5: FFT transform of sound data is used to find V points with maximum amplitude and calculate the number of 1
i
N and Ni2 in the two bands.
Step 6: The similarity Q1andQ2 are calculated and judged for both bands. IfQ1is larger than 1
Th
Q , then go to step 7, otherwise there is no trapped personnel around, DATP algorithm ends and program exits.
Step 7: IfQ2is larger thanQTh , there is trapped personnel around, otherwise there is no trapped
personnel around. DATP algorithm ends and program exits.
Time complexity of DATP algorithm is analyzed. Time complexity of DATP algorithm is mainly time complexity of Kalman filtering and time complexity of FFT transform. The time complexity of Kalman filtering is an iterative calculation of L data, where L represents the length of group data and its time complexity is (L). The time complexity of FFT transform is the transformation of L data, that is, its time complexity is (L logL* ).In summary, the time complexity of DATP algorithm is
(L logL* )
.
Analysis of Algorithm Simulation Results
Simulation Parameters
In the experiment, there are six different behaviors such as hand clap hand, hand knocking stone, hand knocking iron, holding stone knocking stone, holding stone knocking iron, and holding iron knocking iron. Each behavior produces 20 sound signals with different rhythm, loudness and other factors. That is, the sound of 120 trapped personnel is simulated. In addition, 100 non-trapped personnel sound, such as are music, sound of natural environment, are selected. The parameters are used as shown in table.1 to determine whether there are trapped personnel.
Table 1. Simulation parameters table.
Parameter Value
Acquisition time T 5s
Number of data group M 215
Signal strength threshold Eth 15
Selection number V of amplitude value 100
Similarity threshold 1 Th
Q 60
Similarity threshold QTh 56
The number L of data per group 512
Simulation Results Analysis
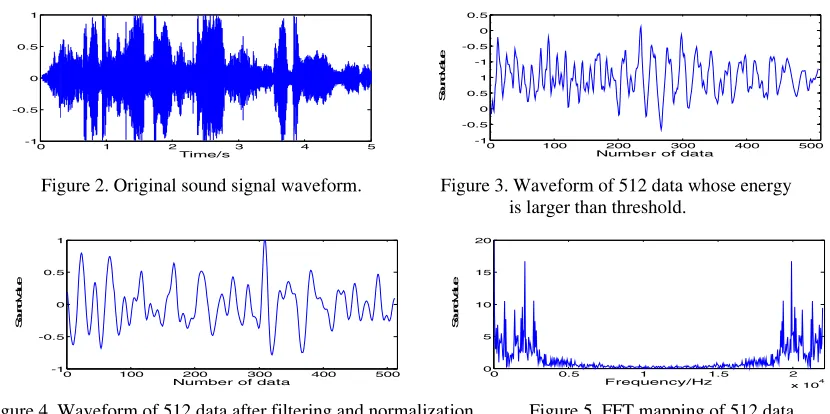
normalized. Figure 4 shows after normalization, filtering and windowing, the glare of sound becomes less, and the gap becomes larger and signal becomes clearer. Figure 5 shows that most energy of data is mainly distributed in both sides symmetrically after FFT transformation. It is found that data are mainly concentrated in the 18400-19240Hz and 20811-22050 Hz. The middle 10828Hz is taken as dividing line. 100 data of maximum amplitude is found and the number of two intervals is calculated. Finally the similarity values and of 5s sound are calculated and whether there are trapped personnel is determined.
0 1 2 3 4 5
-1 -0.5 0 0.5 1 Time/s S ou nd va lu e
-10 100 200 300 400 500
-0.5 0 0.5 1 -1 -0.5 0 0.5
Number of data
S ou nd va lu e
Figure 2. Original sound signal waveform. Figure 3. Waveform of 512 data whose energy is larger than threshold.
0 100 200 300 400 500
-1 -0.5 0 0.5 1
Number of data
S ou nd va lu e
0 0.5 1 1.5 2
x 104
[image:5.612.87.502.163.370.2]0 5 10 15 20 Frequency/Hz S ou nd va lu e
Figure 4. Waveform of 512 data after filtering and normalization. Figure 5. FFT mapping of 512 data.
[image:5.612.140.474.502.646.2]Recognition Result Analysis. MFCC combining with human auditory perception and sound is a feature parameter, which can well response to the human ear perception characteristic. So the common sound recognition method is that MFCC parameter of the sound is extracted and compared with MFCC parameter of samples. When the calculated correlation value is larger than threshold value, sound signal [12] can be recognized. So the sound of 120 trapped personnel and 100 interference sound signal are selected. Then the recognition rate, misjudgment rate and calculation time of MFCC and DATP algorithm are compared. The MFCC algorithm selects 20 sounds from 120 sounds as sample sound and the threshold is 7.9.
Table 2. Recognition test of trapped personnel’s sound.
Algorithm of sound Number
Number of recognition sound Recognition rate % Average calculation time(s)
MFCC 100 72 72 5.046
DATP 120 108 90 3.637
Table 3. Interference sound recognition test.
Algorithm of sound Number Number of misjudged sound
False judgment rate
% Average calculation time(s)
MFCC 100 18 18 4.665
DATP 100 12 12 3.623
algorithm. The DATP algorithm can better identify sound signals of trapped personnel because key features of sound are extracted from trapped personnel. At the same time, to well apply in the embedded devices, the DATP algorithm does not require to compare with sample sound data. Its computational complexity is low so the average computation time is low.
Conclusion
In short, DATP algorithm considers the sound of trapped personnel in major disaster, and effectively recognizes six kinds of behavioral sound of trapped personnel. Compared with MFCC algorithm, DATP algorithm improves recognition rate, reduces false judgment rate and calculation time. It can be applied to various embedded devices. DATP algorithm still has some recognition error, so the next phase is to research on more accurate recognition method.
Acknowledgement
This work was supported by Project of Zhejiang Public Welfare Technology Application Research under Grant No.2016C33038 and LGF18F010005, Project of National Natural Foundation of China under Grant No.61501403, and Major Science and Technology Special Project of Zhejiang Science and Technology Department (2015C01033) .
References
[1] Xu Zhiyong, Wang Wei. Discussion on speech signal processing technology and its application [J]. Engineering Technology, 2017, 4(2): 269-269.
[2] Han Jiqing. Development and research progress of acoustic event detection technology [J]. Data Acquisition and Processing, 2016, 31(2): 231-241.
[3] Zhou Xiaomin, LiYing. Image recognition of birds based on radon and translation invariant wavelet transform [J]. Journal of Computer Applications, 2014, 34(5): 1391-1396.
[4] Wang Yan, Li Wenguo, Zhang Yi, Zhang Weihua, Li Zhi. Border vehicle type voice recognition based on improved TESP algorithm [J]. Journal of Sichuan University, 2014, S2(S2): 122-127. [5] Zhu Jianmin, Zhang Lei, Zhai Dongting, Lei Jingtao. Research on speaker recognition based on multi-feature bayesian network fusion [J]. Journal of Instrument & Instrumentation, 2013, 34(9): 2058-2067.
[6] Li Ying, Chen Qiuju. Sound event recognition based on the optimized orthogonal matching tracking [J]. Jiangxi Communication Technology, 2010, 1 (1): 12-15.
[7] Yan Xin, Liying. Bird voice recognition using the anti-noise power to normalize the cepstrum coefficient [J]. Journal of Electronics, 2013, 41(2): 295-300.
[8] Chen Qiuju, Li Ying. Optimized orthogonal matching tracking and deep confidence network for voice recognition [J]. Journal of Computer Applications, 2016. 36(12): 1-9.
[9] Zhu Leqing, Zhang Zhen. Improved automatic recognition of insects based on MFCC and GMM [J]. Journal of Entomology, 2012, 55(4): 466-471.
[10] Zhao Shumin. Frequency analysis of speech signal based on MATLAB [J]. Jiangxi Communication Science and Technology, 2010, 1(1): 12-15.
[11] Wang Zaihuan. Research and realization of marking recognition method of chain saw in forest [D]. Chongqing University of Posts and Telecommunications, master's degree thesis, 2013.