2017 2nd International Conference on Computer Engineering, Information Science and Internet Technology (CII 2017) ISBN: 978-1-60595-504-9
A Comparative Study of Different Machine Learning
Algorithms on Gene Expression Profile Classification
TAO CHEN, SHENGLI HU, MAN CUI, YANG CAO, SHUANGYAN QUAN, JUN WEI and XIAO YANG
ABSTRACT
Many machine learning algorithms have been used to classify gene expression profiles in recently years. In order to furtherly study the performances of different machine learning algorithms on gene expression profiles classification, this paper compare the classification accuracy, run time and stability the of different machine learning algorithms including SVM, Decision tree, PNN, k-Nearest Neighbor, Bayesian and ELM on benchmark gene expression profile datasets. It provides a basis for scientific use of machine learning algorithms on gene expression profiles classification.
INTRODUCTION
DNA microarray technology is a technological breakthrough in the field of molecular biology in the 21st century, and it is possible to detect the expression levels of thousands of genes in a single experiment. It will help to classify diseases according to expression levels of genes in normal and tumor cells from molecular biology aspect. Therefore, the classification of gene expression profile has gained more and more attentions in recently years [1-3].
Microarray data has small samples and high dimension, and it contains a significant amount of irrelevant and redundant genes. The traditional algorithms can’t obtain the better classification performances, the machine learning algorithms were introduced in the gene expression profiles classification, such as Decision tree (DT)[4], Probabilistic neural network (PNN)[5], Bayesian [6], K-nearest neighbor (KNN)[7], Support vector machine (SVM)[8] and Extreme learning machine (ELM)[9], etc.
However, since it is not known in advance which classifier is the best for a particular classification problem, and how to choose the appropriate classifier is very difficult for a particular problem. In order to further study the performances of different machine learning algorithms on gene expression profiles classification, this paper compare the classification performances of different machine learning algorithms including SVM, Decision tree, PNN, k-Nearest Neighbor, Bayesian and ELM on benchmark gene expression profile datasets. It provides the basis for scientific use of machine learning algorithms on gene expression profiles classification.
_________________________________________
Tao Chen, Shengli Hu, Yang Cao, Shuangyan Quan, Jun Wei, Xiao Yang. Shaanxi University of Technology, HanZhong, China
The remainder of this paper is organized as follows: Six algorithms including Decision tree, Probabilistic neural network (PNN), Bayesian, K nearest neighbor (KNN), Support vector machine (SVM) and Extreme learning machine (ELM) are given in section 2. Section 3 makes experiments on gene expression profiles and gives the experimental results and analysis. The conclusion is made in the end.
ALGORITHMS
Decision tree
Decision tree is an effective graphical algorithm to express the process of classifying or evaluating an object. Through this graphical approach, it is clear how decisions can be made and models can be automatically built from tag samples. Decision trees are generally constructed using a bottom-up recursive approach, which the internal nodes in the tree graph of the decision tree represent the tests on the attributes and the branches represent the outputs of the tests, and each leaf node represents a different class.
Support vector machine (SVM)
Support vector machine is a new effective machine learning algorithm based on structural risk minimization for resolving high dimensions, small samples and nonlinear problems. The main idea of SVM is original feature space is mapped onto a high-dimension space by using an appropriate nonlinear function based on mercer kernel theorem, and the original nonlinear classification is converted to a linear classification problem in this high-dimension space, and then the optimal hyper plane is found to separate the samples in new feature space.
Extreme learning machine (ELM)
Extreme learning machine, proposed by Guang in 2004, is a new neural network learning algorithm. The ELM is a three-layer network structure including one input layer, one hidden layer and one output layer. The unique feature of ELM is the input weights and thresholds in the hidden layer are randomly assigned and never adjusted. Compare with traditional learning algorithms, ELM has some advantages of simple structure, fast learning speed and high generalization performance.
K nearest neighbor (KNN)
K nearest neighbors is a non-parametric algorithm used for classification. In cases, the input consists of the k closest training examples in the feature space. The output depends on whether k-NN is used for classification or regression. It can be useful to assign weight to the contributions of the neighbors, so that the nearer neighbors contribute more to the average than the more distant ones.
approximated by a Parzen window and a non-parametric function. Then, using PDF of each class, the class probability of a new input data is estimated and Bayes’ rule is then employed to allocate the class with highest posterior probability to new input data. By this method, the probability of misclassification is minimized.
Bayesian
Bayesian is a simple technique for constructing classifiers: models that assign class labels to problem instances, represented as vectors of feature values, where the class labels are drawn from some finite set. It is not a single algorithm for training such classifiers, but a family of algorithms based on a common principle: all bayes classifiers assume that the value of a particular feature is independent of the value of any other feature, given the class variable.
EXPERIMENT
Experimental datasets the parameters setting
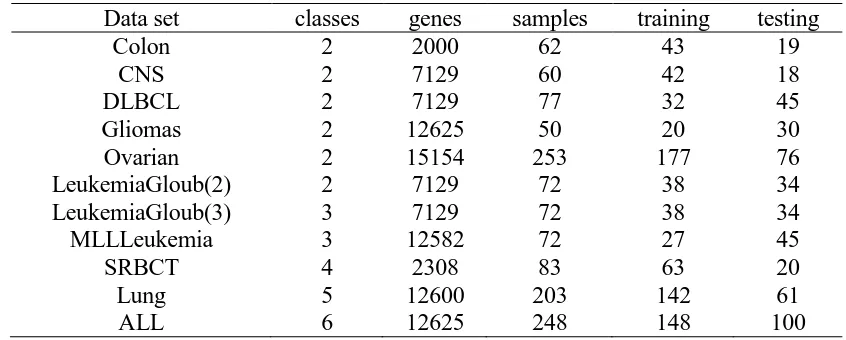
In order to compare the classification performance of six algorithms, well-known benchmark cancer gene expression profiles are used to implement in our experiment. The characteristics of datasets are described in table 1.
In order to decrease the dimension of gene expression profiles and improve quality of data, Kruskalwallis is used to reduce genes from original genes in our experiments at first and then the number of selected genes is 200.
Runtime environment: All methods used in this paper are coded in MATLAB with 64 bit running on an Inter(R) Core(TM) i3PC with dual-core3.0 GHz CPU and 4G memories.
The experiments are repeated 20 times independently, and then the average results of 20 times are as final results to guarantee non-contingency of the results of different algorithms.
Experimental results and analysis
Table 2 gives the comparison results of different algorithms on classification accuracy. It is clear that Bayesian is has the best classification accuracy, SVM and Decision tree have similar classification accuracy and are the worst. The reasons includes two aspects: one is the principle of the algorithm itself, the other is the number of reduced genes using kruskalwallis.
Table 3 gives the comparison results of different algorithms on run time. It is clear that the six algorithms have similar run times from table 3, and run time is between 9.61and 9.77 according to the average value.
TABLE 1. BENCHMARK CANCER GENE EXPRESSION PROFILES.
Data set classes genes samples training testing
Colon 2 2000 62 43 19
CNS 2 7129 60 42 18
DLBCL 2 7129 77 32 45
Gliomas 2 12625 50 20 30
Ovarian 2 15154 253 177 76
LeukemiaGloub(2) 2 7129 72 38 34
LeukemiaGloub(3) 3 7129 72 38 34
MLLLeukemia 3 12582 72 27 45
SRBCT 4 2308 83 63 20
Lung 5 12600 203 142 61
[image:4.612.91.507.278.463.2]ALL 6 12625 248 148 100
TABLE 2. THE COMPARISON OF DIFFERENT ALGORITHMS ON CLASSIFICATION ACCURACY (%).
DataSet SVM DecisionTree PNN KNN Baysian ELM
Colon 63.16 68.42 73.68 73.68 73.68 75.26
CNS 66.67 61.11 55.56 50 55.56 54.44
DLBCL 84.44 73.33 77.78 73.33 82.22 81.78
Gliomas 56.67 43.33 56.67 56.67 76.67 71
Ovarian 97.37 100 98.68 97.37 97.37 99.47
LeukemiaGloub(2) 79.41 91.18 97.06 97.06 94.12 88.53
LeukemiaGloub(3) 76.47 88.24 94.12 97.06 100 91.76
MLLLeukemia 80 62.22 88.89 84.44 93.33 93.78
SRBCT 60 70 100 100 95 84
Lung 78.69 86.89 95.08 96.72 93.44 81.8
ALL 85 90 98 97 97 93.9
[image:4.612.90.506.495.679.2]average 75.26 75.88 85.05 83.94 87.13 83.25
TABLE 3. THE COMPARISON OF DIFFERENT ALGORITHMS ON RUN TIME (S).
DataSet SVM DecisionTree PNN KNN Baysian ELM
Colon 2.05 2.09 2.09 2.06 2.06 2.11
CNS 7.38 7.56 7.47 7.43 7.41 7.47
DLBCL 7.36 7.41 7.41 7.36 7.36 7.42
Gliomas 12.84 13.00 12.90 12.95 12.91 12.96
Ovarian 16.79 17.24 16.62 16.92 16.89 16.99
LeukemiaGloub(2) 7.37 7.49 7.40 7.48 7.46 7.53
LeukemiaGloub(3) 7.56 7.70 7.64 7.65 7.66 7.69
MLLLeukemia 13.14 13.24 13.18 13.25 13.23 13.33
SRBCT 2.50 2.57 2.51 2.53 2.52 2.57
Lung 14.14 14.58 14.16 14.27 14.27 14.51
ALL 14.60 14.60 14.55 14.59 14.62 14.65
TABLE 4. THE COMPARISON OF DIFFERENT ALGORITHMS ON STABILITY. DataSet SVM DecisionTree PNN KNN Baysian ELM
Colon 7.4898e-15 0 1.4980e-14 1.1703e-16 1.1703e-16 4.333 CNS 1.4980e-14 1.4980e-14 0 0 1.1703e-16 14.7684 DLBCL 1.4980e-14 1.4980e-14 1.4980e-14 0 0 6.5252 Gliomas 0 7.4898e-15 7.4898e-15 1.1703e-16 0 8.6138 Ovarian 0 0 1.4980e-14 1.1703e-16 1.1703e-16 0.6795 LeukemiaGloub(2) 1.4980e-14 1.4980e-14 1.4980e-14 1.1703e-16 0 9.1392 LeukemiaGloub(3) 1.4980e-14 0 0 1.1703e-16 0 8.5243 MLLLeukemia 0 7.4898e-15 1.4980e-14 1.1703e-16 0 3.4427 SRBCT 7.4898e-15 0 0 0 0 8.0966 Lung 1.4980e-14 0 1.4980e-14 2.3406e-16 1.1703e-16 3.4082
ALL 0 0 0 0 0 1.2867
CONCLUSION
This paper compared the classification accuracy, run time and stability of different machine learning algorithms for gene expression profiles classification. It provides the basis for scientific use of machine learning algorithms on gene expression profiles classification.
ACKNOWLEDGEMENTS
This paper is supported by Scientific Research Program Funded by Shaanxi Provincial Education Department (16JK1149), Scientific Research Program Funded by Shaanxi University of Technology (SLGQD2017-07, and Qinba Mountains of Bio-Resource Collaborative Innovation Center of Southern Shaanxi Province of China (QBXT-Z(P)-15-20)).
REFERENCES
1. T.Chen. 2017. “An improved rotation forest algorithm based on heterogeneous classifiers ensemble for classifying gene expression profile,” Advances in Modelling and Analysis B, 60(1):1-24 2. T.Chen. 2017. “A selective ensemble algorithm based on improved teaching-learning based
optimization for classifying gene expression profiles, C+CA: Progress in Engineering and Science, 42(2):624-634.
3. T. Chen, Z.L. Hong, H. Zhao, et al. 2015. “A novel feature gene selection method based on neighborhood mutual Information,” International Journal of Hybrid Information Technology, 8(7):277-292.
4. K.H. Chen, K.J. Wang, M.L. Tsai, et al. 2014.“Gene selection for cancer identification: a decision tree model empowered by particle swarm optimization algorithm,” BMC bioinformatics, 5(1):49-56.
5. Zeinali, Yasha Story, Brett A. 2017. “Competitive probabilistic neural network,” Integrated Computer Aided Engineering, 24(2):105-118.
6. C. Bazot, N. Dobigeon, J.Y. Tourneret, et al., “Unsupervised bayesian linear unmixing of gene expression microarrays, ”2013, BMC bioinformatics, vol.14,no.1,pp.99-108.
7. S. Kar, K.D. Sharma, M. Maitra. 2015. “Gene selection from microarray gene expression data for classification of cancer subgroups employing PSO and adaptive K-nearest neighborhood technique,” Expert Systems with Applications, 42(1): 612-627.
8. H. Saberkaria, M. Shamsi, M. Joroughi, et al. 2014. “Cancer classification in microarray data using a hybrid selective independent component analysis (SICA) and υ-Support Vector Machine (υ-SVM) Algorithm, ” Journal of medical signals and sensors, 4,(4):291-299.