Available on line www.jocpr.com
Journal of Chemical and Pharmaceutical Research
__________________________________________________
ISSN No: 0975-7384 CODEN(USA): JCPRC5
J. Chem. Pharm. Res., 2011, 3(2):258-263
258
Analytical method development and validation protocol for
Lornoxicam in tablet dosage form
Atul R. Bendale*1, Jigneshkumar J Makwana2, Sushil P Narkhede1, Sachin B. Narkhede2, Anil G. Jadhav2, G. Vidyasagar3
1
Suresh Gyan Vihar Universe, Jaipur, Rajsthan
2
Smt. B. N. B. Swaminarayan Pharmacy College, Salvav (Vapi), Gujarat
3
Pharmacy Department, Kutch University, Bhuj, Gujarat
______________________________________________________________________________
ABSTRACT
Lornoxicam (chlortenoxicam) is a non steroidal anti- inflammatory drug (NSAID) of the oxicam class with analgesic, anti-inflammatory and antipyretic properties. It is available in oral and parental dosage formulation. Lornoxicam is a yellow or slightly yellow powder. It is slightly soluble in water, soluble in sodium hydroxide, slightly soluble in methanol. A simple spectrophotometric method was developed for the determination of lornoxicam in pharmaceutical tablet dosage form. Lornoxicam exhibiting λ max at 258 nm in mobile phase
(0.05 M NaOH) and obeyed linearity in the concentration range of 5-30mcg. The proposed method was statistically validated.
Keywords: Lornoxicam, Analytical method development, Validation protocol.
______________________________________________________________________________
INTRODUCTION
The scope of developing and validating analytical method is to ensure a suitable method for a particular analyte more specific, accurate and precise the main objective for that is to improve the condition and parameter, which should be followed in the development and validation[1,2]. Lornoxicam (chlortenoxicam) is a non steroidal anti- inflammatory drug (NSAID) of the oxicam class with analgesic, anti-inflammatory, and antipyretic properties.
in tablet dosage form. Hence, an attempt has been made to develop new spectrophotometry method for its estimation in pharmaceutical tablet dosage form with good accuracy, simplicit and precision. In UV-Spectrophotometric method UV spectrum is set in 258 nm and blank is placed in the cuvettes, after setting zero transmittance the sample is placed in another cuvette for measuring the absorbance the sample.
FIG.1: LORNOXICAM: (3e) - 6 Dihydro-
4h-Absorbance measurements were made on
ConTECH-CA 123balance was used for weighing the sample. Commercially available tablets of the lornoxicam were procured from the local market and estimated.
FIG 2: Determination of maximum wavelength of Lornoxicam
Preparation of mobile phase (100ml): make 0.05M NaOH solution.
Preparation of standard stock solution:
100 mg of lornoxicam in 100 ml of mobile phase to get concentration of 1 mg/ ml.
Preparation of working standard solution and construction of calibration curve: prepared stock solution was further diluted with mobile phase to get working standard 5, 10, 15, 20, 25, and 30 mcg of lornoxicam to construct Beer’s law plot
absorbance was measured at λ max at 380 nm, against mobile phase as blank .The standard graph
was plotted by taking concentration of drug on X concentration range of 5-30 mcg.
Preparation of sample stock solution and working sample solution:
accurately weighed and average was calculated. The tablet were then crushed to obtain f powder equivalent to about 4
259
in tablet dosage form. Hence, an attempt has been made to develop new spectrophotometry method for its estimation in pharmaceutical tablet dosage form with good accuracy, simplicit
Spectrophotometric method UV spectrum is set in 258 nm and blank is placed in the cuvettes, after setting zero transmittance the sample is placed in another cuvette for measuring the absorbance the sample.
6- Chloro- 3- [Hydroxy (Pyridin- 2- Ylamino) Methylene] - Thieno [2, 3-E] [1, 2] Thiazin- 4- One 1, 1-Dioxide
EXPERIMENTAL SECTION
Absorbance measurements were made on LABINDIA, UV 3000
balance was used for weighing the sample. Commercially available tablets of the lornoxicam were procured from the local market and estimated.
Determination of maximum wavelength of Lornoxicam
Preparation of mobile phase (100ml): Dissolve 0.2 gm of NaOH in 100
Preparation of standard stock solution: Standard stock solution was prepared by dissolving 0 ml of mobile phase to get concentration of 1 mg/ ml.
Preparation of working standard solution and construction of calibration curve: prepared stock solution was further diluted with mobile phase to get working standard
0 mcg of lornoxicam to construct Beer’s law plot
absorbance was measured at λ max at 380 nm, against mobile phase as blank .The standard graph
was plotted by taking concentration of drug on X-axis and absorbance on Y mcg.
le stock solution and working sample solution:
accurately weighed and average was calculated. The tablet were then crushed to obtain f powder equivalent to about 4 mg of lornoxicam was transferred to 100 ml volumetric flask , in tablet dosage form. Hence, an attempt has been made to develop new spectrophotometry method for its estimation in pharmaceutical tablet dosage form with good accuracy, simplicity, Spectrophotometric method UV spectrum is set in 258 nm and blank is placed in the cuvettes, after setting zero transmittance the sample is placed in another cuvette for
Ylamino) Methylene] - 2- Methyl-2, 3-Dioxide [8,9]
LABINDIA, UV 3000+Spectrophotometer. balance was used for weighing the sample. Commercially available tablets
Determination of maximum wavelength of Lornoxicam
ml of distilled water to
ion was prepared by dissolving 0 ml of mobile phase to get concentration of 1 mg/ ml.
Preparation of working standard solution and construction of calibration curve: The prepared stock solution was further diluted with mobile phase to get working standard solution of 0 mcg of lornoxicam to construct Beer’s law plot for the pure drug, the max at 380 nm, against mobile phase as blank .The standard graph axis and absorbance on Y-axis in the
[image:2.595.204.409.398.501.2]Atul R. Bendale et al J. Chem. Pharm. Res., 2011, 3(2):258-263 ______________________________________________________________________________
260
added mobile phase and shaken for a while. The volume was made up to the mark with mobile phase and required dilutions were made from the sample stock solution.[6]
Validation [7]
[image:3.595.142.472.204.250.2]Assay: The assay of the proposed method was ascertained by performing assay of the standard drug with reference to the sample drug and finding out the absorbance. From the absorbance percentage purity was calculated. The readings are shown in table 1.
Table 1: Assay of Lornoxicam Tablet
LORNICAM* 4
Claim of tablet (mg/tablet)
Drug found (mg/tablet)
%Purity
4 4.04 101.00%
RESULTS AND DISCUSSION
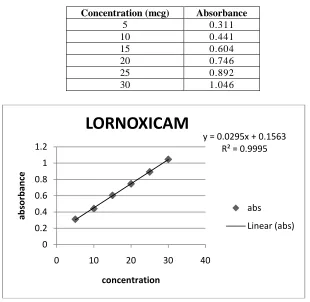
Linearity: To establish linearity of the proposed methods, six separate series of solutions of lornoxicam (5-30 mcg) in mobile phase (0.05 M NaOH) were prepared from the stock solutions and analyzed. Least square regression analysis was performed on the obtained data. Linearity data are shown in table 2 & 3 as follows:
Table 2: Linearity Table of Lornoxicam in Working Standard
Concentration (mcg) Absorbance
5 0.311
10 0.441
15 0.604
20 0.746
25 0.892
30 1.046
Fig. 3: linearity curve of Lornoxicam in working standard
y = 0.0295x + 0.1563 R² = 0.9995
0 0.2 0.4 0.6 0.8 1 1.2
0 10 20 30 40
a
b
s
o
r
b
a
n
c
e
concentration
LORNOXICAM
abs
[image:3.595.143.453.366.668.2]261
Table 3: Linearity Curve Data
Beer’s law limit (mcg) 5-30
Correlation coefficient (R2) 0.999
Regression equation (y٭) y = 0.029x + 0.156 Slope (m) 0.029
Y-Intercept(c) 0.156
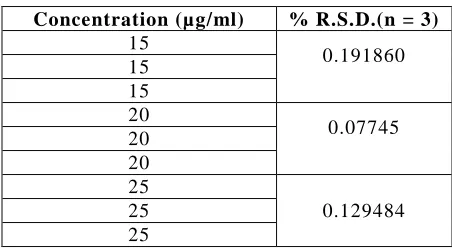
Precision Repeatability
Percentage R.S.D. was found between 0.07745 - 0.19186 %.
[image:4.595.188.414.272.396.2]Percentage R.S.D. is less than 1 %, it proves that UV-Visible spectrophotometer gives precise results.
Table 4 : Repeatability data of Lornoxicam
Concentration (µg/ml) % R.S.D.(n = 3)
15
0.191860 15
15 20
0.07745 20
20 25
0.129484 25
25
Intraday Precision
Percentage R.S.D for intraday precision was found between 0.15 - 0.36 %. Percentage R.S.D. is less than3 %, it prooves that method is precise.
Interday Precision
[image:4.595.142.429.544.640.2]Percentage R.S.D. for interday precision was found between 0.35 – 0.92%. Percentage R.S.D. is less than 5 %, it proves that method is precise.
Table 5: Intraday and Interday precision of Lornoxicam
Concentration (µg/ml)
INTRADAY (n =5) % R.S.D.
INTERDAY (n =5) %R.S.D.
5 0.36 0.92
10 0.30 0.46
15 0.15 0.54
20 0.18 0.35
25 0.19 0.44
30 0.17 0.61
ACCURACY: To determine the accuracy of the proposed method, recovery studies were carried out by adding different amounts of standard bulk sample of lornoxicam within the linearity range were taken and added to the pre-analyzed formulation of concentration 5 mcg and percentage recovery values are calculated (Table 6).
Mean percentage recovery was found between 101.00 – 101.53 %.
Atul R. Bendale et al J. Chem. Pharm. Res., 2011, 3(2):258-263 ______________________________________________________________________________
[image:5.595.78.531.93.278.2]262
Table 6: Accuracy data of Lornoxicam
Amount of Lornoxicam in
sample (µg)
Amt of std Lornoxicam
added (µg)
Total amount of Lornoxicam
Amount of Lornoxicam
found
% Recovery
(n = 3)
Mean % recovery
5 - 5 5.05 101.00
101.53
5 - 5 5.09 101.80
5 - 5 5.09 101.80
5 5 10 10.10 101.00
101.00
5 5 10 10.15 101.50
5 5 10 10.05 100.50
5 10 15 15.30 102.00
101.53
5 10 15 15.30 102.00
5 10 15 15.09 100.60
5 15 20 20.20 101.00
101.21
5 15 20 20.23 101.15
5 15 20 20.30 101.50
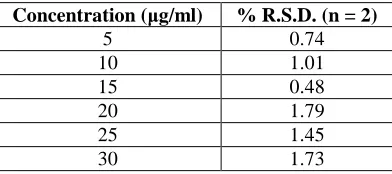
RUGGEDNESS
The data for ruggedness obtained from two different analysts is presented in Table 7. Percentage R.S.D. was found between 0.48 - 1.79 %.
[image:5.595.80.529.93.279.2]Percentage R.S.D. is less than2 %, it proves that method is rugged.
Table 7: Ruggedness data of Lornoxicam
Concentration (µg/ml) % R.S.D. (n = 2)
5 0.74
10 1.01
15 0.48
20 1.79
25 1.45
30 1.73
TABLE 8: Summary of validation parameter
PARAMETER RESULTS OFLORNOXICAM
Linearity range (µ g/ml) 5-30
Correlation coefficient, r 0.999 Precision (% R.S.D.)
Repeatability Intraday (n=5) Interday (n=5)
0.07 -0.19 0.15 -0.36 0.35 -0.92
Ruggedness (% R.S.D.) 0.48 – 1.79
Mean % recovery 101.00 – 101.53 %.
CONCLUSION
[image:5.595.209.405.393.480.2]263
REFERENCES
[1] Ewing G. W., (1985), Instrumental methods of chemical analysis, Fifth Edition., Mcgraw Hill International Edition., Chemistry Series, 1-4.
[2] Connor K. A., (1999), A textbook of pharmaceutical analysis, Third Edition, John Wiley and Sons Publication, 173-179.
[3] Skoog D.A., West D. M. and Holler F.T., (2001), Fundamentals of analytical chemistry, Seventh Edition, Harcourt College Publication, 710.
[4] Sharma. B. K., (2002), Instrumental method of chemical analysis, Twenty First Edition, Goel Publishing Housing, Krishna Publication, 3.
[5] Backett A. H. and Stenlake J. B., (2002), Practical pharmaceutical chemistry, Fourth Edition, Part 2, CBS Publishers and Distributors, New Delhi, 1-3.
[6] Sethi P.D., (2001), HPLC Quantitative analysis of pharmaceutical formulation, First Edition, CBS Publishers and Distributors, 6,11,135.
[7] Jonathan B. and Crowther, (2001), Validation of pharmaceutical test methods, Handbook of modern pharmaceutical analysis, Third Edition, Academic Press, 418-419.
[8] Martindale, (1999), The complete drug reference, Thirty Second Edition, Pharmaceutical Press, London, 128, 523.
[9] Martindale, (1999), The complete drug reference, Thirty Third Edition, Pharmaceutical press, London, 232, 599.
[10]USP, NF 19, (2000), The United States Pharmacopoeia and National Formulary, XXIV, U.S. Pharmacopoeial Convention, Inc., Rockville, 330-331.
[11]Budhavari S., Neil J., Smith A., Heckelman P. E. and Kinneary J. F., (1997), The Merck Index, An Encyclopedia of Chemicals, Drugs and Biologicals, Thirteenth Edition, Merck and Co., 860.