ISSN: 1992-8645 www.jatit.org E-ISSN: 1817-3195
NARROW BAND INTERFERENCE MITIGATION IN DS-UWB
SYSTEMS USING THE WAVELET TRANSFORM AND FFT
MOHAMED ALI ABDEL RAZEKP
1
P
, SAID BAYOMIP
2
P
, AHMED SAFWAT SADEKP
3
P
,IBRAHIM
FATHYP
3
P
1
P
Dept. of Communications Engineering, Higher Institute of Engineering, Modern Academy
P
2
P
Dept. of Communications Engineering, Higher Institute of Engineering, Modern Academy
P
3
P
The Communications Dept. of Electrical Engineering, Faculty of Engineering, Al Azhar University
ABSTRACT
Because of its importance, DS-UWB communication is an open research area, particularly in the context of its coexistence with OFDM based systems. In this paper, we present an analysis of the effect of the Narrow Band Interference of OFDM WLAN 802.11a systems, on the performance of BPSK-DS -UWB in terms of BER, along with a proposed interference mitigation technique based on both the discrete wavelet transform and the Fast Fourier Transform to improve the BER performance in the presence of the Narrow Band OFDM interfering signal. Simulation results show that the proposed method show an excellent performance especially at high signal to noise ratio.
Keywords--DS-UWB; WLAN 802.11a;Wavelet
1. INTRODUCTION
The Ultra Wide Band (UWB) technology is based on single band systems employing carrier free or impulse radio communications. Impulse radio (IR) refers to the generation of a train of impulse like waveforms, each of duration in the hundreds of picoseconds [1], [2] and [3]. This type of transmission does not require the use of additional carrier modulation and is a baseband signaling approach. UWB technology provides high data rate with low power spectral density due to modulation of extremely short pulses [4]. The very low transmission power and the large bandwidth enable an UWB system to co-exist with narrowband communication [5] without being a considerable source of interference. However, in an increasingly overcrowded frequency spectrum, interference due to coexistence with other spectrally overlapping wireless Narrow Band (NB) system degrades the performance of UWB systems [6]. The interference caused may jam the UWB receiver completely. According to Electromagnetic Compatibility (EMC) reports submitted to FCC [7], the narrowband interferences (NBI) expected by the UWB receivers are ,for example, computer motherboard of emission level 42.7dBm at 1.9 GHz, IEEE 802.11b at centre frequency 2.4 GHz, network interface card (NIC) of emission level 49.8dBm at 3.75 GHz, LAN switch of 44.3dBm at 3.75 GHz, peripheral component interconnect (PCI) card for a personal computer 3.75 GHz and
ISSN: 1992-8645 www.jatit.org E-ISSN: 1817-3195
2.SYSTEMMODEL
A. DS-UWB Transmitted signal model
For DS-UWB systems, the transmitted signal is generated usually through the following two step process: first, the periodic pseudo-random binary
spreading PN code is generated with
lengthNcchips and applied to the binary
information sequence via a spreader. Second, the spreaded signal is applied directly to an UWB pulse train generator with the proper polarity (polar signaling is considered here since it is the baseband equivalent for BPSK modulation). In the proposed system, data is transmitted on a block by block basis. The emission signal can be expressed as:
∞ ∑
∞ i i
i
DS (1)
P b c(t - T ) b
=-s(t) =
Where
DS
P is the transmitted power, T
bis the bit duration. The spreading code can be expressed as
∑
∑ ∑
N -1c
s(t) = c p(t - nT ) n c n=0
N -1
L c
= bi c p(t - nT - iT ) (2)n c b i=1 n=0
With
T
cis the chip duration .Itdoes not necessarilythat the chip duration is equal to the transmitted pulse width. It may be equal to or greater than the
pulse duration. The sequence
b
i∈ + −
{ 1, 1}
isthe
i
th transmitted bit. It is assumed thatb
i is anindependent and identically distributed (i.i.d) random binary sequence with zero mean and unit variance. We also assume that the spreading code
( )
c t that has unit energy and consists of
N
cchips;hence the block consists of N Lc chips. The chip is
an UWB second order monocycle pulse, that is, the second derivative of a Gaussian function defined as
2
2 2
2 2 (3)
t t
(t) = (1 - )exp( )
σ 2σ
p
Thus the DS-UWB signal can be written as
∞
∑ ∑
∞
DS 2 (4)
N -1c
s(t) = P bi c p (t-nT -iT ) n c b
i=- n=0
B. Narrow Band Interfering Signal model
A typical IEEE 802.11a OFDM WLAN transmitted signal consists of a stream of complex valued QPSK modulated symbols appearing at the output of the mapper and is divided into groups of data
symbols multiplexed with pilot symbols to form a
frame size of Nfft symbols. Each group of
Nfft symbols of data and pilots are then fed to an
Inverse Fast Fourier Transform (IFFT) block that performs multi carrier modulation at the base band level and transmitted as one OFDM symbol of
Nfft samples with duration of
T
sseconds. Thissymbol interval consists of two parts: a useful
symbol with duration
T
u and a cyclic Prefix withduration
T
CP. The cyclic prefix is a copy of the lastL samples of the symbol part and attached at the
header of each symbol when the symbol is sent. Based on the previous description to the WLAN signal, a general expression for the OFDM signal can be written as,
≤ ≤
∑ fft
OFDM OFDM
0 n, k Nfft- 1
Nfft-1+L
E k
k =0
j2πkn/N
s = s exp( ) (5)
With EOFDM is the energy of the transmitted
OFDM symbol, k is the IFFT index, n is the time
domain index, Nfft is the total number of sub
carriers used to create the OFDM symbol. The above equation represents the Narrow Band Interfering signal that will be used during the performance analysis and simulation.
C. Channel model
ISSN: 1992-8645 www.jatit.org E-ISSN: 1817-3195
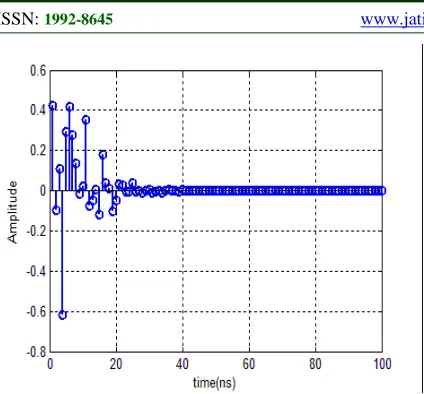
The channel model contains four different channel propagation scenarios named CM1-CM4. It provides enough degrees of freedom to match channel measurements, and can be used to match both LOS and NLOS channel characteristics separately. The channel impulse response of the IEEE model can be expressed as [10],
∑ ∑ l,k l l,k
l =1 k =1 LC K
h(t) =X α δ( - T - τ ) (6)t
Table(I): IEEE 802.15.3a UWB Channel Characteristics
Channel Characteristics
CM1 CM2 CM3 CM4
m
τ
[ns] (mean excess delay5.05 10.38 14.18
rms
τ
[ns] ( rmsdelay spread)
5.28 8.03 4.28 25
where X is a log-normal random variable
representing the amplitude gain of the channel,
LC
is the number of observed clusters, K thenumber of multi-path contributions from rays
received within the
l
thcluster,α
l k, the coefficientof the
k
th multi-path contribution of theth
l
cluster,T
lthe time of arrival of thel
thcluster,and
τ
l k, the delay of thek
thmulti-pathcontribution within the
l
thcluster. The channelcoefficient
α
l k, can be defined as follows:,
l k
α
=B
l k,β
l k, , whereB
l k, is a discrete binaryrandom variable assuming values
±
1
with equalprobability and
β
l k, the log-normal distributedchannel coefficient of multi-path contribution k
belonging to cluster l. Table (1) lists the parameter
settings for the IEEE channel models. Simulated sample realizations of Channel impulse response for each of the channel models defined in Table (1) via its parameters is shown in Figure (1). The channel impulse response (CIR) can be expressed in a general form that is consistent with any multi path channel. Thus, the channel impulse response
in Equation (6)can be expressed as,
∑ p p
p=1 NP
h(t) = w δ(t - τ ) (7)
With h t( ) is the CIR,NP =LC×K is the total
number of paths in the channel, w p is the
attenuation coefficient of the path number p and
p
τ is the corresponding delay. The channel weights
w pare assumed to be complex in general, but inan
UWB channel they are real as UWB systems are base band systems.
D. Received signal model
At each receiver input, the received signal is the result of the convolution of the transmitted signal with the channel impulse response corrupted by noise at the receiving antenna, and the received signal of any user can be expressed as,
(t) = s(t) * h(t) + n(t) (8)
y
Where (*) denotes the linear convolution operator. At the receiver, the received signal is expressed as,
∑
∑ ∑
∞ ∑ ∑
∞
OFDM
DS
NP
w 2 p
p=1
N -1+L
NP fft
wp E s exp(j2πkn/N ), 0£n, k£N - 1k fft fft
p=1 k=0
N -1c
P bi c p (t-nT -iT -τ )n c b p
i=- n=0
+
r(t) =
+ n(t) (9)
With
n t
( )
is the additive white Gaussian noise, arealization of the Gaussian random process η( )t
which has zero mean and a variance ofσn2. At
each receiver, the received signal is then chip matched filtered, sampled at the chip rate and a
vector r is formed by collecting
N
csampler [image:3.612.93.305.72.269.2]ISSN: 1992-8645 www.jatit.org E-ISSN: 1817-3195 outputs together. After chip matched filtering and
sampling at the chip rate, the sampler output is thus,
(
)
∫
∫
(n+1)Tc 1
r [n] = r(t)dt nT Tc c
(n+1)Tc 1
= + NBI(t) dt nT
Tc c i
(t) (10)
y
The chip matched filtering is simply an “integrate
and dump” operation performed over a time
interval equal to the chip duration. An observation
vector r [n]
i is formed on a bit by bit basis by
collecting together
N
c successive outputs fromthe sampler output. Thus each observation vector
corresponds to one bit duration. The vector r
corresponding to the
i
thbit can be expressed as,r = [ri i1,..., iNr c] (11)
3. BER ANALYSIS IN THE PRESENCE OF NB
INTERFERENCE
In this section the Bit Error Rate (BER) of the matched filter receiver is provided .According to [ ], the BER of a DS-UWB matched filter receiver can be expressed as
e (12)
P = Q( SNR )
An intuitive modification is that the SNR that appears in the argument of the Q function is instead the Signal to Interference plus Noise ratio (SINR), which can be written in terms of SNR and the Signal to Interference Ratio (SIR) separately as follows,
S 1
SINR = = (13)
I + N 1/SIR + 1/SNR
The SIR can be written in terms of the number of WLAN interfering users as,
∑
PDS SIR = m
Pi i=1
(14)
Where PDS is the power of the DS-UWB signal ,
Pi is the power of the ith interfering user at the
receiver's input and m is the total number of
interfering users being active and accessing the UWB channel. Assuming that all the interfering users transmit equal powers thus,
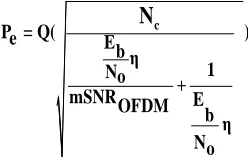
c
P = Q(e ) (15)
Eb
η 1
No +
mSNROFDM E
b η No
N
WithSNR
DSis the SNR of the DS-UWB signal
and
OFDM
SNR is the adequate signal to noise ratio
of the OFDM interfering signal per user, both are defined at the receiver's input. The adequate value
of SNR
OFDM specified by the IEEE802.11a
physical layer standard is found to be [] dB. The SNR of the DS system can be expanded in terms of
the ratio of the bit energy
E
bto the single sidedpower spectral density
N
oand the spectralefficiency
η
which may also expandedasRb /BWt , with Rbis the bit rate and BWt is
the transmission band width of the UWB signal (typically 3GHz).
4. PROPOSED NB INTERFERENCE
MITIGATIONTECHNIQUE
[image:4.612.316.440.153.234.2]ISSN: 1992-8645 www.jatit.org E-ISSN: 1817-3195
Each Nc samples, corresponding to one bit, are
then grouped and transformed from the time domain to the frequency domain by an FFT operation. The transformed samples are then analyzed using a discrete wavelet transform which produces two coefficient vector each consisting of
Nc/ 2
é
ù
ê
ú
samples .The first coefficient vector, CA ,is then fed to the IFFT while the second coefficient
vector , CD , is neglected .The idea behind using
the wavelet transform as a NB interference mitigation technique for DS-UWB systems is that in the frequency domain, the NB signal appears as a tone for the DS-UWB signal .The wavelet transform analyzes the spectrum of both the DS-UWB signal and the NB signal into a an array of
detailed coefficients, CD, and an array of
approximate coefficients, CA .It can be correctly
concluded that the NB signal spectrum is concentrated in the detailed coefficients array where the spectrum of the DS-UWB signal tends to concentrate in the approximate coefficients array.
The approximate coefficients that represent the
desired DS-WB signal is returned to the time domain by an IFFT operation and the output of IFFT is then fed as the input to the threshold device which decides the value of the estimated information bit according to the following equation,
^ sign[req + 1
s =
2 (n)]
(n)
(16)
With ^
s(n)is the estimated version of the nth
transmitted symbol in the DS-UWB
system,sign(.)is the sign function andreqis the
value of the wavelet filtered symbol in the time domain, i.e. after the Inverse Fast Fourier Transform operation.
5. SIMULATION RESULTS AND ANALYSIS
In this section, we present some numerical results for the BER performance of the DS-UWB system in the presence of NB - OFDM interferers. General simulation parameters of the systems used are shown in Table (II).The transmission data rate of the DS-UWB system is 100 Mbps, one of the optional data rates recommended by the IEEE 802.15.3a standard. The number of DS-UWB transmitted is equal to 10,000 BPSK symbols (bits) each including a spreading sequence of lengths
Nc=15chips which is the same as the spreading
factor. We consider the IEEE 802.11a OFDM based system with 256 subcarriers with a sub carrier spacing of 312.5, fixed-point platform that is considered for simulations. We have used the IEEE 802.15.3a channel models (CM1- CM4) for our simulation study. These channel models are based on both Line Of Sight (LOS) and None Line Of Sight NLOS channel measurements performed over a coverage area of (4–10 m).The bandwidth of the DS-UWB signal is considered to be 3GHz while the bandwidth of the OFDM interferer is 16.66MHz. The BER performance of the DS-UWB system is evaluated in both cases of the absence
and existence of the NBI over the range of E /No
b from0dB to 20dB.As the SNR of the WLAN system is about 25dB and the two systems experience the same attenuation, the signal to interference ratio (SIR) is in the range of about 20dB.
Table (II)
System DS-UWB
Modulation BPSK
Transmission Bit Rate 100 Mbps
Spreading codes Maximal length pn
sequence
Code length 15chips
Spreading factor 15
Chip duration 2/3 ns
Pulse shape 2P
nd
P
derivative monocycle
Pulse duration 2/3ns
Channel Model IEEE 802.5.13a
CM1-CM4
Receiver type Correlator
System IEEE WLAN 802.11a
Modulation QPSK
Transmission Bit Rate 48 Mbps
FFT size 256
[image:5.612.315.529.506.725.2]ISSN: 1992-8645 www.jatit.org E-ISSN: 1817-3195
Sampling rate 16.66MHz
Sub carrier spacing 312.5kHz
Symbol duration 4µs
Center Frequency 5.2GHz
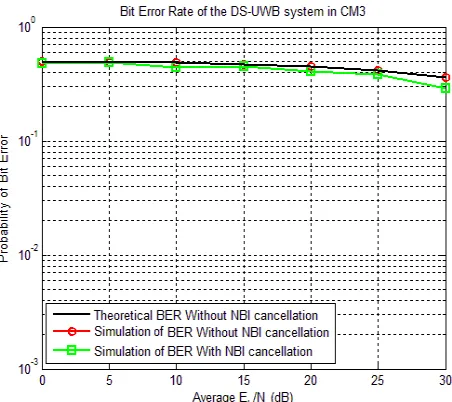
Figure(3-a) illustrates the BER performance comparison between the conventional UWB correlation receiver with and without the wavelet based NB interference canceller considering the UWB channel model CM1.Channel models CM2, CM3 and CM4 are also illustrated in Fig (3-b),Fig (3-c) and Fig (3-d) respectively. The BER performance is severely degraded due to the addition of a single NB interferer. In all of the
channel models the BER is above the10-1floor. The
analytically derived expression shows an excellent agreement with simulations in the four UWB channel models. It can be seen that the suggested new technique is provides a significant improvement in the receiver's performance and the proposed correlator receiver is efficiently able to mitigate interference and improve the BER performance of DS-UWB system. For example, in channel model CM1, Figure (3-a), it can be seen
that the SNR enhancement at a BER of 10-1 is
larger by more than 5dB. This true also for the channel model CM2. This significant enhancement is attributed to the ability of the wavelet transform to decompose the spectral components into its detailed structure and eliminate these details in the spectrum of the received signal caused by the presence of the single tone NB signal. However, the other two channel models CM3 and CM4 suffers from strong Inter Symbol Interference
between adjacent chips due to their relatively larger time spread and mean excess delay. This, of course, raises the total interference level and hence the BER enhancement is not as significant as in the first two channel models.
Figure (3-A), BER Performance Of The Correlator
Receiver In The Presence Of NBI Under The Channel Figure (3-B), BER Performance Of The Correlator Receiver In The Presence Of NBI Under The
[image:6.612.89.531.72.360.2] [image:6.612.94.306.76.352.2] [image:6.612.325.522.166.354.2] [image:6.612.328.554.396.597.2]
ISSN: 1992-8645 www.jatit.org E-ISSN: 1817-3195
6.CONCLUSION
The impact of NB interference on the BER performance of DS-UWB systems has been analytically studied, considering the IEEE 802.15.3a UWB channel model with its four different propagation scenarios and the IEEE802.11a WLAN system and signal models in the performance analysis. This model is much simpler than methods based on the Gaussian approximation that fails in the case of single NB interferer and the pulse collision models that is much more complex. Also a wavelet transform based interference cancellation technique is proposed .It is shown, through simulations, that is the proposed algorithm has an excellent performance especially in channel models CM1 and CM2.
REFERENCES
[1]- M. Z. Win and Robert A. Scholtz, "Impulse
Radio--How it Works", IEEE
Communications Letters, vol.2, no.2,
pp.36-38, Feb. 1998.
[2]- M. Z. Win and R. A. Scholtz, "Ultra-wide bandwidth time hopping spread-spectrum impulse radio for wireless multiple access
communications," IEEE Transactions on
Communications, vol.48, no.4, pp.679-689,
April 2000.
[3]- JFM Gerrits, JR.Farserotu, "Wavelet generation circuit for UWB impulse radio
applications," IEEE Electronics Letters,
vol.38, no.25, pp.1737-1738, 2002.
[4]- Federal Communications Commission, "Revision of part 15 of the commission’s rules regarding ultra-wideband transmission systems, first report and order (ET Docket 98-153)," Adopted Feb. 14, 2002, Released Apr. 22, 2002.
[5]- J. R. Foerster, "The Effects of Multipath Interference on the Performance of UWB Systems in an Indoor Wireless Channel,"
53rd IEEE VTS, vol.2, no.69, pp.1176- 1180,
2001.
[6]- L. Zhao, A. M. Haimovich, and H. Grebel, "Performance of ultra-wideband communications in the presence of
interference," IEEE proceedings of ICC-01,
pp.2948-2952, 2001.
[7]- R. Kshetrimayum, "An introduction to UWB
communication systems," IEEE Potentials,
vol.28, no.2, pp.9-13, Mar.-April 2009. [8]- Zhao Guannan, Jin Minglu, Fan Wei, "A
Low-complexity NBI Suppression Algorithm
in UWB Systems," International Conference
on Communication Technology (ICCT-06),
pp.1-4, 2006.
[9]- MK Lakshmanan, H. Nikookar, "Mitigation of interference from wideband IEEE 802.11a source on UWB wireless communication using frequency selective wavelet packets,"
IEEE International conference on waveform diversity and design, pp.50–4, Jun. 2007. [10]- Huy Quach, Anh Dinh, "Narrowband
interference elimination in UWB
Communications systems," CCECE 2007, pp.
1341 - 1344, July 2007.
[11]- J.R. Foerster, "Interference modeling of pulse-based UWB waveforms on narrowband
systems," IEEE 55th Vehicular Technology
Conference, vol.4, pp.1931-1935, May 2002.
[12]- M. Pausini and G. J. M. Janssen, "Narrowband interference suppression in transmitted reference UWB receivers using
sub-band notch filters," European Signal
Processing Conference, EUSIPCO-06, Sept.
2006.
Figure (3-D), BER Performance Of The Correlator Receiver In The Presence Of NBI