ISSN: 1992-8645 www.jatit.org E-ISSN: 1817-3195
EFFECTIVENESS OF EMPIRICAL MODE DECOMPOSITION
TECHNIQUE ON SEMG SIGNALS IN FATIGUE
ASSESSMENT DURING A WALK
1RUBANA H. CHOWDHURY, 2HADAATE ULLAH, 3M.B.I Reaz
1,3
Department of Electrical, Electronic and Systems Engineering, University Kebangsaan Malaysia,
43600, UKM, Bangi, Selangor, Malaysia
2
Department of Electrical and Electronics Engineering Southern University Bangladesh
E-mail: [email protected]
ABSTRACT
Muscle fatigue is often caused by unhealthy and irregular work practice. It is defined as a long lasting reduction of the ability to contract and it is the condition when produced force is reduced. Faster walking can cause muscle fatigue, which is unhealthy when the level of fatigue is high. There are many mathematical parameters that are suitable to assess the muscle fatigue during gait. Out of these parameters, the amplitude and frequency of the surface EMG signal (sEMG) reflects the more accurate physiological activity in the motor unit during contraction and at rest. In this research, Empirical mode decomposition (EMD) - based filtering process is applied on sEMG signal for realizing the fatiguing contraction during subject walking exercise. The purpose of this research is to evaluate the surface electromyographic parameters (RMS, IAV and AIF) for addressing the effectiveness of the EMD method. In this study, RMS, IAV and AIF values were used as spectral variable, which extensively categorizes the difference between fatigue and normal muscle when using EMD method compared with other different wavelet functions (WFs). Furthermore, the outcome also demonstrates that, amplitude and frequency of EMG signal significantly changes from rest position to maximum contraction position. In this study, we will try to show that by using the EMD method an identification of reliable discrimination between fatigue and non-fatigue muscle is possible.
Keywords: Electromyography; Wavelet Transform; EMD; RMS; IAV; AIF
1. INTRODUCTION
Electromyography signal is the representation of electrical currents generated in muscles during its contraction representing neuromuscular activities. The surface EMG (SEMG) signal measure the muscle condition (fatigue or non-fatigue) at different movement position by measuring the electrical stimulation in the muscle.
Muscle fatigue is a long lasting reduction of the ability to contract and it is the condition when produced force is reduced [1].When the fatigue level is out of the specific level serious injuries occurred. Precisely detection of the muscle fatigue provides important information to the fields of Evolvable hardware (EHW) chip development, human machine interaction, sport injuries, ergonomics, prosthetics etc.
Many researchers use different types of methods for analyzing the sEMG signal during localised muscle fatigue including the following: Time frequency analysis, Principle component
analysis, Wavelet transform (WT), Higher order statistics (HOS),Frequency band analysis [2, 3, 4, 5]. Both the techniques of HOS and WT were suitable for SEMG signal processing and these methods remove Gaussian noise (recorded noise) effectively. M. S. Hussain et al. showed that mean power frequency significantly increases when the muscle contraction level (from low contraction level to high contraction level) increases in SEMG [3]. In this study, Empirical mode decomposition and different Wavelet functions are used to decompose the SEMG signal, which are collected from rectus femories muscle during different walking condition (Slow to fast).
ISSN: 1992-8645 www.jatit.org E-ISSN: 1817-3195 RMS values which are the firing rate , motor unit
action potential (MUAP) shape, cross correlation of unit discharges and lastly the number of active units. The RMS value is linearly proportional to the muscle fiber conduction velocity [7]. Furthermore, during fatigue, RMS is also affected by the shift in power spectral density (PSD) to the lower frequencies. Particularly when using the surface electrodes to acquire EMG signals RMS value increases due to this shift. During isometric, isotonic sustained contractions, the RMS value increases over contraction time [8].
Now a days, mean frequency and median frequency are very established frequency parameter for analyzing the surface EMG signal. However, compared to these frequencies, the instantaneous frequency (IF) is more reliable in time-frequency analysis. The accuracy of IF is more particularly when studying local muscle fatigue during muscle contractions [9]. In this study Average instantaneous frequency (AIF) is used as a parameter for analyzing the surface EMG signal during muscle contraction after processing by EMD method and different types of wavelet transform method.
Many researchers used different types of mathematical parameters for determining the level of fatigue in a subject. During this study, the RMS, IAV and AIF values are performed to understand which method is the best for identifying the muscle fatigue. This research suggests that the EMD method provides the best contrast for the identification of muscle contraction during gait.
2. METHODOLOGY
In this study, Eleven EMG data sets are used, which are collected from a North American teenage male. Each data collected from Right rectus femories muscle. This raw EMG data are collected from Motion lab system [10].The raw data files are all sampled at 800 samples per second. In this research, Empirical Mode Decomposition (EMD) and Discrete wavelet transform are used for filtering the EMG data sets. Six mother wavelets are selected to be evaluated in this study. They are the second, the sixth, the eighth, forty-fourth and forty- fifth orders of Daubechies wavelet (db2, db6, db8, db44 and db45) and fourth and fifth order of the symlet (Sym4 and Sym5). In this research, Matlab 2012 is used for processing the EMG signal by using signal-processing toolbox, wavelet toolbox and user defined functions gathered into the Time–Frequency Toolbox.
2.1 Empirical Mode Decomposition (EMD) EMD method introduced by Huang et al., which can be decomposed the complicated data set adaptively into a finite number of intrinsic mode functions [11]. For the filtering purposes, the EMD algorithm decomposes the EMG signals from right rectus femories muscle into a number of intrinsic oscillation modes. The EMD defines components of a signal in terms of IMFs. The functions are called IMF when it satisfy two following conditions - 1. The number of local extrema of the signal and the number of its zero-crossings must either be equal or differ at most by one.
2. At any point in the time series, the mean value of the “upper envelope” (determined by the local maxima) and the “lower envelope” (determined by the local minima) is zero.
The EMD method decomposes the EMG signal, x (t) into different IMF components as follows Firstly, determine the upper envelope and the lower envelope of the signal by using cubic spline interpolation. Upper envelope (UE) found by connecting all the local maxima smoothly. Lower envelope (LE) found by connecting all the local minima smoothly.
Calculate the mean value (m1) of UE and LE by equation (1)
LE)/2 + (UE =
m (1)
The first component, h1 (t) is find out by the differences between the data and the first mean value
(t)
m
-x(t)
=
(t)
h
1 1 (2) h1 is an IMF if it satisfies the conditions IMF function. If h1 (t) is not an IMF, sifting process continued K times until h fulfill the IMF criteria. (t) m -(t) h = (t)
h1k 1 1k (3)
If h1k (t) satisfy the condition of this function it is defined as c1.Sum of difference (SD) is used as a stopping criteria for terminate the sifting process.
∑
= − −−
=
T t k k kt
h
t
h
t
h
SD
0 1 2 2 1)
(
)
(
)
(
(4)
Let the predetermined value for SD is 0.3.If SDk is smaller than this value in the algorithm, the sifting process will be stopped. Finally, residue component, r1 is finding out by subtracting the original data, x (t) and the c1.
1 1
x
(
t
)
c
r
=
−
(5)
ISSN: 1992-8645 www.jatit.org E-ISSN: 1817-3195 stopping condition reached, the sifting procedure
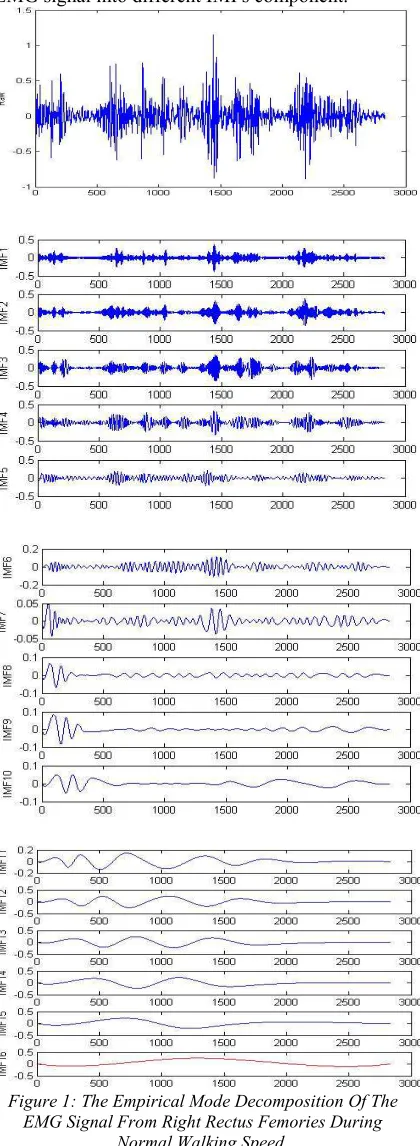
stopped and final residual component is rn. Figure 1
[image:3.612.93.303.136.709.2]shows that the EMD method decomposes the raw EMG signal into different IMFs component.
Figure 1: The Empirical Mode Decomposition Of The EMG Signal From Right Rectus Femories During
Normal Walking Speed.
Finally, reconstructed signal is signal obtained by adding the selected major IMF’s component and mean of residue. The major IMF components are that components which carry the same frequency of the raw signal. IMF component that carry the major information of the signal represent the important component. The original signal S (t) can be represented as (6),
n k
i
i m
C t
S =
∑
+−
=
1
1
)
( (6)
Where, mn is the mean of final residual component, Ci is the i th IMF component.
2.2 Wavelet Decomposition
Discrete wavelet Transform (DWT) is the time filter bank which is calculated by consecutive low-pass and High-pass filtering (coefficients of filters depend on WF type) in the time domain. Let discrete sequence of input x[n].Input are passed through the filter bank pairs which involve low pass and high pass filters with impulse response l[n] and h[n] respectively. The decimation output is given below
∑
∞
=
−
=
α
k
k
n
l
k
x
n
y
1[
]
[
].
[
2
]
(7)∑
∞=
− =
α k
h n xk h n k
y [ ] [ ]. [2 ] (8)
Here, yl[n] and yh[n] are the outputs of the detail co-efficients from low pass and high pass filter respectively. The aptitude of DWT is to decompose the original signal into multi-resolution components according to a basis function called mother wavelet or wavelet function and extract the important feature from the signal [12].
ISSN: 1992-8645 www.jatit.org E-ISSN: 1817-3195
Figure 2: Raw EMG Signal Denoised By Wavelet Function (Db44)
3. RESULTS
The RMS is very important parameter for analyzing the raw EMG signal in the time domain. The RMS of the EMG signal calculates the square root of the average power of the raw EMG signal over a specific period.
The root mean square value is given below
) ... (
/
1 n x12 x22 xn2
RMS= + +
(9)
Here x is a sample point with the sum taken over sample size n. According to (9), the higher the RMS value, the better the denoising performance of the filtering method.
Another parameter for analyzing the EMG signal is Integral of absolute value (IAV), which is an average of absolute value of the EMG amplitude in a segment. It is calculated by equation
∑
=
=N
i i
x
N
IAV
1
1 (10)Where xi represents the EMG signal in a segment i, N is the length of the signal.
Instantaneous frequency (IF) is another type of signal parameter which provides important information about the time-varying spectral changes in EMG signals. In the case of real signal, s (t) the instantaneous phase of the complex time signal, S (t) using equation (11) [14]:
)]
(
[
)
(
)
(
t
s
t
iH
s
t
S
=
+
(11)Where,
• S(t) is the analytic signal constructed from s(t) and its Hilbert transform
• s(t) is the input signal and
• H[s(t)] is the Hilbert Transform of the input signal
Again, the expression of the analytic signal of equation can be expressed in polar coordinates (12):
)]
(
exp[
)
(
)
(
t
A
t
i
t
S
=
φ
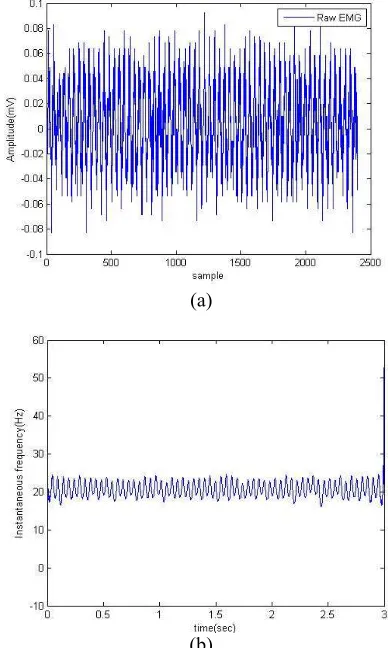
(12)Where, A (t) is the amplitude and ϕ (t) is the instantaneous phase of the analytic signal. The IF is calculated as the derivative of ϕ(t).The required AIF is obtained by averaging all the IF values over full length of the signal. Figure 3 represents the sample raw EMG signal during rest muscle position (a) and instantaneous frequency spectrum over time (b).
(a)
(b)
Figure 3: (A) Sample Raw EMG Signal At Rest Position And (B) Instantaneous Frequency Of EMG Signal At Rest
Position After Processing By Db44
4. PERFORMANCE ANALYSIS AND
DISCUSSION
ISSN: 1992-8645 www.jatit.org E-ISSN: 1817-3195 Sym5) are suitable for denoising the signal
[image:5.612.318.560.98.351.2][3,15,16].
Figure 4: RMS Values Of Different Walking Tryout Using EMD And Different Wavelet Functions
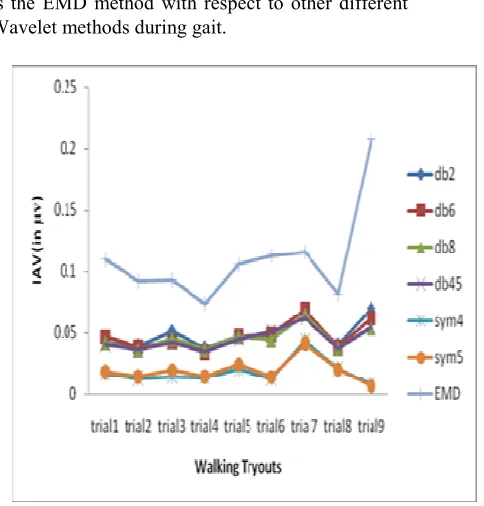
The IAV values (in µv) and AIF values (in Hz) of experimental signals of different walking exercises are represented in figure 5 and figure 6.
Recently, researchers prove that if SEMG signals analyzed by db45, distinguish between fatigue and non-fatigue muscle is clearly identified [16]. From figures 4, 5and 6, it is observed that the EMD-based filtering method gives the best result compared with other wavelet functions filtering method on average during normal walking exercise.
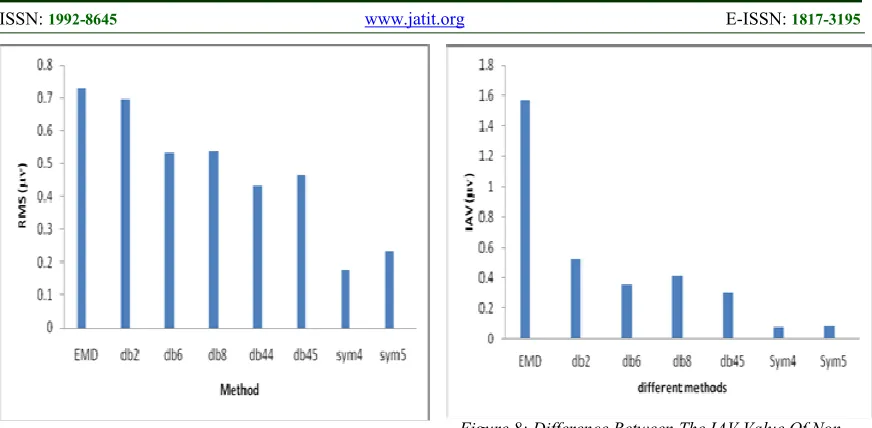
Table 1 and 2 gives the RMS value and IAV of the output of EMD method and different wavelet functions (Daubechies at level 4 and Symlet at level 8) at rest position and maximum contraction position. This also provides the difference between the RMS & IAV values at muscles rest position and RMS & IAV values at muscle maximum contraction position. Similarly, table 3 gives the difference between AIF values at rest and muscle contraction position. The highest difference values are highlighted in the tables.
Furthermore, it is observed that, the RMS, IAV & AIF value difference between rest and maximum contraction position is more significant for EMD method than other different wavelet functions (WF). Table 1, 2 and 3 has been graphically presented in fig 7, fig 8 and fig 9 respectively. EMD method gives the best outcome compared with other different WFs, which is exposed in figure7, figure 8 and figure 9.
Therefore, it can be seen from the above results that the best method used to process SEMG signals
is the EMD method with respect to other different Wavelet methods during gait.
Figure 5: IAV Values Of Different Walking Tryout Using EMD And Different Wavelet Functions
ISSN: 1992-8645 www.jatit.org E-ISSN: 1817-3195
[image:6.612.91.527.72.286.2]Figure 7: Difference Between The RMS Value Of Non-Fatigue And Non-Fatigue SEMG
Figure 8: Difference Between The IAV Value Of Non-Fatigue And Non-Fatigue SEMG
Table1: Difference Between RMS Values Of Two-Contraction Levels (Rest And Max)
Muscle
Contraction
Position
RMS value (µv)
EMD
db2
db6
db8
db45
Sym4
Sym5
Rest
0.027
0.0224
0.0246
0.0249
0.0269
0.0045
0.0048
Maximum
0.4556
0.7185
0.7185
0.5554
0.4922
0.1802
0.2376
Difference
0.7286
0.6961
0.5308
0.5359
0.4653
0.1757
0.2328
Table2: Difference Between The IAV Values Of Two-Contraction Levels (Rest And Max)
Muscle
Contraction
Position
IAV value (µv)
EMD
db2
db6
db8
db45
Sym4
Sym5
Rest
0.0255
0.0182
0.0211
0.0213
0.024
0.0042
0.0046
Maximum
1.5962
0.539
0.3808
0.4332
0.3297
0.0803
0.0859
ISSN: 1992-8645 www.jatit.org E-ISSN: 1817-3195
Table 3: Difference Between The AIF Values At Two-Contraction Levels (Rest And Max)
Muscle Contraction Position
Averaged Instantaneous frequency (Hz)
EMD db2 db6 db8 db44 db45 Sym4 Sym5
Rest 21.675 20.6617 20.640 20.641 20.6568 20.6458 0.2962 0.3053
Maximum 41.3506 22.6583 23.290 25.2932 23.9546 23.9598 14.3152 10.3284
Difference 19.6749 1.9966 2.6499 4.6522 3.2978 3.314 14.019 10.0231
5. CONCLUSION
The result of this research demonstrates that the difference between the SEMG corresponding to relax and maximum contracting muscle is significantly identified when using EMD-based filtering method compared with other Wavelet-based denoising method at different functions. During fatiguing contractions in rectus femories muscle, the surface EMG manifestations of muscle fatigue differed in magnitude for amplitude and in frequency. The study suggests that promoted muscle contraction position (relax position to maximum position) leads to an expansion in RMS value, IAV and AIF value. In this study, EMD Model simulations confirm that the fatiguing contraction changes can cause the observed changes in EMG amplitude and instantaneous frequency. In further studies, the application of EMD method for other muscles during gait can be explored.
REFRENCES:
[1] M.R. Al-Mulla, F. Sepulveda and M. Colley, “A Review of Non-Invasive Techniques to Detect and Predict Localised Muscle Fatigue”,
Sensors. vol. 11, pp. 3545-3594, 2011
[2] R.A. Da Silva, C. Larivière, A.B. Arsenault, S. Nadeau and A. Plamondon,“The comparison of wavelet- and Fourier-based electromyographic indices of back muscle fatigue during dynamic contractions: validity and reliability results”,Electromyogr Clin Neurophysiol.,vol. 48, pp. 147-162, 2008
[3] M.S. Hussain, M.B.I. Reaz and M.I. Ibrahimy, SEMG Signal Processing and Analysis Using Wavelet Transform and Higher Order Statistics to Characterize Muscle Force. 12th WSEAS International Conference on SYSTEMS, Heraklion, Greece, pp. 366-371, 2008.
[4] V. Von Tscharner,“Time-frequency and principal-component methods for the analysis of EMGs recorded during a mildly fatiguing exercise on a cycle ergometer”,J Electromyogr Kinesiol.,vol. 12, pp. 479-92, 2002.
[5] J.M. Wakeling and T. Horn,“Neuromechanics of muscle synergies during cycling”,J Neurophysiol.Vol. 101, pp. 843-854, 2009. [6] T.Y. Fukuda, J.O. Echeimberg, J.E. Pompeu,
P.R.G. Lucareli, S. Garbelotti , R.O. Gimenes, “A. Apolinário, Root Mean Square Value of the Electromyographic Signal in the Isometric Torque of the Quadriceps, Hamstrings and Brachial Biceps Muscles in Female Subjects”,J. Applied Research.Vol. 10, pp. 32-39, 2010.
[7] K.C. Mcgill and Z.C. Lateva, History dependence of human muscle-fiber conduction velocity during voluntary isometric contractions.J Appl Physiol.vol. 111, pp. 630– 641, 2011.
[8] L.A.C. Kallenberg and H.J. Hermens. “Behaviour of a surface EMG based measure for motor control: Motor unit action potential rate in relation to force and muscle fatigue”,Journal of Electromyography and Kinesiology,vol. 18, pp. 780-788, 2007. [9] A. Georgakis, L.K. Stergioulas and G. Giakas.
“Fatigue Analysis of the Surface EMG Signal in Isometric Constant Force Contractions Using the Averaged Instantaneous Frequency”, IEEE Transactions ON Biomedical Engineering, vol. 50, pp. 262-265, 2003
[10] Motion Lab Systems, Inc.,
http://www.emgsrus.com.
ISSN: 1992-8645 www.jatit.org E-ISSN: 1817-3195 [12] A. Phinyomark, C. Limsakul and P.
Phukpattaranont. Optimal Wavelet Functions in “Wavelet Denoising for Multifunction Myoelectric Control, ECTI Transactions On Electrical Eng., Electronics, and Communications”,vol. 8, pp. 43-52, 2010. [13] D.K. Kumar, N.D. Pah and A. Bradley,
“Wavelet analysis of surface electromyography to determine muscle Fatigue”,IEEE Trans Neural Syst Rehabil Eng.,Vol. 11, pp. 400-406, 2003.
[14] L. Cohen, “Time-Frequency Analysis”. Englewood Cliffs, NJ: Prentice-Hall, 1995 [15] P.W. Mark,“Wavelet-based noise removal for
biomechanical signals: A comparative study”,
IEEE Trans. on biomedical engineering,vol. 47, pp. 360-360,2000.