http://dx.doi.org/10.4236/anp.2013.24040
The Structure of Modified Fe-Ni Bioxide Composite
Nanoparticles Using Fe(NO3)3
Yueqiang Lin1, Jian Li1*, Lihua Lin1, Xiaodong Liu1, Longlong Chen1, Decai Li2
1School of Physical Science & Technology, Southwest University, Chongqing, China 2School of Mechanical and Control Engineering, Beijing Jiaotong University, Beijing, China
Email: *[email protected]
Received June 27, 2013; revised August 26, 2013; accepted September 11, 2013
Copyright © 2013 Yueqiang Lin et al. This is an open access article distributed under the Creative Commons Attribution License, which permits unrestricted use, distribution, and reproduction in any medium, provided the original work is properly cited.
ABSTRACT
Composite nanoparticles containing a γ-Fe2O3 core, Ni2O3 external shell and FeCl3·6H2O outermost layer can be syn-thesized by chemically induced transition in FeCl2 solution. These may be modified by treatment with Fe(NO3)3 to ob-tain particles for the preparation of ionic ferrofluids. Vibrating sample magnetometer (VSM) measurements and trans-mission electron microscopy (TEM) observations show that after Fe(NO3)3 treatment, the specific magnetization be-comes weaker and the size bebe-comes larger for treated particles compared with the untreated particles. Using energy dispersive X-ray spectroscopy (EDX), X-ray diffraction (XRD) and X-ray photoelectron spectroscopy (XPS), the structure of the particles before and after the treatment is revealed. The experimental results show that the γ-Fe2O3 core is unchanged, the Ni2O3 is dissolved partially and the FeCl3·6H2O is replaced by Fe(NO3)3·9H2O. The percentages of molar, mass and volume of these phases are deduced, and the average density of the modified particles is also esti-mated.
Keywords: Nanoparticles; Composite; Treatment; Characterization
1. Introduction
Magnetic nanoparticles are an important class of nano- scopic magnetic systems. The preparation and charac- terization of magnetic nanoparticles have attracted in- creasing interest as particles in this size range may allow investigation of fundamental aspects of magnetic-order- ing phenomena in magnetic materials with reduced di- mension and could lead to new technological applica- tions [1,2]. A nanocomposite is a material composed of two or more phases in which the combination of different physical or chemical properties may lead to completely novel materials [3]. In addition, magnetic nanocompo- sites have applications that range from ferrofluids to separation science and technology [4].
Ferrofluids (magnetic fluids) can be synthesized by dispersing nanosized subdomain magnetic particles of ~10 nm in diameter in a carrier liquid. Generally, mag- netic nanoparticles in ferrofluids are coated with a sur- factant to prevent aggregation [5]. In the 1980s, Massart proposed a method for chemical synthesis of ferrofluids with no surfactant [6]. This method has subsequently
been called the Massart’s method and such ferrofluids are known as ionic ferrofluids or electrical double-lay- ered ferrofluids [7,8]. In an adaptation of Massart’s method for the synthesis of the ferrofluids, magnetic nanoparticles need to be treated with ferric nitrate to yield a chemically stable particle surface.
Magnetization (moment per unit volume) M is an im- portant physical parameter used to characterize magnetic materials. In practice, the volume of a particle Vp is too difficult to measure directly, so the magnetization is ob- tained usually from M =·ρ, where is the specific magnetization (moment per unit mass) and ρ is the known density of the constituent materials [9]. In addi- tion, the volume fraction of particles in ferrofluids, ϕv = Vp/(Vp + Vc), where Vp is the volume of the particles and Vc is the volume of the carrier liquid, is also an im- portant characteristic parameter to which the behavior of ferrofluids is related [10]. Therefore, volume of the par- ticles is an important feature for magnetic nanoparticles and is generally obtained from an accurate measure of the mass m and the known density ρ, i.e. Vp = m/ρ. However, if the nanoparticles consist of different chemi- cal compounds, the density of the particles is no longer
uniform, and their volume cannot be determined by measuring just their mass.
Recently, we have proposed a method to prepare Fe-Ni bioxide composite nanoparticles by a chemically induced transition [11]. These nanoparticles might be very suit- able for the synthesis of ionic ferrofluids [12]. In the present work, untreated Fe-Ni bioxide composite nano- particles and those treated with ferric nitrate have been characterized, and their chemical compositions and av- erage density were studied.
2. Experimental
The γ-Fe2O3/Ni2O3 composite nanoparticles were pre- pared by the so-called chemically induced transition method. The preparation can be divided into two steps. Firstly, an aqueous mixture of FeCl3 (40 ml, 1 M) and Ni(NO3)3 (10 ml, 2 M; in HCl 0.05 ml) was added to NaOH solution (500 ml, 0.7 M). Then the solution was heated and boiled for 5 min, after which the black pre- cursor gradually precipitated. Secondly, the precursor was added to FeCl2 solution (400 ml, 0.25 M), which was then heated to boiling point for 30 min. The nanoparti- cles were again precipitated after the heating had stopped. After washing to pH = 7 with very dilute aqueous HNO3 solution (≤0.01 M), the as-prepared particles (the un- treated particles) were added to boiling Fe(NO3)3 solu- tion (400 ml, 0.25 M), which was then kept boiling for 30 min. The particles were then dehydrated with acetone and allowed to dry naturally to yield the modified parti- cles (the treated particles).
The magnetization, morphology, bulk chemical spe- cies, crystal structure and surface chemical compositions of the particles were investigated using a vibrating sam- ple magnetometer (VSM, HH-15), transmission electron microscopy (TEM, TecnaiG220), energy dispersive X- ray spectroscopy (EDX, Quanta-200), X-ray diffraction (XRD, XD-12) and X-ray photoelectron spectroscopy (XPS, SAM800). The phase structures of the particles were determined from the experimental results.
3. Results and Analysis
The specific magnetization curves are shown in Figure 1.
Clearly, the magnetization of the treated particles is weaker than that of the untreated particles. From the plots of vs. 1/H in high field [13] the specific satura- tion magnetizations s are evaluated as 56.59 emu/g and 41.19 emu/g for the untreated and treated particles, re- spectively.
TEM observations show that both untreated and treated particles were spherical. Figure 2 is a typical
TEM micrograph of the particles. Statistical analysis reveals that the size of the particles fits a log-normal dis- tribution. For the untreated particles, the median diameter
0.0 2.5 5.0 7.5
0 20 40 60
10.0 (b)
(a)
(em
u
/g
)
[image:2.595.319.526.85.242.2]H(kOe)
Figure 1. The specific magnetization curves of (a) untreated particles and (b) treated particles.
[image:2.595.316.531.280.709.2]dg is 10.78 nm and the standard deviation lng is 0.27; for the treated particles, dg is 11.43 nm and lng is 0.26. The average diameter <d> is calculated from <d> = exp [lndg + 0.5ln2
g] [14] and gives.11.18 nm for the un- treated particles, and 11.82 nm for the treated particles.
The results of the EDX measurements indicated that both untreated and treated particles had O, Fe and Ni species, but the untreated particles also contained Cl and the treated particles contained N and Cl. The atomic per- centages ai for these elements are listed in Table 1.
Figure 3 shows the XRD patterns for the two
nanoparticles. For the untreated particles, the major dif- fraction peaks corresponded to γ-Fe2O3 (magnetite, PDF# 39-1346), with some weaker peaks corresponding to Ni2O3 (PDF#14-0481). No clear diffraction peaks corre- sponded to any phase based on the Cl species. In addition, for the treated particles, diffraction peaks were present for both γ-Fe2O3 and Ni2O3. However, by comparing with the pattern of untreated particles, it was found that the diffraction intensity of Ni2O3 had been weakened relative to that of γ-Fe2O3. In addition, some new diffraction peaks appeared, as indicated by arrows A, B, C and D. These are close to the d=0.2620, 0.2550, 0.1900 and 0.1700 nm peaks of Fe(NO3)3·9H2O (PDF#01-0124).
Figure 3. XRD patterns of (a) untreated particles and (b) treated particles. The peaks (h k l) correspond to γ-Fe2O3
(PDF#39-1346) and peaks (h k l)* correspond to Ni2O3
[image:3.595.317.529.247.457.2](PDF#14-0481).
Table 1. The atomic composition from EDX measurement ai.
i O Fe Ni Cl N
Untreated particles 56.82 39.15 2.37 1.66
Treated particles 60.33 35.60 1.57 2.50
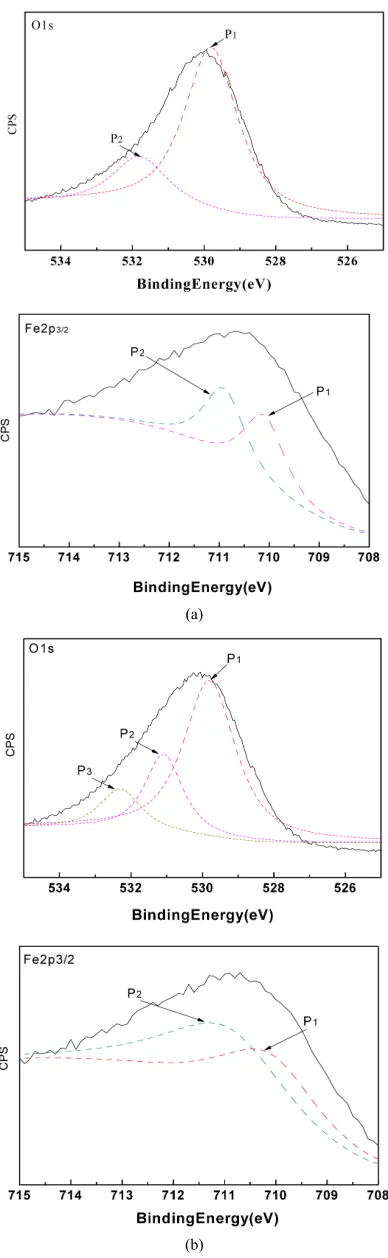
The XPS spectra are shown in Figure 4. These con-
firm the presence of the same chemical species as deter- mined by the EDX measurements. Combining the EDX and XRD results, it was apparent that besides γ-Fe2O3 and Ni2O3, there was also a phase based on Cl in the un- treated particles and Fe(NO3)3·9H2O was present in the treated particles. As a result, the O1s and Fe2p3/2 lines are split, as shown in Figure 5. The detailed binding en-
ergy data are listed in Table 2. To summarize, these
measurements precisely identify γ-Fe2O3, Ni2O3 and FeCl3 phases in the untreated particles and γ-Fe2O3, Ni2O3 and Fe(NO3)3·9H2O phases in treated particles. In the untreated particles, the FeCl3 phase could contain
Figure 4. XPS spectra of (a) untreated particles and (b) treated particles.
Table 2. The binding energy data from XPS measurements (eV).
O1s Fe2p3/2 Ni2p3/2 Cl2p
Untreated
particles 529.8P1 531.8P2 710.2P1 711.0P2 854.9 198.1
γ-Fe2O3 529.8 710.9
Ni2O3 531.8 855.6
FeCl3 711.0 198.0
O1s Fe2p3/2 Ni2p3/2 N1s
Treated
particles 529.8 P1 531.1P2 532.3P3 710.4P1 711.3P2 854.8 406.3
γ-Fe2O3 529.8 710.9
Ni2O3 531.8 855.6
Fe(NO3)3 532.93 710.09 406.7
Note: The standard data for γ-Fe2O3, Ni2O3, FeCl3 are taken from the Hand-
book of X-ray photoelectron spectroscopy. Data for Fe(NO3)3·9H2O are
[image:3.595.65.279.384.600.2] [image:3.595.59.285.687.736.2](a)
[image:4.595.75.269.82.711.2](b)
Figure 5. XPS results of O1s lines and Fe Fe2p3/2 lines for (a)
untreated particles and (b) treated particles.
water of crystallization, as in FeCl3·6·H2O, since this compound is formed on the γ-Fe2O3 cores, when these are synthesized by a similar, chemically induced transi- tion method in FeCl2 solution [15].
4. Discussion
4.1. The Structure of the Particles
The experimental results and analysis above reveal that both untreated and treated particles are spherical nano- particles with sizes of the order of 10 nm. The untreated particles consist of γ-Fe2O3, Ni2O3 and FeCl3·6H2O phases. There must be very little FeCl3·6H2O since there were no clear corresponding diffraction peaks in the XRD pattern. In addition, in the treated particles, Fe(NO3)3·9H2O is present as well as the γ-Fe2O3 and Ni2O3 phases, but no FeCl3·6H2O. Comparing with the untreated particles, the proportion of Ni2O3 is lower in the treated particles. We conclude that during the treat- ment, FeCl3·6H2O and some Ni2O3 are dissolved and Fe(NO3)3·9H2O is formed instead. As a consequence, it appears that the untreated nanoparticles consist of a
γ-Fe2O3 core, Ni2O3 external shell and FeCl3·6H2O out-ermost layer; the treated particles have the same core and external shell, but Fe(NO3)3·9H2O outermost layer. A schematic structural diagram of the particles is presented in Figure 6. It appears that the γ-Fe2O3 core remains un- changed when the particles are treated in Fe(NO3)3 solu- tion.
4.2. The Molar Percentages of the Phases in the Particles
The structural data and the quantitative elemental analy- sis from the EDX measurements provide a description of the molar ratios of the phases for both particles, as fol- lows.
For the untreated particles, based on γ-Fe2O3, Ni2O3 and FeCl3·6H2O phases, the molar ratio between the
γ-Fe2O3 and Ni2O3 phases, yNi, can be written as
2 3
Cl FeNi
Ni Cl
Ni 2 3
Fe O mol 1
3 Ni O mol
y a a
y
a a y
(1)
where aFe, aNi and aCl are the atomic percentages of Fe, Ni and Cl, respectively. Likewise, the ratio between the
-Fe2O3
Ni2O3
FeCl3·6H2O
-Fe2O3
Ni2O3
Fe(NO3)3·9H2O
Fe(NO3)3
Treatment
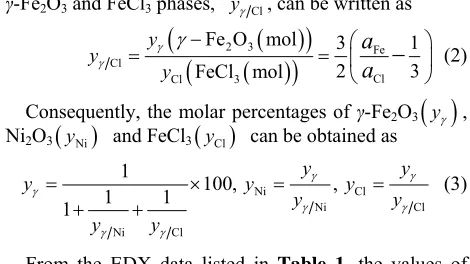
[image:4.595.310.536.643.719.2]γ-Fe2O3 and FeCl3 phases, yCl, can be written as
2 3
FeCl
Cl
Cl 3
Fe O mol 3 1
2 3 FeCl mol y y y
a
a
(2)Consequently, the molar percentages of γ-Fe2O3
y ,Ni2O3
yNi and FeCl3
yCl
can be obtained asNi Cl
Ni Cl
Ni Cl
1 100, ,
1 1 1 y y y y y y y y
y (3)
From the EDX data listed in Table 1, the values of
y, Ni and can be calculated and these are given in Table 3.
y yCl
For the treated particles based on γ-Fe2O3, Ni2O3 and Fe(NO3)3·9H2O phases, y Ni, can be written as
2 3
N FeNi
Ni N
Ni 2 3
Fe O mol 1
3 Ni O mol
y a a
y a a y
(4)
where aFe, aNi and aN are the atomic percentages of Fe, Ni and N, respectively. Likewise, the ratio between
γ-Fe2O3 and Fe(NO3)3 phases, yN, can be written as
2 3
FeN
N
N 3
Fe O mol 3
2 3 FeCl mol y y y a a 1
(5)
Thus, the molar percentages of γ-Fe2O3
y ,Ni2O3
yNi
and Fe(NO3)3
yN for the treated particles,can be obtained from
N
Ni N
Ni
Ni N
1 100, ,
1 1 1 y y y y y y y
y y
y
(6)
The values of y, Ni and N can be calculated from the data listed in Table 1, and are also listed in Ta- ble 3. Clearly, the
y y
Ni
y value of the treated particles (91.48/4.17) is larger than that of the untreated particles (91.74/5.63), which confirms the reduction of the Ni2O3 phase after the treatment, since the molar concentrations of γ-Fe2O3 in both untreated and treated particles can be regarded as equal.
4.3. The Mass Percentages of the Phases in the Particles
From the molar percentage of each phase, the mass per- centages of the phases in both untreated and treated par- ticles, zi, can be deduced from
100 i i i i i y A z y A
(7)where yi is the molar percentage and Ai is molecular
[image:5.595.54.289.90.222.2]weight of the i phase in the particles. Accordingly, the mass percentage of each phase for the two particles can
Table 3. The molar percentage of each phases in the un-treated and un-treated particles yi.
i γ-Fe2O3 Ni2O3 FeCl3 Fe(NO3)3
Untreated particles 91.74 5.63 2.63
treated particles 91.48 4.14 4.38
be obtained from the results listed in Table 3 and the
molecular weights of γ-Fe2O3, Ni2O3, FeCl3·6H2O or Fe(NO3)3·9H2O, which are listed in Table 4.
From the results in Table 4, it can be seen that the
mass fractions of both γ-Fe2O3 and Ni2O3 in the treated particles are less than in the untreated particles. There- fore, the specific magnetization of the former is weaker than that of the latter, since γ-Fe2O3 is ferrimagnetic, Ni2O3 is weakly ferromagnetic [16], and both FeCl3 and Fe(NO3)3 are paramagnetic.
4.4. The Volume Percentages of the Phases in the Particles
From the mass percentage zi, the volume percentage of
each phase in the particle system, ϕi, can be obtained
from 100 i i i i i z z
(8)where ϕi is the density of the i phase. The densities of γ-Fe2O3, Ni2O3, FeCl3·6H2O and Fe(NO3)3·9H2O are 4.90, 5.32, 1.844 and 1.684g/cm3, respectively. Thus, from the zivalues listed in Table 4, the values of ϕi can
be calculated, and are listed in Table 5. For the treated
particles, the volume of the γ-Fe2O3 phase should be same as for the untreated ones. The fact that the volume percentage of γ-Fe2O3 phase for the treated particles is less than that for the untreated particles shows that the size of the former is larger than that of the latter. This is in agreement with the TEM results.
4.5. The Density of the Particles
From both mass percentages and densities of each phase, the average density of the particles containing many phases, <ρ>, can be obtained from
1 100 100 i i i i z
(9) Using Formula (9), the average density can be esti- mated as 4.596 g/cm3 and 4.102 g/cm3 for the untreated and treated particles, respectively. For the treated parti- cles, the density 4.102 g/cm3 is very close to 4.125 g/cm3, which was deduced from density measurements of the corresponding ferrofluids [12]. [image:5.595.307.537.111.164.2]M(=iρi) vs. H can be obtained from the specific mag- netization, as shown in Figure 7. The values of satura-
tion magnetization Ms(=s·<ρ>) were obtained from s as 260.09 and 168.96 kA/m for the untreated and treated particles, respectively.
5. Conclusion
[image:6.595.250.534.318.739.2]Using a chemically induced transition in FeCl2 solution, composite nanoparticles containing a γ-Fe2O3 core, Ni2O3 shell and FeCl3·6H2O outermost layer, were syn- thesized. The Fe(NO3)3 solution treatment after synthesis dissolves FeCl3 and some of the Ni2O3 to give a new Fe(NO3)3·9H2O layer on the undissolved part of the nanoparticles. This shows that during the Fe(NO3)3 treatment, it is easily absorbed on the ferrite particles to form a Fe(NO3)3·9H2O surface layer, a result similar to Fe3O4 when treated with Fe(NO3)3 [17,18]. For the com- posite nanoparticles with many phases, combining bulk with surface analysis using EDX, XRD and XPS reveals their structure and the molar, mass and volume percent- ages of each phase can be calculated. As a consequence,
Table 4. The mass percentage of each phases in the un-treated and un-treated particles zi.
i γ-Fe2O3 Ni2O3 FeCl3·6H2O Fe(NO3)3·9H2O
Untreated particles 90.01 5.72 4.27
[image:6.595.58.286.383.438.2]Treated particles 85.62 4.01 10.73
Table 5. The percentage volume of each phases in the un- treated and treated particles ϕi.
i γ-Fe2O3 Ni2O3 FeClO 3·6H2Fe(NOO 3)3·9H2
Untreated particles 84.42 4.94 10.64
Treated particles 71.67 3.09 25.24
0.0 2.5 5.0 7.5 10.0
0 50 100 150 200 250
(b) (a)
M(
kA/
m
)
H(kOe)
Figure 7. The magnetization curves of (a) untreated parti- cles and (b) treated particles.
the difference of both magnetization and size between the treated and untreated particles can be explained from the phase ratios. In addition, the average density of the particles can be obtained, which is very important for the synthesis of ferrofluids with accurate volume fractions of particles. The experiments indicated that after treatment with Fe(NO3)3, although the γ-Fe2O3 core is unchanged, the magnetization of the treated particles becomes much weaker than that of the untreated particles. Clearly, this is evidence showing that the surfaces of magnetic nanopar- ticles play an important role in determining their mag- netization behavior.
6. Acknowledgements
Financial support for this work was provided by the Na- ture Science Foundation of China (11074205)
REFERENCES
[1] J. Nogués, J. Sort, V. Langlais, V. Skumryev, S. Suriñach, J. S. Muñoz, et al., “Exchange Bias in Nanostructures,”
Physics Reports-Review Section of Physics Letters, Vol. 422, No. 3, 2005, pp. 65-117.
[2] M. Knobel, W. C. Nunes, L. M. Socolovsky, E. De Biasi, J. M. Vargas and J. C. Denardin, “Superparamagnetism and Other Magnetic Features in Granular Materials: A Review on Ideal and Real Systems,” Journal of Nano- science and Nanotechnology, Vol. 8, No. 6, 2008, pp. 2836-2857.
[3] D. V. Szabó and D. Vollath, “Nanocomposites from Coated Nanoparticles,” Advanced Materials, Vol. 11, No. 15, 1999, pp. 1313-1316.
http://dx.doi.org/10.1002/(SICI)1521-4095(199910)11:15 <1313::AID-ADMA1313>3.0.CO;2-2
[4] Q. X. Liu, Z. H. Xu, J. A. Finch and R. Egerton, “A Novel Two-Step Silica-Coating Process for Engineering Magnetic Nanocomposites,” Chemistry of Materials, Vol. 10, No. 12, 1998, pp. 3936-3940.
http://dx.doi.org/10.1021/cm980370a
[5] R. E. Rosensweig, “Ferrohydrodynamic,” Cambrige Uni- versity, Combridge, 1985.
[6] R. Massart, “Preparation of Aqueous Magnetic Liquids in Alkaline and Acidic Media,” IEEE Transactions on Magnetics, Vol. 17, No. 2, 1981, pp. 1247-1248.
http://dx.doi.org/10.1109/TMAG.1981.1061188
[7] F. A. Tourinho, R. Franck and R. Massart, “Aqueous Ferrofluids Based on Manganese and Cobalt Ferrites,”
Journal of Materials Science, Vol. 25, No. 7, 1990, pp. 3249-3254. http://dx.doi.org/10.1007/BF00587682 [8] M. H. Sousa, F. A. Tourinho, J. Depeyrot, G. J. da Silva
and M. C. F. Lara, “New Electric Double-Layered Mag- netic Fluids Based on Copper, Nickel, and Zinc Ferrite Nanostructures,” The Journal of Physical Chemistry B, Vol. 105, No. 6, 2001, pp. 1168-1175.
http://dx.doi.org/10.1021/jp0039161
[image:6.595.56.288.472.707.2][10] B. Huke and M. Lücke, “Magnetic Properties of Colloidal Suspensions of Interacting Magnetic Particles,” Reports on Progress in Physics, Vol. 67, No. 10, 2004, pp. 1731- 1768. http://dx.doi.org/10.1088/0034-4885/67/10/R01 [11] Q. M. Zhang, J. Li, Y. Q. Lin, X. D. Liu and H. Miao,
“The Preparation and Characterization of Ni-Fe Bioxide Composite Nanoparticles,” Journal of Alloys and Com- pounds, Vol. 508, No. 2, 2010, pp. 396-399.
http://dx.doi.org/10.1016/j.jallcom.2010.08.065
[12] L. H. Lin, J. Li, J. Fu, Y. Q. Lin and X. D. Liu, “Preparation, Magnetization, and Microstructure of Ionic Ferrofluids Based on Gamma-Fe2O3/Ni2O3 Composite Nanoparticles,” Materials Chemistry and Physics, Vol. 134, No. 1, 2012, pp. 407-411.
http://dx.doi.org/10.1016/j.matchemphys.2012.03.009 [13] R. Arulmurugan, G. Vaidyanathan, S. Sendhilnathan and
B. Jeyadevan, “Co-Zn Ferrite Nanoparticles for Ferrofluid Preparation: Study on Magnetic Properties,” Physica B- Condensed Matter, Vol. 363, No. 1-4, 2005, pp. 225-231. http://dx.doi.org/10.1016/j.physb.2005.03.025
[14] C. G. Granqvist and R. A. Buhrman, “Ultrafine Metal
Particles,” Journal of Applied Physics, Vol. 47, No. 5, 1976, pp. 2200-2219. http://dx.doi.org/10.1063/1.322870 [15] L. L. Chen, J. Li, Y. Q. Lin, X. D. Liu, L. H. Lin and D.
C. Li, “Surface Modification and Characterization of γ- Fe2O3 Nanoparticles Synthesized by Chemically-Induced Transition,” Materials Chemistry and Physics, Vol. 141, No. 2-3, 2013, pp. 828-834.
[16] Q. M. Zhang, J. Li, H. Miao and J. Fu, “Preparation of Gamma-Fe2O3/Ni2O3/FeCl3(FeCl2) Composite Nanopar- ticles by Hydrothermal Process Useful for Ferrofluids,”
Smart Materials Research, Vol. 2011, 2011, Article ID: 351072. http://dx.doi.org/10.1155/2011/351072
[17] A. R. Wang, J. Li and Y. Wang, “Analysis of Fe3O4 Nanoparticles Treated with Fe(NO3)3,” Journal of Ins-
trumental Analysis, Vol. 25, No. 6, 2006, pp. 35-38. (in Chinese)
[18] J. Li, X. Y. Qiu, Y. Q. Lin, X. D. Liu, R. L. Gao and A. R. Wang, “A Study of Modified Fe3O4 Nanoparticles for the Synthesis of Ionic Ferrofluids,” Applied Surface Science, Vol. 256, No. 23, 2010, pp. 6977-6981.