© 2016, IRJET ISO 9001:2008 Certified Journal Page 793
A MOPSO based-Multi Objective Fault Indicator Positioning Method in
Distribution System
Rajesh Kumar 1, D.Ravichandran
2, Neelesh Pandey
31
B.Tech, M.Tech, SRMUniversity Chennai-603203 Tamil Nadu
2Assistant professor SRM university Chennai tamilnadu
3B.Tech, M.Tech, SRMUniversity Chennai-603203 Tamil Nadu
---***---Abstract -In this paper a multi-objective fault indicator
(FI) positioning method in electric distribution systems. The novel FI placement problem formulation is enhanced by considering effects of existing protection and active control devices(relay) on customers’ restoration time. After that the customer average restoration time index is developed, as a novel approach objective function with respect to uncertainties of auto switching. After that a multi-objective solution approach is done to minimize essential techno-economic objectives. The resultant optimization problem is done by a MOPSO based algorithm and GA. Assuming SAIDI and CARTI as technical objective function for reliability improvement.
Key Words-distribution automation system, fault
indicator placement, reliability test system, multi objective particle swarm optimization(MOPSO), outage management system, genetic algorithm.
1.INTRODUCTION
Most of the researches presented so far in the field of fault position are focused on the fault location on the distribution system. FI Series Fault Indicator are used to faster locate the fault in distribution systems by indicating the path of fault current, help the crews to trace the path of fault current and to locate the fault more efficiently, greatly reduce the time and cost of fault location, and enhance the reliability of power supply. Sectionalizing switches are used in primary distribution systems for various applications such as, to improve reliability, customer average restoration time index(CARTI) to isolate a fault, for configuration management, and to re-configure the network [9]. It is important to develop a fault locator which can locate all type of faults immediately after fault occurrence in a power system with high accuracy, so that long hours of power outage, loss of life, damage to equipment and property, stoppage of industry and decline of economy resulting from long hours of power failure can be avoided or minimized. By efficient fault location, power becomes cheap, safe, efficient, neat, clean and reliable. This paper reviews the fault indicator applications distribution systems. The costs associated with installation of the FI.
however, quite significant [2]. There is a growing concern in power utilities regarding a quantitative justification of the increase in reliability due to the placement of FI rather than one simply based on reduced interruption times.
FI cost minimization can be obtained through improved operational practices and using efficient planning techniques which can determine the minimum number of FIs and their optimum locations. The selection of an adequate number of fault indicator and their locations are a complicated task in distribution system planning [7] [13]. Utilities use their past experience, customer interruption data and other considerations in selecting a suitable number of FIprovides four rules to locate protective relay in order to improve reliability. The reliability index used in the average number of minutes per customer year (SAID) . MOPSO (multi objective particle swarm optimization) and genetic algorithms are used in [15] to determine FI cost device. A genetic based algorithm is employed in [8] to determine the optimal positions of FIs in an actual distribution network. While a mid-point re closer is located in the studied network, no existing switches are considered. Moreover, the candidate locations of FIs are limited to the main branches. In [11], the immune algorithm (IA) is adopted to solve the optimal FIs placement and conducted on relatively large distribution network. However, modeling of FIs and their interactions with the available control devices are not described. In [1] and [16], an economic based FIs placement via genetic algorithm is investigated with considering dispersed generation insertion. Nevertheless, neither technical objective function nor reliability evaluations are reported. In addition to these studies, several efforts are devoted to solve the FI placement problem in literature [13] [7]. As discussed, the available remote protection and control devices are rarely
© 2016, IRJET ISO 9001:2008 Certified Journal Page 794 aforementioned
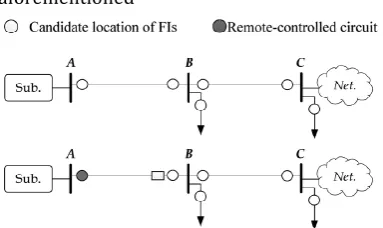
fig. 1 Candidate location with simple network.
research. Therefore, the interactions between the FI placement problem and probabilities of possible control sequences are rarely referred up to now. Moreover, a multi-objective techno-economical approach is not yet applied to this problem. In this paper, a multi-objective FI placement model is proposed as an effective access to accelerate the fault location function of the FLISR process. As the first contribution of this paper, prevalent FI placement problem formulation is extended by incorporating the available protection and control devices with respect to operation uncertainties under contingencies. To such aim, the customers’ average restoration time index(CARTI) is formulated and applied to the problem. As the second contribution of this paper, a multi-objective solution approach is employed via a particle swarm optimization (PSO)based algorithm, to simultaneously minimize the indispensable economic and technical objective functions. In addition, the impact of network topology changes due to feeder reconfigurations on the FI placement problem is investigated with bus number four of the Roy Billiton test system (RBTS4). This is followed by presenting the results and comparing them to those of prior research.
2. PURPOSED METHOD
The security and reliability and service continuity of power distribution system is very important, but it is violating with occurring faults. Fast clearing and isolation of different faults types are critical in maintaining a reliable power system operation and improve service continuity indexes. The proposed method presents a new optimal FI allocation method through PSO and GA. In this method, anew combined economic objective function and technical objective are assumed which must be optimized. Suggestion objective function is combination of three main part of Fcapital, Eoutage, reliability with (CARTI). The aim of the optimal FI placement problem is to find a set of FI locations which simultaneously minimizes the objective
functions with respect to the following presumed installation rules [11], [12]:
• Feasible candidate locations for installing FIs include beginning of each lateral as well as both upstream and downstream of buses located at the main feeder, except normally open tie nodes [Fig.1].
• Remote-controlled switches (RCSs) and the RCCBs contain fault detection and related communication interface; thus it is neither necessary nor economical to install FIs in presence of these devices [Fig. 1]. Fig. 1 shows a whole set of candidate locations which satisfy the first installation rule. The second rule invokes to select the candidate locations in Fig. 1. As Fig. 1 show, the candidate locations are decreased in presence of remote control switch and RCCB (remote control circuit brecker); however, the manual switches possess no effects on the possible candidate locations.
3. PROBLEM FORMULATION
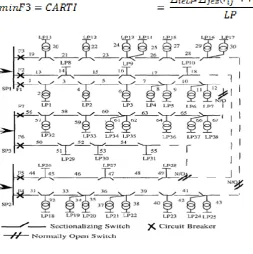
The radial distribution system [33] designated as Test System 4 shown in Figure 2 can be used to illustrate the problem of determining the required locations and the number of sectionalizing devices. The objective is to select the optimum number of FI devices to minimize the outage, investment and maintenance costs.There is two objective function.
3.1Economic objective function
The prevalent FI placement cost function includes investment and maintenance costs of FIs accumulated with customers’ interruptions costs within the planning horizon.
(2)
Eoutage= expected outage cost to customer.
© 2016, IRJET ISO 9001:2008 Certified Journal Page 795 (6) and (7). In (2), the annual expected outage costs
imposed by the customers located at each load point are calculated by considering all possible contingencies. different types of customer service priorities are met by assuming weighting coefficient through (13), (14). In order to incorporate the time value of money, is applied to (2), and calculated [14]. The second term of (1) considers total investment and maintenance costs of FIs and calculates via (3).
3.2 Technical objective function
1) As this paper investigates the FI placement via a multi-objective approach, SAIDI and CARTI are considered as the technical objectives. System Average Interruption Duration Index (SAIDI):it is determined by the dividing the sum of all customer interruption duration by the no. of customer served during the year.
2) Customers’ Average Restoration Time Index (CARTI):
[image:3.595.37.291.466.721.2]objectives F1 and F2 seem to have high homogeneity that may harm the multi-objective solution method. Hence, in order to efficiently investigate the effects of the multi-objective approach on FI placement, CARTI is introduced as a new objective function. In comparison with the prevalent system and customer reliability indices, it enables better incorporation of the direct effects of available protection and control devices as well as their accurate operation probabilities on the FI problem:
Fig. 2 RBTS BUS4
Customer restoration time varied based on the best possible restoration action, all classified into two categories.
Restoration time associated with automatic switching-
automatic switching
Restoration time is depending upon the automatic switching otherwise it is equal to manual switching time
• Restoration time associated with manual switching-
The restoration process is accomplished manually while either automatic switching fail. In such a case manual restoration time affected by the placed FIs is in (7).
= +
where
=manual switching
4. SOLUTION APPROACH
In this paper, the multi objective optimization technique is implemented by MOPSO. MOPSO is a population base optimization procedure. which is depend upon the social behavior of swarm for optimization of continuous non-linear function
Multi objective problem can be formulated as.
(10)
(11) (12) Where n is the no. of objective function, m is the no. of inequality constraints, p is the no. of equality constraints.
are boundaries of the ith variable?
In multi-objective of PSO, the particle finds the best location in their paths. If there is no single best solution, then particle consider the non- dominated solution.
Where is the velocity of the particle i at iteration t, is inertia weight, and are weighed constraint? The eq. (13) provide the explore ability to PSO.
© 2016, IRJET ISO 9001:2008 Certified Journal Page 796
5. EXPRIMENTAL RESULTS
FI positioning problem by the novel method the novel technique required a software. By providing economical and technical data then user can see the result.
To increase the effectiveness, the novel method problem solved through the Roy Billinton test system through two method.it include three supply, 7 feeders,38 load point and 4779 customers [6] [13], as figure shown in 2. three type of customer are considered in this study as same as [6] [12]. Also line length and failure rates taken from [6] line repairing rate set to 3 hours. We also assumed the RCSs (remote control switch), fuses, RTU, SCADA, communication interface and feeder protection relay are 0.985, 0.90, 0.98,0.98, 0.996 and 0.995 respectively [2]and auto switching time and manual switching times are set to 30s and 1 hours. Total installation cost of FI are assumed US₴100[11].
The planning horizon, inflation and interest rate considered 10 years,6%,7%. In this novel technique the first method is the capability of the proposed method considered economic objective function .it is also exploring the effects of available control device on the optimal FI location. In second method is done by multi-objective approach on FI placement problem to do with F1, SAIDI and CARTI. That obtained result with compered to those of the first method
FIRST METHOD
In this method it is solved through PSO which minimize the prevent cost function in (1) this problem solved through two different methods.
[image:4.595.303.566.100.185.2]Reason1) with available control. Reason 2) without available control.
TABLE I
Optimal no. and location of FI
No. feede
r Optimal location No. of
FI
FI cost kUS$
Reaso n 1
1 2U,8D,10U
21 21.312
2 11U,15U
3 22U,26U,27D,28U
4 32U,35D,37U.40D
5 43U,47D
6 51U,52U,54D
7 62U,63D,63D
Reaso n 2
1 2U,3U,4U,6U,9U,10U
2 11U,12U,14U
3 21U,22U,24U,25U,26U
4 31D,33U,33D,39U 30 31.01
2
5 44U,46U,48U,49U
6 51U,54D
7 56U,56D57U,61U,63D,65
U
Obtained result are reported in Table I. while the optimal associated for “reason1” and “reason 2” reach by 21FIs and 30FIs for reason 2 which is more than almost32%. Optimal value of objective function F1 is KUS$632.84 and 1023.31 for the reason1 and reason2 respectively.
Second method
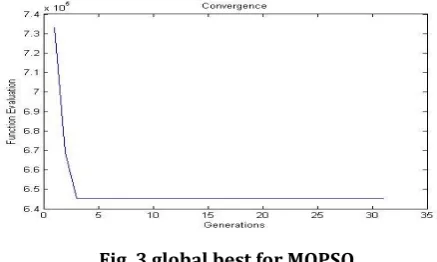
[image:4.595.319.538.457.588.2]In this method, a MOPSO based thing is applied to the FI location to minimize the cost function in (1) and technical objective (4) and (5). 33 FIs are selected which lead to US k$ 640.94, 0.34522 (hr./yr.) for and respectively. In comparison with Table I, while 13 FIs are located at the same location, 20 further FIs are added to the network. Reliability indices associated to this configuration is represented in Table IV; it can be seen that in contrast with the situation in which is minimized, the and are decreased by 0.3%, and 9.1%, respectively; however, the current solution has increased total installation cost by 33.3%. These results clearly illustrate that the proposed solution approach could find a proper compromised result for the FI problem in case of minimizing F1 and F2.
Fig. 3 global best for MOPSO.
© 2016, IRJET ISO 9001:2008 Certified Journal Page 797 summarizes the reliability indices can be used to compare
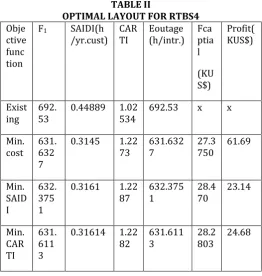
the single and multi-objectiveapproaches for FI placement. It shows that the highest reliability level is achieved by just minimizing SAIDI; however, this case may not be as economical as the others. On the other hand, the result obtained by MOPSO reveals that the multi-objective solution method can effectively compromise between reliability level and the economic issues.
TABLE II
OPTIMAL LAYOUT FOR RTBS4
Obje ctive func tion
F1 SAIDI(h
/yr.cust) CARTI Eoutage(h/intr.) Fcaptia l
(KU S$)
Profit( KUS$)
Exist
ing 692.53 0.44889 1.02534 692.53 x x
Min. cost 631.632
7
0.3145 1.22
73 631.6327 27.3750 61.69
Min. SAID I
632. 375 1
0.3161 1.22
87 632.3751 28.470 23.14
Min. CAR TI
631. 611 3
0.31614 1.22
[image:5.595.30.293.206.483.2]82 631.6113 28.2803 24.68
TABLE III
OPTIMAL NO AND LOCATION FOR SECOND METHOD
Reason Optimal FI location No.
of
FIs Fcaital (KUS$)
Min. F1 and CARTI
3D,5D,7U,10D,13U,15U,17U ,22D,26U,28D,28U,30U,33D ,33U,35U,36U,38D,40D,41U ,46D,48D,50U,53U,54U,58D ,59D,61U,63D,63U,65U
30 30.62
Min. F1 and SAIDI
5U,7U,10D,10U,15D,17U,21 D,26D,28U,33U,33D,38U,39 U,41U,48U,52U,53D,54U,58 D,60U,63U,65U
22 22.51
Min. F1 , SAIDI and CARTI
3D,5U,7U,10D,10U,15U,17U ,21D,25D,28U,30U,30D,33U ,36U,39U,41U,46U,50U,54D ,58U,59D,61U,63D,63U,65U
25 25.57
3. CONCLUSIONS
The FI placement problem was investigated through a multi objective approach solved via an MOPSO based algorithm. The prevalent FI placement problem formulation was extended by incorporating the available protection and control devices with respect to operation uncertainties under contingencies. Furthermore, the CARTI, as a new technical objective, was formulated in the problem. Effects of the existing control and protection devices on the FI problem were studied on different cases. Also, effects of possible distribution topology changes on FI placement problem were investigated. Finally, the
proposed methodology was implemented to a standard
test system (RBTS4), as well as Further research might be conducted to consider the effects of redundant FIs, and to find the optimal layout of FIs with respect to the limitations imposed by IT infrastructure. Moreover, the FI placement problem might be studied in presence of DGs considering both online and offline DG operations, as well as uni/bi-directional FIs
.
NOTATION
LP- Set the network load points LT- set of load types.
l,t,b- set of network (line, transformer,bus). C- set of candidate location.
. - set of manually restorable load points.
- set of none restorable load points.
Z- set of zones associated to the distributed FIs and RCSs. Constants:
n- planning year.
-average demand of load type z at load point j within year I (Kwh).
-failure rate of equipment k.
-cost of installing an FI in candidate location i$. -maintenance cost of ith FI at year j$.
-inflation, interest rate.
-average dead time before the crew reached to the outage area.
- average automatic/manual switching time(hr.)
REFERENCES
] Billinton, R., and Allan, R. N., "Reliability Evaluation of Power Systems", Pitman Books, New York and London, 1984.
© 2016, IRJET ISO 9001:2008 Certified Journal Page 798 algorithm,” IEEE Trans. Power Syst., vol. 26, no. 1, pp. 38–
45, Feb. 2011.
[5} D. Cong, B. Raison, and R. Jean-Pierre, “Optimal placement of fault indicators in distribution networks,” Int. Rev. Elect. Eng., vol. 1, no. 5, pp. 582–593, 2006.
[6] R. N. Allan, R. Billinton, I. SJarief, L. Goel, and K. So, “A reliability test system for educational purposes-basic distribution system data and results,” IEEE Trans. Power Syst., vol. 6, no. 2, pp. 813–820, May 1991.
[7] R. Billinton and S. Jonnavithula, “Optimal switching device placementin radial distribution system,” IEEE Trans. Power Del., vol. 11, no. 3, pp. 1646–1651, Jul. 1996. [8] C. Chen, C. Lin, H. Chuang, C. Li, M. Huang, and C. Huang, “Optimalplacement of line switches for distribution automation systems using immune algorithm,” IEEE Trans. Power Syst., vol. 21, no. 3, pp. 1209–1217, Aug. 2006. [9] A. Fereidunian, H. Lesani, and C. Lucas, “Distribution system reconfigurationusing pattern recognizer neural networks,” Int. J. Eng. (IJE). Trans. B: Applicat., vol. 15, no. 2, pp. 135–144, Jul. 2002.
[10] C. Chen, C. Lin, H. Chuang, C. Li, M. Huang, and C. Huang, “Optimalplacement of line switches for distribution automation systems using immune algorithm,” IEEE Trans. Power Syst., vol. 21, no. 3, pp.1209–1217, Aug. 2006. [11] R. BaradaranHendi, J. Seyed-Sheneva, and M. Gandomkar, “Electricaldistribution system reliability improvement by optimal placement of fault indicators using immune algorithm,” Int. J. Eng. Res. Applicat. (IJERA), vol. 2, no. 2, pp. 1383–1390, Mar.–Apr. 2012.
[12] C. Ying Ho, L. Tsung-En, and C. Hung Lin, “Optimal placement of fault indicators using the immune
algorithm,” IEEE Trans. Power Syst., vol. 26, no. 1, pp. 38– 45, Feb. 2011.
[13] D. Cong, B. Raison, and R. Jean-Pierre, “Optimal placement of fault indicators in distribution networks,” Int. Rev. Elect. Eng., vol. 1, no. 5, pp. 582–593, 2006.
[14] D. Newnan, T. Eschenbach, and J. Lavelle, Engineering Economic Analysis, 11th ed. New York, NY, USA: Oxford Univ. Press, Feb. 2011.
[15] N. C. Sahoo, S. Ganguly, and D. Das, “Multi-objective planning ofelectrical distribution systems incorporating sectionalizing switches and tie-lines using particle swarm optimization,” Swarm Evol. Computat., vol. 3, pp. 15–32, Apr. 2012.
BIOGRAPHIES
Mr. Rajesh kumar Received The B.Tech. Degree In Electrical And Electronic Engineering From The Rajasthan Technical university kota, Rajasthan,India. In 2009-13, He is pursuing The M.Tech In Power systems From The SRM University, Chennai, Tamil Nadu.
Mr. D.Ravichandran is currently working as Assistant Professor in the department of EEE at SRM University Chennai; he completed his B.E in 2009 at Anna university Chennai and M.Tech in 2013 at SRM University Chennai.