Full Length Research Article
ELECTROLESS CO-P COATED NANOCENOSPHERE /POLYMER/FILLER COMPOSITE FOR EMI
SHIELDING EFFECTIVENESS
*1
Vynatheya, S.,
2Raksha, G.,
2Madhusudhana, R.,
3Chandra Sagar, L. and
4Bheema Raju, V.
1
Materials Technology Division, Central Power Research Institute, Bengaluru-560 080, India.
2
Centre for Nanotechnology, National Institute of Engineering, Mysuru- 570 008, India.
3
Department of Mechanical Engineering, Dr. Ambedkar Institute of Technology, Bengaluru-560 056.
4
Department of Chemistry, RNS Institute of Technology, Bengaluru-560098.
ARTICLE INFO ABSTRACT
Due to the increasing development of many types of communication technologies, the unnecessary impacts of electromagnetic radiations on humans and electronic systems are increasing. Therefore it is very essential to decrease the Electromagnetic Interference (EMI) and its effect on humans, instruments and electronic devices. In the present study, Electroless Cobalt Phosphorous alloy (Co-P) Coated Nanocenosphere / polymer/filler Composites has been proposed for their EMI shielding Effectiveness. The Process involves making the polymer composite conductive by uniform dispersion of Co-P Coated Nanocenosphere (CPCNC) in the polymer matrix and to increase wave absorption by making the polymer-based composite sheet in the device resistant to EMI and hence increasing EMI shielding effectiveness. Here, EDX (Energy Dispersive X-Ray) examination confirmed the presence of Co andP on the coated Nanocenosphere as well as on the CPCNC incorporated composite sheet which was further proved by Phase investigation by XRD (X-Ray Diffractometer).Conductivity measurements showed that the composite with 30% CPCNC in ABS had good conductivity of 0.023S/m. Attempts were also made to increase conductivity by incorporating conducting nano fillers like Graphene and Multiwalled Carbon Nano Tubes (MWCNT) along with CPCNC in small percentages (up to 1%). The conductivity of the 10% Graphene / MWCNT added CPCNC (20%) in ABS polymer was measured to be 0.03S/m. There was improvement in EMI shielding effectiveness with addition of conducting filler.
Copyright©2017, George P. Gallah et al. This is an open access article distributed under the Creative Commons Attribution License, which permits unrestricted use, distribution, and reproduction in any medium, provided the original work is properly cited.
INTRODUCTION
Electro Magnetic Interference (EMI) is an important topic of interest in present times. As the technology is advancing, the importance to integrate large amount of electrical and electronic devices in various engineering fields such as automobiles, space, medical instruments etc. is of utmost need. To name a few, the system which includes communication systems, Control Area Networks mobile media and safety systems including wireless headsets, DC and AC motors, controllers and propellers. Placing large number of electrical and electronic systems into a very restricted space faces the problem of keeping the Electro Magnetic Interference (EMI) of these systems from interfering with each other.
*Corresponding author: Vynatheya, S.,
Materials Technology Division, Central Power Research Institute, Bengaluru-560 080, India.
EMI is a process by which a disturbing interference electromagnetic energy is transferred from one electronic device to another device via radiated or conducted paths, or sometimes both. In an electronic system, EMI can very badly affect the performance of an integrated circuit internally and also on the other electronic components which are in close proximity. The interference sources may be internal or external to the electrical or electronic system and they may propagate by radiation or conduction (John Noto, 2010). The word Cenosphere literally means spheres which are hollow in structure. A Cenosphere is a light weight, inert, hollow sphere which is typically made up of silica and alumina and hollow sphere is filled with air or inert gas, mainly produced as a by-product of coal combustion unit at thermal power plants. Cenosphere particles are hard and rigid in nature; they are also water repellant and insulative. Usually cenospheres have a size range from 1 to 300 microns with an average compressive strength of 3000 psi and their colors range from white to light
ISSN: 2230-9926
International Journal of Development Research
Vol. 07, Issue, 01, pp.10935-10941, January,2017
International Journal of
DEVELOPMENT RESEARCH
Article History:
Received 02nd October, 2016
Received in revised form 19th November, 2016
Accepted 21st December, 2016
Published online 30th January, 2017
Available online at http://www.journalijdr.com
Key Words:
Nanocenosphere,
grey. They are also called as microspheres, hollow spheres, micro balloons or glass beads, hollow ceramic microspheres. Cenospheres are very easy to handle and they easily flow and have a good surface area. Due to their inert properties, they are not affected by water, acids, alkalis (Elena, 2011)or solvents. There are many methods which are available to coat ceramics such as: Electroplating, Metal Spraying, Vacuum metalizing, hot dipping, Electroless plating etc. Among all these methods, Electroless plating method is considered to be more suitable for the present study involving fine particles, because the substrates are in the form of powder (Nanocenosphere) and the coating method provides a thin, homogenized (Sadhana, 2003), and controllable coating (Sundaramali, 2014).In the present study electroless alloy coated Cobalt-Phosphorous combination was successfully studied for EMI Shielding effectiveness (Pritom, 2016).
MATERIALS AND METHODS
Materials
Cenospheres, Cobaltous Sulphate, Sodium Hypophosphite, Sodium Acetate, Sulphuric Acid, Nitric Acid, Hydrochloric Acid, Stannous Chloride, Palladium Chloride, ABS (Acrylo-Nitrile Butadiene Styrene), PMMA (Poly methyl methacrylate), Acetone, Chloroform, Graphene and MWCNT.
Development of Nanocenosphere
Approximate 50 gm. of acid washed cenosphere powder was weighed and placed in high energy ball milling machine. This consists of zirconia jar with zirconia balls of different sizes, to this cenosphere along with 150ml of acetone was added, and was grounded for 50hrs with 300 rpm. Later the ground Cenosphere was dried in an oven at 1000C and subjected to Scanning Electron Microscopic (SEM) observation. The particle size range of ground cenosphere powder was found to be 100-200nm. Several batches of Nanocenosphere were prepared.
Pre-treatment of Nanocenospheres
About 50g of Nanocenosphere powder was washed for an hour with the solution of Sulphuric acid which is prepared by dissolving 5 ml of concentrated acid in 1 liter of water. After washing the solution was filtered using a fine membrane filter paper to recover the Nanocenosphere particles. Washing procedure was repeated several times to remove the acid. After final wash, the powder was dried in hot air oven at 90˚C.
Mechanism of Electroless Co-P coating
The process involves Sensitization of Nanocenosphere particles to create charge on the surface of Nanocenosphere particles, activation to create active sites on Nanocenosphere particle surface followed by Electroless coating process. The Eletroless Co-P coating bath consists of the following components: Cobaltous Sulphate is used as the source of cobalt while sodium hypophosphite is used as the reducing agent. Sodium acetate is added to obtain the adhesion between cobalt Phosphorous and Nanocenosphere. The bath is prepared by adding the constituents in the appropriate sequence. The pH of the solution is maintained within 7-8 by continuously monitoring it with the help of a pH meter (Sundaramali, 2014).
The bath composition and operating conditions for Co-P coating are shown below with detailed procedure.
Detailed Procedure
The prepared Nanocenosphere was transferred to sensitization bath compositions as shown below and is stirred continuously with a mechanical stirrer.
Sensitization bath: 50 gm. of Nanocenosphere in 5g/l SnCl2 and 30ml/l conc. HCl for 1 hr.
Filtration carried out by fine membrane filter and the residue obtained was thoroughly washed and then transferred to Activation bath.
Activation bath: 0.1g/l PdCl2, 5ml/l Conc. HNO3 and 25ml/l conc. HCl – 1hr.
Filtration was carried out using fine membrane filter and later on was washed with deionized water thoroughly and further it was transferred to Electroless plating bath.
Plating bath:
Cobaltous Sulphate- 20g/l, Sodium hypophosphite- 20g/l, Sodium Acetate- 35g/l
Temperature – 900C
Time – 3hr.
PH – 7-8.
Filtration using fine membrane filters and later on washed with deionized water.
Dried at 110oC in an oven.
During coating the constituents were continuously stirred to get uniform coating over fine particles.
Preparation of CPCNC /Polymer/Filler composite sheet
Preparation of CPCNC/PMMA composite sheet
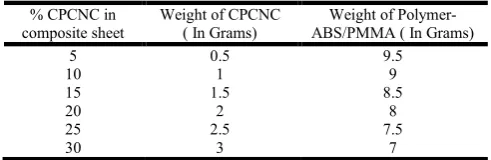
[image:2.595.310.556.600.680.2]Weighed percentage of PMMA was dissolved in Chloroform. After the complete dissolution of PMMA polymer, CPCNC was added to the solution and was stirred continuously for 1Hr followed by ultra-sonication in a high frequency sonicator for 30 minutes. The different weight percentage of the polymer and CPCNC are as shown in Table 1.
Table 1. Weight percentage list of CPCNC/ Polymer composite
% CPCNC in composite sheet
Weight of CPCNC ( In Grams)
Weight of Polymer-ABS/PMMA ( In Grams)
5 0.5 9.5
10 1 9
15 1.5 8.5
20 2 8
25 2.5 7.5
30 3 7
Preparation of CPCNC/ABS composite sheet
Weighed percentage of ABS polymer was dissolved in Acetone. After the complete dissolution of ABS, polymer, CPCNC was added to the solution and was stirred continuously for 1Hr followed ultra-sonication in a high frequency sonicator for 30 minutes. Different weight percentage of the polymer and the CPCNC is as shown in Table 1.
Preparation of CPCNC/Polymer/Filler composite sheet
Graphene/MWCNT (Multi Walled Carbon Nano Tube) was used as the filler materials along with CPCNC. Initially the Polymer was completely dissolved in the solvent followed by the addition of CPCNC along with filler materials viz: Graphene or MWCNT in different percentages ranging from 0.5 to 1.The different weight percentage used is as shown in Table2.
Characterization
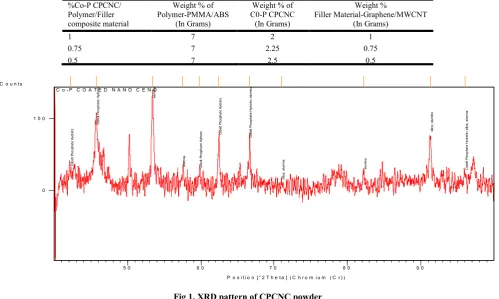
Phase analysis by XRD (X-Ray Diffraction): Phase analysis by XRD was carried out after the coating of powder. Fig 1 gives the XRD pattern of CPCNC. It can be seen that the coated powder is semi crystalline in nature with peaks pertaining to coated species Cobalt and Phosphorous along with those of Cenosphere base phases (Mullite and Quartz).
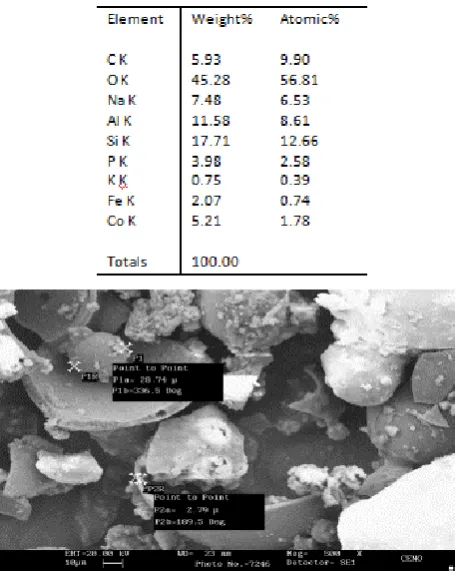
EDAX was carried out to know the chemical composition of the Nanocenosphere particles, after pressing it in the form of a pellet. The composition reveals the presence of Cenosphere constituents which is shown in Fig.2. Further, EDAX of CPCNC revealed the presence of elements Co and P on the surface of the pellet apart from those of the Cenosphere constituents which has been shown in fig. 3. Table 4 and 5 shows the chemical compositions of Nanocenosphere and CPCNC. Fig 4 shows the SEM morphology image of cenosphere with particle size ranging from 5 to 300 µm and Fig 5 shows the SEM image of Nanocenosphere.
Particles were found to be agglomerated as shown in Fig. 5 and the average particle size was measured to be around 100-200nm. Fig 6 represents the SEM image of CPCNC in which Co-P is uniformly distributed all over the surface of Cenosphere. However, due to extensive agglomeration the exact particle size could not be measured. The complete uniformity of Co-P on the surface was supported by EDAX analysis which is given in Fig 3.
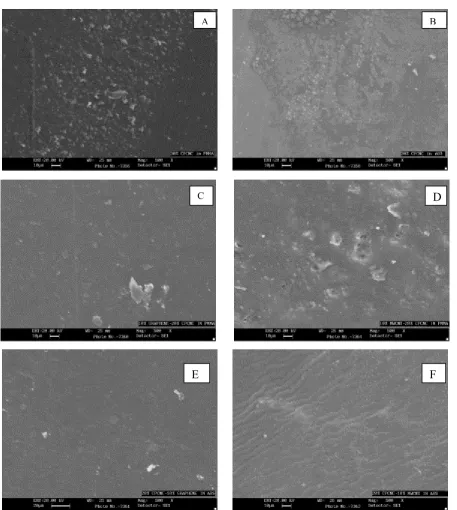
From the above figure we can observe that the distributions of the particles with and without filler are distributed over the respective polymer matrices. However, the uniformity is more in the case of particles in ABS polymer. From the above, it can be concluded that the composite sheet comprises of the phases of base material along with the coated alloy of Co-P. However, the sample is glassy as can be seen from the XRD spectrum which is the basic nature of the raw material on which coating has been carried out (Nanocenosphere).
Further, the peaks due to the coated phase (Co-P) are too small because the coating is in the Nano range. Further, it was also observed that the thickness of the composite as measured was found to be approximately 250 µm. BET Surface area of the nano cenospheres: The surface area of the nano powders before and after coating were measured using BET surface area analyser and the Multipoint Surface area was found to be 250m2/g. There was no appreciable difference in surface area before and after coating since the particle size remains almost same even after coating. After coating again the BET surface area was measured and found to be around 255m2/g.
Table 2. Weight percentage list of Co-P CPCNC/ Polymer/Filler composite
%Co-P CPCNC/ Polymer/Filler composite material
Weight % of Polymer-PMMA/ABS
(In Grams)
Weight % of C0-P CPCNC
(In Grams)
Weight %
Filler Material-Graphene/MWCNT (In Grams)
1 7 2 1
0.75 7 2.25 0.75
[image:3.595.51.551.293.592.2]0.5 7 2.5 0.5
[image:3.595.111.486.628.669.2]Fig 1. XRD pattern of CPCNC powder
Table 3. XRD pattern list of CPCNC powder sample
Ref. Code Score Compound Name Displacement [°2Th.] Scale Factor Chemical Formula
00-033-0432 20 Cobalt Phosphate 0.000 1.465 Co- P
00-033-1161 23 silica 0.000 0.902 Si O2
00-042-1468 64 alumina 0.000 0.603 Al2 O3
P o s i t i o n [ ° 2 T h e t a ] ( C h r o m i u m ( C r ) )
5 0 6 0 7 0 8 0 9 0
C o u n t s
0 1 0 0
C ob a lt Pho spha te H ydra te C ob a lt Pho spha te H ydra te a lumi na a lum ina C ob a lt Phospha te Hy dra
te Cob
a lt Pho sp ha te Hy dra te C ob a lt Pho spha te Hy dra te ; a lumi na si lic a ; a lumi na a lum ina si lic a ; a lum ina C ob a lt Pho sph a te H ydra te ; si lica ; al umi na
C o - P C O A T E D N A N O C E N O
Fig. 2. EDX spectrum of Nanocenosphere powder
Fig. 3. EDX spectrum of CPCNC powder
[image:4.595.44.279.186.317.2]Table 4. Chemical composition of NanoCenosphere
Table 5. Chemical composition of CPCNC
Fig. 4. SEM image of Cenosphere
[image:4.595.312.558.238.413.2]Fig. 5. SEM image of Nanocenosphere
Fig. 6. SEM image of CPCNC
Resistivity of the composite sheet after dispersion of CPCNC in the polymer matrix: The resistivity of the composite sheet was measured by four probe technique and it was ranging between 40 to 200 ohms at different wt% of CPCNC in polymer matrix and filler added CPCNC in polymer matrix. This low resistivity indicates that the composite sheet has reasonably good conductivity and suitable for lower range EMI shielding applications and the conductivity v/s wt% graph is as shown in the Fig. 9. The conductivity of composite sheets after incorporating the fillers (MWCNT and Graphene in percentages ranging from 5-10) with 20% CPCNC resulted in increased conductivity. Maximum conductivity was observed to be about 0.03 S/m for 10% Graphene / MWCNT along with 20% CPCNC. The total percentage of filler and CPCNC was restricted to 30% since beyond this percent the conductivity tends to decrease as can be seen from Fig. 9.
RESULTS AND DISCUSSIONS
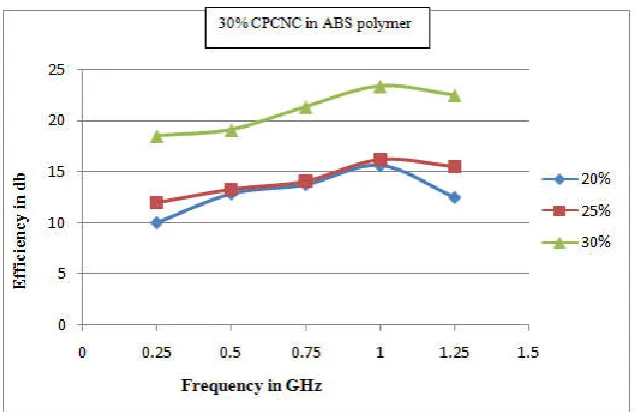
Electromagnetic shielding efficiency of CPCNC / polymer/ filler composite: The composite sheet was tested for shielding effectiveness property. The EMI study was conducted from 250MHz to 1.25 GHz frequency. The shielding effectiveness of about 23 db for 30wt% of CPCNC at 1GHz was obtained for composite with ABS polymer (Fig 10) and the same was slightly less for composite sheet with PMMA polymer (20 db at 1 GHz). The reason for this moderate shielding effectiveness may be attributed to higher resistivity of the composite sheet.
[image:4.595.49.277.498.784.2]A. 30% CPCNC IN PMMA, B. 30% CPCNC IN ABS, C. 20%CPCNC/10% GRAPHENE IN PMMA D. 20%CPCNC/10%MWCNT IN PMMA, E. 20%CPCNC/10% GRAPNENE IN ABS,
[image:5.595.73.531.50.561.2]F. 20%CPCNC/10%MWCNT IN ABS.
Fig. 7. SEM photographs of composite sheet samples AT 500X
Fig. 8. XRD spectrum of composite sheet sample
P o s i ti o n [° 2 T h e ta ] ( C h r o m i u m ( C r ) )
5 0 6 0 7 0 8 0 9 0
C o u n ts
0 1 0 0 2 0 0
C o - P C O M P S H E E T N A N O C E N O
A B
C
D
F
E
[image:5.595.100.496.601.791.2]Further, higher shielding effectiveness for composite with ABS polymer may be attributed to more uniform distribution of particles in the polymer matrix which has resulted in higher conductivity (Fig.10). The Resistivity was further lowered by addition of conductive Nano fillers (Graphene and MWCNT) which was having conductivity of about 0.03 S/m. This is due to the fact that the nano conductive fillers act as bridges between particles thereby improving connectivity and conductivity. The shielding effectiveness of filler added CPCNC polymer matrix was still higher and was observed to be about 30 db for MWCNT/Graphene added CPCNC in ABS polymer composite sheet. This higher Shielding effectiveness is attributed to the fact that the distribution of filler added CPCNC in ABS is more uniform (Fig.7 E and F).
Conclusions
Electroless method has been successfully adopted for coating Co-P alloy on Nanocenospheres particles which was observed through SEM, XRD and EDX.
The processing of particle distribution in ABS polymer matrix is quite uniform which has resulted in higher conductivity than that of PMMA polymer matrix.
Conductivity was found to be 0.03 S/m for 10% conductive filler with 20% CPCNC in ABS composite.
Shielding Effectiveness is found to be appreciable at 1GHz for filler added polymer composite (30 db.)
REFERENCES
John Noto, Gary Fenical and Colin Tong, 2010. “Automotive EMI Shielding-Controlling Automotive Electronic Emissions and Susceptibility with Proper EMI Suppression Methods”, April 1.
[image:6.595.39.552.96.302.2]Elena, V. Fomenko, Natalia N. Anshits, Marina V. Pankova, Leonid A. Solovyov and Alexander G. Anshits “ Fly Ash Cenospheres: Composition, Morphology, Structure and Helium Permeability”, World of Coal-Ash Conference, May 9-11, 2011in Denver, USA.
Table 6. XRD pattern list of CPCNC distributed over composite sheet
Pattern List: phases present in the composite sheet
Compound Name Displacement [°2Th.] Scale Factor Chemical Formula
Alumina 0.000 0.349 Al2 O3
Stishovite 0.000 0.560 Si O2
[image:6.595.138.457.334.540.2]Senegalite 0.000 4.421 Al2 ( P O4 ) ( O H )3 ! H2 O Cobalt Phosphorous 0.000 1.256 Co-P
Fig. 9. Measured conductivity versus CPCNC Weight per cent in polymer matrix
Fig. 10. Measured Shielding effectiveness for CPCNC/ABS matrix
Sadhana, 2003. “Electroless Alloy/Composite Coatings: A Review”, Vol. 28, Parts 3 and 4, June/August, pp. 475–493 Sundaramali, G., A.K. Jeevanandham, P.A. Jeeva and S.
Kartikeyan “Metallizationof Fly Ash particles using Electroless Cobalt plating process” International journal of
ChemTech Research, Vol-6, No.1 pp604-608 Jan-Mar
2014.
Pritom, J. Bora, K.J Vinoy, Praveen C Ramamurthy, Kishore and Giridhar Madras “Light Weight Poly-Aniline-Cobalt coated Fly Ash cenospheres composite film for Electro Magnetic Interference Shielding” Electron. Mater. Lett.
May 2016.