http://www.sciencepublishinggroup.com/j/earth doi: 10.11648/j.earth.20170602.12
ISSN: 2328-5974 (Print); ISSN: 2328-5982 (Online)
Spatial –Temporal Analysis of Drought in Iran Using SPI
During a Long - Term Period
Sohaila Javanmard
1, Mandana Emamhadi
1, Javad BodaghJamali
2, Ali Didehvarasl
11
Atmospheric Science and Meteorological Research Center (ASMERC), Tehran, I. R. of Iran 2
Environmental Engineering Faculty, University of Environment, Karaj, Iran
Email address:
[email protected] (S. Javanmard)
To cite this article:
Sohaila Javanmard, Mandana Emamhadi, Javad BodaghJamali, Ali Didehvarasl. Spatial –Temporal Analysis of Drought in Iran Using SPI During a Long - Term Period. Earth Sciences. Vol. 6, No. 2, 2017, pp. 15-29. doi: 10.11648/j.earth.20170602.12
Received: August 31, 2015; Accepted: September 21, 2015; Published: April 11, 2017
Abstract:
This investigation represents temporal and spatial analysis of drought events over Iran for a 42 - year period (1963 - 2005). At first, the severity of drought occurrences over Iran has been identified using SPI (Standardized Precipitation Index) at various time scales (i.e., 3, 9, and 12 - month) for 50 synoptic stations. Then the spatial distribution of annual and seasonal drought severity using SPI - 12 months and SPI - 3 months respectively have been derived. Seasonal drought has been determined for spring, autumn, and winter using SPI - 3 months for May, Nov and Feb respectively. Maps of annual and seasonal drought showed occurrence of drought in most parts of Iran mostly in following years, 1985, 1990, 1998, 1999, 2000, and 2001. Based on the frequency of each drought severity category at different time scales (SPI - 3, 9, and 12 months), time series of number of stations experienced drought were derived. They showed that mild drought has been occurred continuously in about 85% - 95% of stations from 1998 through 2001 using SPI - 9 months and SPI - 12 months. But SPI - 3 months showed mostly 99% of stations were affected by drought continuously from 1998 through 2002. Finally, spatial distribution of each drought severity categories for different time - scales were derived.Keywords:
Iran, Drought Monitoring, SPI, Spatial, Temporal, Analysis1. Introduction
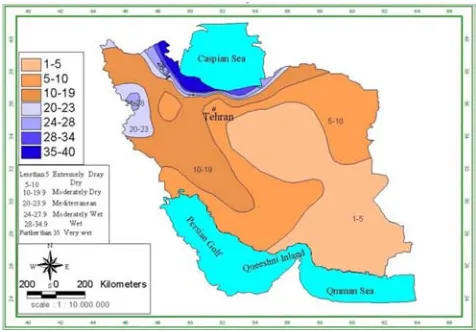
Iran is located in the arid belt of the world so its climate is mostly arid or semi - arid, and very wet along the Caspian coast (Fig. 1). On the northern edge of the country (the Caspian coastal plain) temperatures nearly fall below freezing and remain humid for the rest of the year, summer temperatures rarely exceed 29˚C, and annual precipitation ranges from 400 to1300 mm. The Zagros Mountains basin experiences lower temperatures, sever winter, daily sub - freezing average temperatures, heavy snowfall, and the annual mean precipitation ranges from 200 to 400 mm in west of Iran. The eastern and central basins are arid and precipitation ranges from 50 to 200 mm and average summer temperatures exceed 38˚C. The coastal plains of the Persian Gulf and Oman Sea in the southern Iran have mild winters, and very humid and hot summers, the annual precipitation ranges from 50 mm in eastern part to 300 mm in west along the shore. It seems that the temporal and spatial distribution of precipitation in Iran is volatile, as 90% of total precipitation
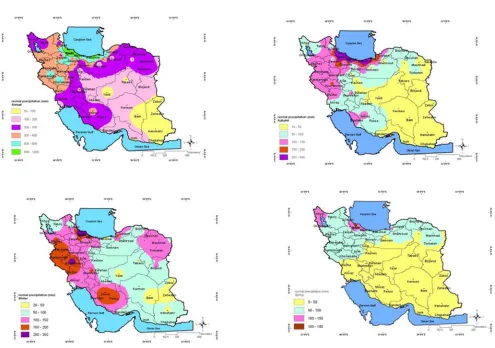
occurs in cold and humid seasons in northern and western parts of the country and only 10% occurs in warm and dry seasons in central, southern and eastern parts. About 52% of precipitation occurs in 25% of the country area (Fig. 2).
Figure 2. Annual and seasonal normal precipitation distribution.
A warming trend began in early 1990s and it has been continued in recent years despite some cooling. The annual mean temperatures have remained above average since 1995. A significant drought is observed during years of 1999 and 2000, which were associated with a lack of precipitation during the winter and spring, which normally are the wettest seasons. The country recovered from the drought conditions in 2004 with increasing rainfall, so drought is recurrent phenomenon in Iran for the last several decades and is one of the most damaging climate - related hazards to impact the country, as its effect may be different from region to region.
The most commonly used drought index is the Standardized Precipitation Index (SPI) developed by McKee et al., (1993), designed to quantify the precipitation deficit for multiple time scales. These time scales reflect the impact of drought on different water resources. Up - dated SPI has more applications in Southwest Asia than other drought indices due to its limited input data requirements, flexibility and simplicity of calculations [URL 1].
Zanvettor and Ravelo (2000) analyzed temporally and spatially drought impacts in the Pampas region of Argentina using a network of 27 meteorological stations via SPI during the second half of 1999. Sevinc and Zekai (2001) used SPI for determining drought properties of a given hydrological series. This index has been applied to the Edirne, Istanbul, and
Kirklareli rainfall records to derive the drought period, magnitude, and SPI values in Turkey. Seung - Ki Min et al., (2003) calculated monthly precipitation data from Climatic Research Unit (CRU) during (1951 - 1996). They found that the frequency of drought events in Korea has significant time intervals of 2–3 and 5–8 years and has been increasing since the 1980s and showed that the occurrence of droughts over central eastern China, Manchuria, and the north coast of Japan was highly correlated with the mentioned drought events in Korea. Caldag et al., (2004) used SPI to analyze the drought in northwest of Turkey, the results have showed that the Thrace region was under the effect of the severe drought conditions in 2000 and 2001, except for Istanbul.
types under different environmental conditions and water demand situations.
The National Drought Mitigation Center (NDMC, 2005. URL 2) is using the Standardized Precipitation Index (SPI) to monitor moisture - supply conditions. The distinguishing features of this index are as following; identification of emerging droughts months sooner than the Palmer Index and its computation based on various time scales.
The Western Regional Climate Center (WRCC) uses the National Climate Data Center (NCDC) data to calculate SPI values for each climate division. The information is then re - classed and mapped at the NDMC using a Geographic Information System (GIS). The maps are based on preliminary precipitation data, and the data’s source and methods used in incorporating the data into a final product must be considered carefully when analyzing these maps (NDMC, 2008. URL 3). The SPI is computed by NCDC for several time scales, ranging from one month to 24 months to capture the various scales of both short - term and long - term droughts (NOAA, 2008).
The SPI have been widely applied in province rather than total Iran country. For example, Malekifard and Rezazadeh (2006) investigated about the wet and dry periods over northwest of Iran including Western Azerbaijan, Eastern Azerbaijan and Kurdistan provinces using SIAP index, moreover, the relationship of positive and negative phases of NAO with rainfall has been studied. BodaghJamali et al., (2003) used SPI for North - East of Iran during (1960 - 2002), the research showed that drought frequency increases but its duration decreases at the 3 - month scale and as the time scale increases, the index responds more slowly. Raziei et al. (2003) have studied on drought monitoring index in central region of Iran using SPI. They used monthly rainfall data of 22 rain - gauge stations in central part of Iran with 40 years of data records to compute SPI index. Hedayati et al. (2005) analyzed drought over Kohkyloye - Boyerahmad province (west part of country) for a 20 - year period. They used percent of normal precipitation index, Z standard index, and five time scales of SPI - (3, 6, 12, 24 and 48 months). They found that severe drought has been occurred in 80% of region in 1993 and 1999. Hagygat et al. (2005) calculated SPI - (3and 6 months) over Fars province (central part of Iran) using 16 station data during a period of 35 years. The result showed that normal condition has been dominant in Fars province in 2005. Samadi neghab et al. (2005) used SPI index as factor in GCM model and prediction drought disaster over Khorasan province in North - East of Iran during 2005 - 2090. Bazrafshan (2007) studied drought condition over Golestan province using 13 stations data during 1980 - 2001. The result of analysis demonstrated that very severe drought occurred from 1985 through 1986 in the west part of province and humid condition was dominant from 1997 through 1998 in the east part of province. The severest drought has been occured in 2000 and 2001 in the most parts of study area.
In this study we would present an analysis of drought vulnerability in Iran using drought frequency information at varying time scales (i.e., SPI - 3, 9, and 12 - month) and
drought severity categories. The temporal and spatial drought analysis would be carried out using monthly precipitation data of 153 synoptic meteorological stations over Iran for a long term period during (1963 - 2005).
2. Data and Methodology
The Standardized Precipitation Index (SPI) was developed by McKee of Colorado state university (McKee, et al, 1993) for understanding that a certain deficit of precipitation whether it has different impacts on the soil moisture, ground water, reservoir storage, snow pack, and stream flows. The SPI was designed to quantify the precipitation deficit for multiple time scales. These time scales reflect the impact of drought based on the various types of water resources. Soil moisture conditions respond to precipitation anomalies through a relatively short time - scale, while ground water, stream flows, and reservoir storages reflect long - term precipitation anomalies, therefore, the SPI was originally calculated for 3 -, 6 -, 12 -, 24 -, and 48 - month time periods. The SPI is a probability index that considers only precipitation. The SPI is an index based on the probability of recording a given amount of precipitation, and the probabilities are standardized so that an index of zero indicates the median precipitation amount (half of the historical precipitation amounts are below the median, and half are above the median). The index is negative for drought, and positive for wet conditions. As the dry or wet conditions become more severe, the index becomes more negative or positive. The index is negative for drought and positive for non - drought (wet) conditions.
The main advantage of the SPI is that it allows for areas with different rainfall regimes to be compared. What constitutes a "drought" in a tropical area might be the same rainfall amount that would be considered "heavy rain" in a desert region. The SPI provides a method for comparing an area against its own history and giving a normalized value to describe its current rainfall conditions. Rainfall values at different locations could be compared through this normalization.
The SPI is a probability index based only on precipitation record for a location and chosen period (months or years) which converts cumulative probability to the standard normal random variable (SPI) as following expressions according to Abramowitz and Stegun (1965).
SPI=+ t- + t+
1 + + + , = 1 0 < < 0.5
SPI=- t- + t+
1 + + + , =
1
1 − 0.5 < < 1
= 2.51551, = 0.802853, = 0.01032 = 1.432788, = 0.189269, = 0.001308
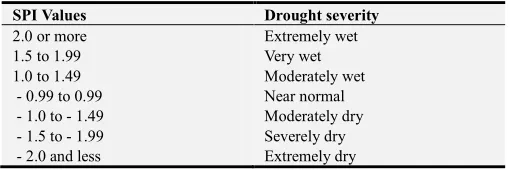
Table 1 shows a classification system linking SPI's with drought intensities. A drought event occurs any time the SPI is continuously negative and reaches an intensity less than or equal to - 1.0. The event ends when the SPI becomes positive. Each drought event has a duration defined by its beginning and end, and an intensity for each month if the event lasts. The sum of the SPI's for all the months within a drought event is the drought magnitude.
Table 1. SPI Classification.
SPI Values Drought severity
2.0 or more Extremely wet
1.5 to 1.99 Very wet
1.0 to 1.49 Moderately wet
- 0.99 to 0.99 Near normal
- 1.0 to - 1.49 Moderately dry
- 1.5 to - 1.99 Severely dry
- 2.0 and less Extremely dry
Secondly, the monthly precipitation data for 153 synoptic stations for long term period (1963 - 2005) were gathered from I. R. of Iran Meteorological Organization (IRIMO) data center. Then the severity of drought occurrences over the above mentioned stations has been identified using SPI at varying time scales (i.e., 3, 9, and 12 - month). The temporal analysis including seasonal drought monitoring using SPI 3 - month for spring, autumn and winter, also annual monitoring using SPI 12 - month during the period of study have been performed in this study.
In the next step, drought frequency occurrences have been
identified in 153 stations for each drought category at different time scales (SPI 3, 9, and 12 - month) over Iran. Then the frequencies were mapped to analyze their spatial distribution using GIS software. Hereby we have aimed to identify areas vulnerable to drought at comparable time scales based on their occurrence frequencies.
3. Results
3.1. Long Term Precipitation Anomalies
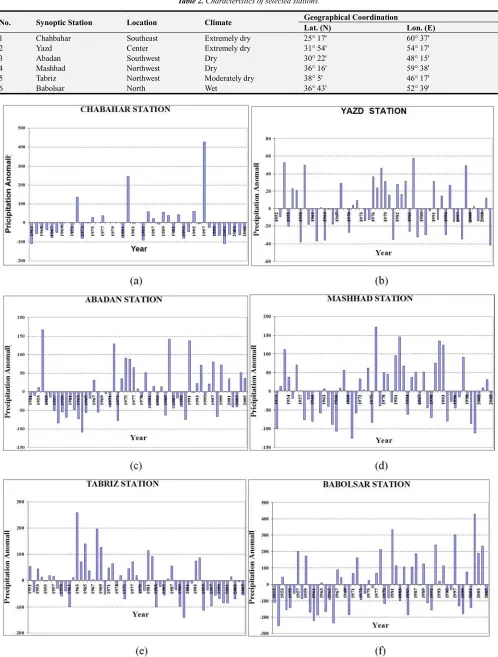
Since Iran is a country with diverse climate (Fig. 1) along with a wide range of precipitation distribution in annual and seasonal time scales (Fig. 2), estimation of long - term precipitation anomalies have been analyzed in 6 selected synoptic stations over the country from 1951 through 2005. The selected 6 stations which are representative of 4 different climates have been shown in figure 3. Chabahar and Yazd stations are the samples of hyper - dry climate which are located in southeast and center of Iran respectively. Abadan and Mashhad stations are the samples of dry climate which are located in southwest and northeast of Iran respectively. Tabriz station is the sample of moderate dry climate which located in the northwest and Babolsar station is the sample of wet climate which is located in north of the country. The geographical and climatic characteristics of the above mentioned stations which are considered for a long - term anomaly of precipitation have been shown in Table 2.
Table 2. Characteristics of selected stations.
No. Synoptic Station Location Climate Geographical Coordination
Lat. (N) Lon. (E)
1 Chahbahar Southeast Extremely dry 25° 17' 60° 37'
2 Yazd Center Extremely dry 31° 54' 54° 17'
3 Abadan Southwest Dry 30° 22' 48° 15'
4 Mashhad Northwest Dry 36° 16' 59° 38'
5 Tabriz Northwest Moderately dry 38° 5' 46° 17'
6 Babolsar North Wet 36° 43' 52° 39'
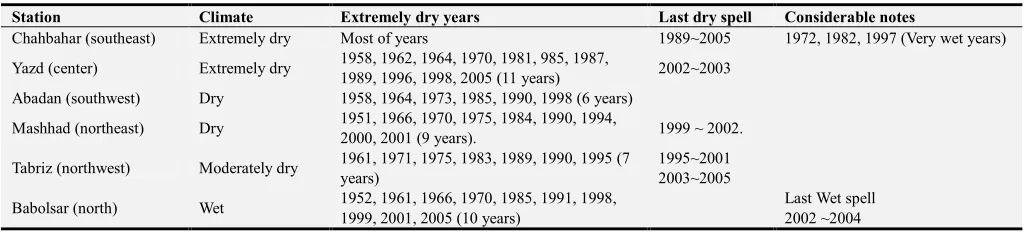
Table 3. Analysis of precipitation anomaly in some selected stations in different climate of Iran.
Station Climate Extremely dry years Last dry spell Considerable notes
Chahbahar (southeast) Extremely dry Most of years 1989~2005 1972, 1982, 1997 (Very wet years)
Yazd (center) Extremely dry 1958, 1962, 1964, 1970, 1981, 985, 1987,
1989, 1996, 1998, 2005 (11 years) 2002~2003 Abadan (southwest) Dry 1958, 1964, 1973, 1985, 1990, 1998 (6 years)
Mashhad (northeast) Dry 1951, 1966, 1970, 1975, 1984, 1990, 1994,
2000, 2001 (9 years). 1999 ~ 2002.
Tabriz (northwest) Moderately dry 1961, 1971, 1975, 1983, 1989, 1990, 1995 (7 years)
1995~2001 2003~2005
Babolsar (north) Wet 1952, 1961, 1966, 1970, 1985, 1991, 1998, 1999, 2001, 2005 (10 years)
Last Wet spell 2002 ~2004
Figure 4 (a) shows the precipitation anomaly in Chabahar station. It shows mostly precipitation is lower than normal during the long term period (1963 - 2005) except for the following years, 1972, 1982, 1997. It has also shown a continuous drought condition from 1998 through 2005. As another sample of central part of Iran with extremely dry climate, Yazd station has been chosen. Figure 4 (b) shows the time series of precipitation anomaly during long term period (1952 - 2005). It shows sever drought events in the following years, 1958, 1962, 1964, 1970, 1981, 1985, 1987, 1989, 1996, 1998, 2005 and persistence of dry condition from 1987 through 2005.
Figure 4 (c) shows anomaly of precipitation at Abadan station. It shows very dry condition in the following years, 1958, 1964, 1973, 1985, 1990, 1998. Figure 4 (d) shows Mashhad station has experienced very dry condition in the
following years, 1951, 1966, 1970, 1975, 1984, 1990, 1994, 2000, 2001, and persistence of dry spell from 1999 through 2002.
Figure 4 (e) shows the precipitation anomaly in Tabriz station. It shows very dry condition in the following years 1961, 1971, 1975, 1983, 1989, 1990, 1995 and persistence of dry period from 1995 through 2005 except for 2002.
The anomaly of precipitation in Babolsar station has been shown in figure 4 (f). It shows very dry condition in the following years including 1952, 1961, 1966, 1970, 1985, 1991, 1998, 1999, 2001, 2005 and very wet condition from 2002 through 2004.
The above analysis has showed that in different climate of Iran, the highest frequency of very severe drought has been occurred in hyper - dry climate as well as wet climate of Iran which is about 10 years among the period of study (Table 3).
Table 4. Analysis of annual monitoring of drought using SPI 12 - months.
Years Drought Wetness
Sever Moderate Sever Moderate
1985
Center (Ghom, Esfehan, Kavir), Shahrud, Tabas, Iranshahr, Jask, Abadan
Most of region Northwest
1986 Center Most of region
1987
South (Fars, South of Esfehan and Yazd), Northwest of Kerman, East, Zabol
Center, East, Southeast,
Southwest North, Northwest, Southeast
1988 Most of region except Center (Bam),
South (Zahedan)
1989 Northwest, NorthEast, East, Center, Southwest (partly)
West, Southwest (partly), Northeast (Shahrud, semnan, Babolsar), Southeast, South (partly), East (Birjand)
1990 Extended from Northeast to Southwest
Northwest, Center, Northeast,
East, South Southeast
1991 From East extended to center,
Southwest (Ahvaz, Abadan) Most of region
1992 Southwest (partly) Most of region
1993
Dispersed in some parts of Southeast (Jask, Chabahar, Zahedan)
Northwest Most of region
1994
Northeast, Centeral, South (Omman Sea and Persian Gulf)
Northwest, West North (along Caspian sea), Southwest, Northeast, East, Southeast
1995
Northwest, most region of Southern Caspian Sea coast, West, Southwest which extended to North center, West, most region of Southern part of Caspian Sea
South part East,
1996 Northeast and Northwest
(dispersed in limited area) Most of region
1997 North Southeast and Southwest Most of region
1998
Northwest, West, some parts of Center and South, some dispersed with small area in North and Southeast
Most of region
1999 Northwest, Southeast, South Most of region
2000 Chabahar, Jask Most of region Southern part of Caspian Sea
2001 Northeast, East, South which from
North to South intensified Most of region
2002 East, Southeast, South,
Central South, Southwest
2003 Southeast, South, Southwest North, Center which is extended to South
2004 Southeast Extended to from East South
like a narrow band
from Center to South wetness
intensified Most of region
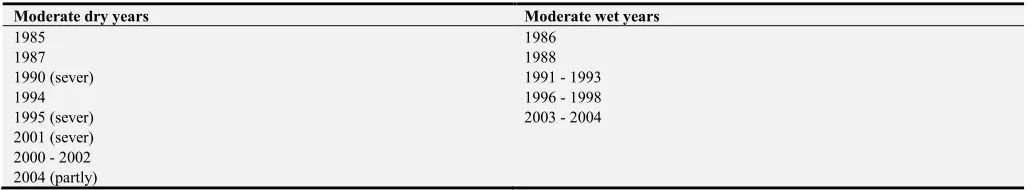
Table 5. Temporal analysis of dry and wet years during long term period based on SPI 12 - month over Iran.
Moderate dry years Moderate wet years
1985 1986
1987 1988
1990 (sever) 1991 - 1993
1994 1996 - 1998
1995 (sever) 2003 - 2004
2001 (sever) 2000 - 2002 2004 (partly)
3.2. Annual Moniatoring of Drought Using SPI - 12 Months
In this section, the monthly precipitation data series of 50 synoptic stations during long term period (1985 - 2004) have been gathered from data base centre of IRIMO. Then the severity of drought occurrences over the above mentioned
1994, 2000, 2001. Summary of geographical distribution of drought with different severity over Iran has been shown in Table. 4. Since desirable results could not be achieved only by temporal analysis of drought, in this section we consider some selected years in which the most parts of the country have been extremely influenced by drought or wet conditions. Temporal analysis of dry and wet years during long term period based on SPI 12 - month has been indicated in Table 5. Spatial distribution of annual drought also shows that in early 21th century drought condition has been dominant in most parts of country from 2000 through 2002, but drought condition has been shifted to wet condition in 2003. Some parts of Iran experiences dry condition while the other parts have been influenced by wet conditions in 2004.
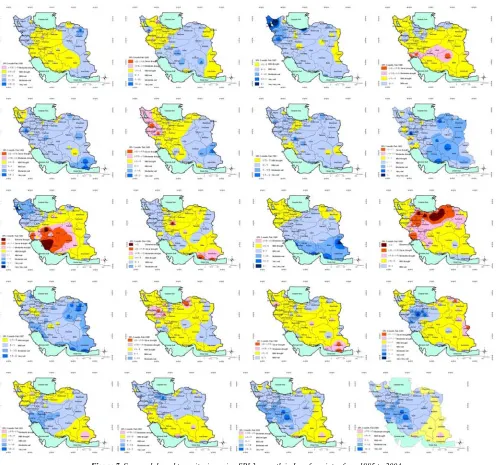
3.3. Seasonal Monitoring of Drought Using SPI - 3 Month
The seasonal (spring, autumn and winter) monitoring of drought has also been derived using SPI - 3 months for May, Nov., and Feb. respectively. Figures 6 through 8 show maps of spatial distribution of drought using SPI - 3 month for spring (May), autumn (Nov.), and winter (Feb.) respectively for the years when drought has been extended in most regions of the country in 1990s. They demonstrated that the most regions of country have experienced drought in spring of 1990, 2000, 2001, in autumn of 1998, 2001, 2003, and in winter of 1998, 1999, and, 2000. The summary of temporal analysis of occurred drought with different severities based on SPI - 3 month for 3 seasons including spring, autumn, and winter during long term period has been indicated in Table 6.
Figure 7. Seasonal drought monitoring using SPI 3 - month in Iran for winter from 1985 to 2004.
Table 6. Summary of temporal analysis of occurred drought with different severities based on SPI - 3 months for 3 seasons, including spring, autumn, and winter during long term period.
Drought severity
SPI - 3 months Severe Drought Mild drought wet Very wet
Spring
1985 1990 1987 1986
2000 2001 1993 - 95 1991, 1992
2004 (partly) 1997 - 99 1996
2002, 2003 2004 (partly)
Autumn
1990 1985 1987 1986
1992 1988 1994 1989
1995 1993 1998 1999
2003 1998 2000 2002
2001
Winter
1993 1985 1992 1986, 1987
1996 1988 1997 1989
1998, 1999 2004 1991
Figure 8. Seasonal drought monitoring using SPI 3 - month in Iran for spring from 1985 to 2004.
The seasonal analysis of drought shows that mild and severe droughts have been occurred in both seasons of autumn, and winter, in the following years 1985, 1988, 1993, 1998.
Seasonal and annual monitoring of drought have been carried out using SPI 3 - month and SPI 12 - month
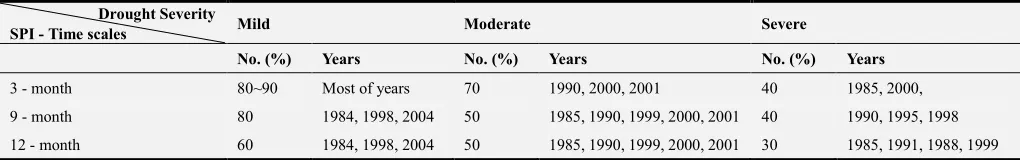
respectively. The percentage of drought severity in different time scales has also been derived. Number of stations which have experienced various severities of droughts at different time - scales of SPI in the study period has been shown in Table 7 and figures 9 through 12.
Table 7. Number of stations encountered to drought using different time - scales and severity of SPI.
Drought Severity
SPI - Time scales Mild Moderate Severe
No. (%) Years No. (%) Years No. (%) Years
3 - month 80~90 Most of years 70 1990, 2000, 2001 40 1985, 2000,
9 - month 80 1984, 1998, 2004 50 1985, 1990, 1999, 2000, 2001 40 1990, 1995, 1998
Figure 9. Number of stations experienced mild drought at SPI 3, 9, and 12 - month.
Figure 10. Number of stations experienced moderate drought at SPI 3, 9, and 12 - month.
Figure 11. Number of stations experienced severe drought at SPI 3, 9, and 12 - month.
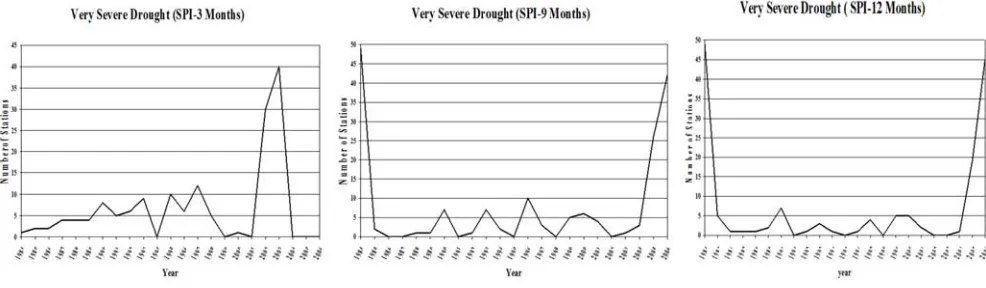
Figure 12. Number of stations experienced very severe drought at SPI 3, 9, and 12 - month. Mild Drought
We initially examined occurrences of mild droughts and found that they tend to occur in nearly 2/3 of Iran`s whole area over North - western, north, center and west of the country at 3 - month time scale. The percent of occurrence during long
south - eastern and south - western of the country with 9 - 12%. Its average frequency occurrence has been extended to the half of the country and the frequency of minimum drought has been occurred in North - eastern and Northern of the country with 6%. Occurrence of the 12 - month time scale of
SPI is nearly the same as 9 - month time scale but the maximum frequency of spatial occurrence of drought has been extended toward southern part of the country including south - eastern, south - western, and southern regions about 9 - 11% (Table 8).
Figure 13. Mild Drought Occurrences at SPI 3, 9, and 12 - month time scale.
Figure 14. Moderate Drought Occurrences at SPI 3, 9, and 12 - month time scales.
Moderate Drought
Figure 14 shows that the frequency of occurrence of moderate drought with 3 - month time - scale of SPI is about
drought occurrence is about 28% - 33% and it is little higher about 33% - 38% in northwest. Moreover, the 12 - month time - scale also shows the occurrence of drought is about 29% - 36% in the whole country but it is about 22% - 29% in southeast and east. It could be concluded that most of country in different time scales is about in minimum 22% - 33%, and in maximum is about 29% - 48%. The moderate drought frequency through the short time - scale has been considered higher, on the other hand in the long time - scale it is found lower. The frequency of drought occurrence is almost with the same value in most of the
country through different time - scales (Table 8).
Severe Drought
Figure 15 shows that the frequency of severe drought occurrence with 3 - month time - scale is about 2.5% - 4.5%, in nearly half of Iran except for southeastern part with 0.5% - 1.5%. The severe drought occurrence is about 2 - 4% in majority of country which could be concluded that it doesn't change at longer time - scales. The 9 - month and 12 - month time - scales show the same manner, the severe drought has been occurred in most of country about 2 - 4% (Table 8).
Figure 15. Severe Drought Occurrences at SPI 3, 9, and 12 - month time scales.
Very severe Drought
Figure 16 shows that very severe drought occurrences in majority of country is about 2 - 6% with 3 - month time - scale. Furthermore, this drought severity is about 4 - 9% with
9 - month, and about 6 - 9% with12 month time - scales. It could be concluded that the frequency of very severe drought occurrence is nearly about 5% in most of country in different time scales (Table 8).
Table 8. Spatial analysis of drought (with different category and different time scale) during long term period (1963 - 2005).
Drought Severity SPI Time Scale
Mild Moderate Severe Very severe
Spatial Extension Frequency of Occurrence (%) Spatial Extension Frequency of Occurrence (%) Spatial Extension Frequency of Occurrence (%) Spatial Extension Frequency of Occurrence (%)
3 - month
2/3 Area 6~9 Majority 30~35 1/2 Area 2.5~4.5
Majority 2~6 Southeast,
East 3~6
Northwest,
West 40~48 Southeast 0.5~1.5
9 - month
1/2 Area 6~9 Majority 28~33
Majority 2~4 Majority 4~9
Southeast,
Southwest 9~12 Northwest 33~38
12 - month
1/2 Area 5~8 Majority 29~36
Majority 2~4 Majority 6~9
Southeast, Southwest 9~11
Southeast,
East 22~29
4. Conclusion and Discussions
The main aim of this investigation is identification of temporal and spatial analysis of drought occurrences using SPI - 3, 9, and 12 - month. At first, we have carried out the long term precipitation anomalies over Iran. It showed that in different climate of the country, the highest frequency of very severe drought has been occurred in very extremely dry climate as well as wet climate of Iran which is prolonged about 10 years during the study period (42 years).
Then the severity of drought occurrences over Iran has been identified using SPI (Standardized Precipitation Index) at varying time scales (i.e., 3, 9, and 12 - month). The SPI has been computed using monthly precipitation data of 153 synoptic stations for a long term period (1963 - 2005). The temporal analysis of SPI 12 - month over Iran has been shown that in early 20 century drought condition has been dominant in most parts of country from 2000 to 2002, but the drought condition has been shifted to wet condition in 2003; Some parts of Iran experiences dry condition while the other parts have been influenced by wet conditions in 2004.
The temporal analysis of drought using SPI 3 - month for May, Nov., and Feb. has showed that mild and sever drought has been occurred in both autumn and winter seasons, in the following years, 1985, 1988, 1993, and 1998.
In the next step, drought occurrences in Iran have been identified based on the frequency of the events which has been occurred in 153 stations at different time scales (SPI - 3, 9, and 12 - month).
Then the frequencies were mapped to analyze their spatial distribution using GIS software.
The above analysis has shown that mild drought has been occurred in about 80 ~90% of stations using SPI 3 - month, and the results of SPI 3, 9, 12 - month indicate moderate drought has been occurred in about 50~70% of stations in the following years, 1985, 1990, 1999, 2000, 2001, and 2005. However, all time scales of SPI show that about 30~40% of stations has been affected by sever drought in the following
years, 1985, 1988, 1990, 1991, 1995, 1998, 1999, and very sever drought has been occurred in about 20~40% stations in the years including 1984, 1998, 2000, and 2005.
References
[1] Abramowitz M, Stegun IA., 1965, Handbook of mathematical formulas, graphs, and mathematical tables. Dover Publications: New York.
[2] Bazrafshan O., 2007, Management and mapping drought hazard using standard precipitation Index (SPI) (case study: Golestan province), 2nd International Conference on Integrated Natural Disaster management, Tehran, Iran.
[3] Bodagh Jamali, J., S. Javanmard, R. Shirmo hammadi, 2002, Monitoring and mapping of drought condition in Khorasan province using standard precipitation index, Geographical Research, No. 67, 4 - 21.
[4] B. Çaldagi, L. Saylani, H. Torosi, S. Sirasi, and F. Bakano gullari, 2004, Drought analysis in Northwest Turkey, 2004. Agro Environ, Udine, Italy, 20 - 24 October 2004.
[5] Hagygat A., 2005, the SPI monitoring in Fars province, Drought report, I. R. of Iran Meteorological Organization, Tehran, Iran, (in Persian).
[6] Hedayati Dezfuli A., 2005, Analysis of droughts and its trends in Kohkiloe and Boyer Ahmad, Nivar, The Scientific & Technical Journal of IRIMO, No 58, 59, 73 - 94.
[7] Malekifard F., P. Rezazadeh, 2006, North Atlantic Oscillation (NAO) and its effects on temperature and precipitation over Northwest of Iran, I. R. of Iran Meteorological Organization, Tehran, Iran.
[8] Mathieu R. and Y. Richard, 2005, Intensity and spatial extent of droughts in southern Africa, Geophysical Research Letters, Vol. 32, L15702, doi: 10.1029/2005 GL 022436.
[10] NOAA Satellite and Information Service, 2008, National Climatic Data Center (NCDC), U. S. A., Climate monitoring, SPI.
[11] Raziei, T., Shokoohi, A., Saghafian, B., and Arasteh, P. D., 2002, Drought monitoring using SPI index in Yazd Province, 8th International Conference on understanding future dry land environment changes from past dynamics, Yazd, Iran.
[12] Samadi - neghab. S., 2005, Drought - forecasting by using downscaling method on GCM outputs, Journal of Geography and Rural Development, No. 8, pp: 193 - 212. Tehran, Iran.
[13] Seung - ki Min, Won - tae Kwon, E - hyung Park and Youngeun Choi. 2003, Spatial and temporal comparisons of droughts over Korea with East Asia. Int. J. of Climatology, 23, 223. DOI: 10.1002/joc. 872, Published online in Wiley Inter Science.
[14] Sevinc S., S. Zekai. 2001, Application of the standardized precipitation index (SPI) to the Marmara region, Turkey, Integrated Water Resources Management (Proceedings of a symposium held at Davis, California, April 2000), IAHS Pub, No. 272, pp. 291–296.
[15] URL 1, Drought assessment and mitigation in Southwest Asia: http//www. iwmi. cgiar. org.
[16] URL 2, National Drought Mitigation Center (NDMC), 2005, What is Drought: Drought Indices. http: //drought. unl. edu/whatis/indices. htm#swsi
[17] URL 3, National Drought Mitigation Center (NDMC), 2008, Drought monitoring, SPI.
[18] Vicente - Serrano S. M. and J. I. L´opez - Moreno, 2005, Hydrological response to different time scales of climatological drought, An evaluation of the Standardized Precipitation Index in a mountainous Mediterranean basin, Hydrology and Earth System Sciences, 9, 523–533, www. copernicus. org/EGU/hess/hess/9/523/SRef - ID: 1607 - 7938/hess/2005 - 9 - 523, European Geosciences Union.