Identification of Thyroid Cancerous Nodule
using Local Binary Pattern Variants in
Ultrasound Images
Nanda S1, M Sukumar2
1
Research Scholar, JSS Research Foundation, Sri Jayachamarajendra College of Engineering, Mysuru, Karnataka, India
2
Research Guide, JSS Research Foundation, Sri Jayachamarajendra College of Engineering, Mysuru, Karnataka, India
Abstract: Most of the thyroid nodules are heterogeneous in nature with dissimilar echo patterns. Hence texture characterization plays a major role in discriminating benign and malignant nodules in thyroid ultrasound images. This paper addresses the classification of thyroid nodule through local binary pattern (LBP), local configuration pattern (LCP) and completed local binary pattern (CLBP) variants. This work comprises of 60 thyroid ultrasound images. LBP, LCP and CLBP features are extracted from the thyroid images. These features are used to train and test support vector machine (SVM). Accuracy, sensitivity, specificity, positive predictive value and negative predictive values are calculated. Performances of the classifier with linear, polynomial and radial basis function (RBF) kernels are compared. Best accuracy of 94.5% has been achieved when CLBP features are given to SVM of different forms.
Keywords — Completed local binary pattern, Local binary pattern, Local configuration pattern, Thyroid nodule.
I. INTRODUCTION
Thyroid cancer is common in women and in the elderly population. First sign of thyroid cancer is a thyroid nodule. A lump will be formed if there is an abnormal growth in the cells within thyroid gland. Identification of malignancy risk factor of thyroid nodule is the major challenge [1] and is useful in avoiding unnecessary and costly invasive procedures. Ultrasound imaging is the popular, non invasive and cost effective modality in evaluating the thyroid nodule. Ultrasound images of benign and malignant thyroid nodules have discernible sonographic characteristics. The shape of the malignant nodule is more composite than benign nodule due to their invade characteristics into surrounding tissues. Precise visual interpretation of these images can only be done by radiologists with lot of experience and training. Otherwise it results in subjective interpretation and inter-observer variabilities. These limitations have led to the research in developing
computer aided diagnosis (CAD) system to obtain accurate and more objective diagnosis results. In the past decades extensive study has been done by the researchers on numerous feature extraction approaches for texture characterization. Representative methods include textural features, morphological features, wavelet based features, Gabor features and fractal dimension [1],[2],[3],[4] to characterize thyroid nodules. The use of LBP variants as texture descriptors for medical images is discussed by Lorris et al. [5],[6]. Sunhua Wan et al. [7] has presented a method for breast tissue classification using spoke LBP and ring LBP features, Mellisa Cote et al. [8] showed the robustness of LBP block based approaches for texture classification. Hence in this study LBP, LCP and CLBP variants are extracted from the thyroid ultrasound images. SVM is used for the differentiation of the nodules. Performances of the classifier with various kernels are compared.
II. MATERIALS
Digital database of thyroid ultrasound images (DDTI), a public database [9] consists of delineated thyroid nodule images and their pathologies confirmed by fine needle aspiration biopsy. In this study 60 images (30 images consisting of benign nodules and 30 having malignant nodules) are used to evaluate the performances of the methods.
III.METHODOLOGY
Fig.1: Block diagram of the method
A. Pre processing
Ultrasound images are affected by many types of artefacts making it difficult to interpret and obtain quantitative information from them. The most common ultrasound artefact is the speckle noise. Anisotropic diffusion (AD) filter [10] reduces the noise in images by smoothing homogeneous regions without blurring the edges. AD has been widely used for image enhancement in biomedical imaging [11]. Hence in this study anisotropic diffusion is used to enhance thyroid ultrasound images.
A. Feature Extraction
Features are the descriptors that are useful in characterizing the image. The aim of feature extraction is to maximize the discriminating performance of the feature group. Feature vectors highly affect the performance of the classification. Thus, the extraction of useful features is a crucial task. In this study LBP, LCP and CLBP features are extracted from the ROI.
(1)Local Binary Pattern
LBP is a local texture operator [12] used to represent salient micro patterns in images. It extracts information that is invariant to local gray scale variations in the images. Extraction of LBP consists of thresholding and encoding steps. LBP value of the centre pixel is calculated by comparing centre pixel gray value with its neighbourhood pixel values using the following equations.
LBP P,R (xc,yc) = 𝑃−1𝑝=0𝑠(𝑔𝑝− 𝑔𝑐 )2𝑃 (1)
𝑠 𝑥 = 0, 𝑥 < 01, 𝑥 ≥ 0 (2)
where gc – centre pixel value
gp – neighbourhood pixel value
P – number of neighbourhood pixels R - radius of the neighbourhood
One of the most disadvantages of LBP is that it gives same LBP code for different structural pattern.
(2) Local Configuration Pattern (LCP)
Local configuration pattern [13] encodes the texture pattern based on the combination of local information and the microscopic configuration (MiC) information. Local structure information utilizes LBP while microscopic configuration information is obtained from image configuration and pixel-wise interaction relationships. MiC is designed to extract texture pattern from images. Optimal weights of the neighbouring pixel intensities are estimated to model the image configuration. This helps in reconstructing the centre pixel intensity. The reconstruction error is defined as,
E (w0,...,wp-1) = 𝑔𝑐− 𝑃−1𝑝=0𝑤𝑝𝑔𝑝 (3)
where gc and gp are values of centre and
neighboring pixels, wp’s are weights.
Optimal parameter WL is calculated using
WL = (𝑉𝐿𝑇𝑉𝐿)−1𝑉𝐿𝑇𝐶𝐿 (4)
where CL is the least square problem and VL is the
neighbouring pixel intensity.
Rotation invariant features are obtained by
HL(k) = 𝑃−1𝑝=0𝑊𝐿(𝑖)𝑒−𝑗 2𝜋𝑘𝑝 /𝑃 (5)
Magnitude of HL is taken as MiC feature and is
defined as,
𝐻𝐿 = [ 𝐻𝐿 0 ; 𝐻𝐿 1 ; … . ; 𝐻𝐿 𝑃 − 1 ] (6)
LCP can be written as,
LCP = 𝐻0 ; 𝑂0]; 𝐻1 ; 𝑂1 ; … … ; [ 𝐻𝑙−1 ; 𝑂𝑙−1
(7) Where l is the total number of patterns of interest, Op
is the pth local pattern and 𝐻𝑝 is calculated using
Eq.( 6).
(3) Completed Local Binary Pattern (CLBP)
Completed local binary pattern improves the discriminative ability of the local structures [14]. In CLBP the image local differences are divided into two complementary components viz. signs (sp) and
magnitudes (mp). This is used to calculate CLBP
sign (CLBP_S), CLBP magnitude (CLBP_M) and CLBP centre (CLBP_C). CLBP_S considers the sign component of the difference between centre pixel and neighbourhood pixel and is same as the conventional LBP sign operator s(x). CLBP_M considers the magnitude component of the difference and is defined as
Thyroid Ultrasound Images
Anisotropic Diffusion Filtering
Extraction of ROI
Classification using SVM LBP, LCP and CLBP Feature
CLBP_MP,R = 𝑃−1𝑝=0𝑡(𝑚𝑝− 𝑐)2𝑃 (8)
where threshold c is the mean value of mp of the
whole image and t(x) = 1 for x ≥ 0. CLBP_C is defined as
CLBP_CP,R = t(gc,c1) (9)
where c1 is the average image intensity.
By combining CLBP_S CLBP_M and CLBP_C significant improvement can be observed in differentiating confusing patterns.
B. Classification
Features that are extracted from the thyroid ultrasound images are given as the input to the classifier to categorize the images into benign and malignant classes. In this work support vector machine (SVM) is used for classification. SVM is basically a powerful two class supervised learning technique. It finds an optimal hyperplane [15] to separate two classes with a margin. Maximum margin in hyperplane results in a good separation between the two classes. The points that lie closest to the hyperplane are support vectors. The optimal hyperplane is completely determined by these support vectors. If the data is linearly separable then SVM produces a hyperplane that separates the data into two non overlapping classes. SVM uses kernel function to map the data into new feature space where a hyperplane (linear) may not be sufficient to do the separation. If the data is not linearly separable then kernel function can be used to transform the data into higher dimensional space to perform the linear separation.
For a two class classification problem the distinguishing function of the non linear SVM is
g(x) = 𝑁𝑖=1𝛼𝑖𝑦𝑖𝑘 𝑥𝑖𝑥𝑗 + 𝑏 (10)
where N is the number of training samples, xi are the
training data belonging to yi{+1,-1}, αi are the
Lagrange multipliers, b is the bias coefficient and k(xi,xj) is the kernel function.
Frequently used kernels are polynomial, radial basis function (RBF) and sigmoid kernel. In this work polynomial and RBF are used.
Polynomial kernel is described by
𝑘 𝑥𝑖𝑥𝑗 = (𝑥𝑖. 𝑥𝑗+ 1)𝑑 (11)
where d is the degree of polynomial. RBF with Gaussian kernel is given by
𝑘 𝑥𝑖𝑥𝑗 = exp
−(xi−xj)T(xi−xj)
2σ2 (12)
where σ is the width of the Gaussian function .
Features extracted from LBP, LCP and CLBP are used to train the classifier. The parameters used to evaluate the performance of the classifier are calculated as follows.
𝐴𝑐𝑐𝑢𝑟𝑎𝑐𝑦 = 𝑇𝑃+𝑇𝑁+𝐹𝑃+𝐹𝑁𝑇𝑃+𝑇𝑁 𝑋 100 (13)
𝑆𝑒𝑛𝑠𝑖𝑡𝑖𝑣𝑖𝑡𝑦 = 𝑇𝑃+𝐹𝑁𝑇𝑃 𝑋 100 (14)
𝑆𝑝𝑒𝑐𝑖𝑓𝑖𝑐𝑖𝑡𝑦 = 𝑇𝑁+𝐹𝑃𝑇𝑁 𝑋 100 (15)
𝑁𝑒𝑔𝑎𝑡𝑖𝑣𝑒 𝑃𝑟𝑒𝑑𝑖𝑐𝑡𝑖𝑣𝑒 𝑉𝑎𝑙𝑢𝑒 𝑁𝑃𝑉 = 𝑇𝑁+𝐹𝑁𝑇𝑁 𝑋 100
(16)
𝑃𝑜𝑠𝑡𝑖𝑣𝑒 𝑃𝑟𝑒𝑑𝑖𝑐𝑡𝑖𝑣𝑒 𝑉𝑎𝑙𝑢𝑒 𝑃𝑃𝑉 = 𝑇𝑃+𝐹𝑃𝑇𝑃 𝑋 100 (17)
where
TP-True Positive: No. of malignant nodules correctly classified as malignant.
FP-False Positive: No. of benign nodules misclassified as malignant.
TN-True Negative : No. of benign nodules correctly classified as benign.
FN-False Negative: No. of malignant nodules misclassified as benign.
To check the performance of the classification 10 fold cross validation is used in this work. This is repeated ten times and the average results are tabulated.
IV.RESULTS AND DISCUSSION
Thyroid ultrasound images are obtained from publicly available Digital Database of Thyroid ultrasound Images (DDTI). 30 images consisting of benign nodules and 30 images consisting of malignant nodules are considered. From these images, LBP, LCP and CLBP features are computed. Experimentation has been carried out by considering these features individually as well as with combination. Even though LBP and LCP features are not adequate enough to characterise the texture of the nodule in detail, these features have also been extracted for the purpose of comparative study.
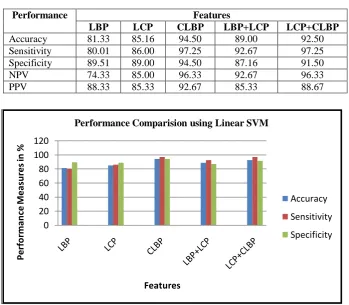
In this study, the extracted features have been classified using the Linear SVM, SVM polynomial kernels of order 1,2,3 and SVM with RBF. Classifications results of Linear SVM is given in Table I and the same has been graphically represented in Fig.2. The results show that CLBP and combination of LCP with CLBP are giving good accuracies of 94.5% and 92.5% respectively.
The features have also been classified using SVM polynomial kernel of order 1, 2 and 3. Since SVM polynomial kernel of order 1has given good results the same has been tabulated in Table II and its graphical representation is shown in Fig. 3. This classifier has given the best sensitivity of 99.67%.
shown in Fig. 4. Overall classification performance of combination of LCP with CLBP is best using this classifier where the sensitivity is 97.25%, specificity is 97% and accuracy is 96%.
V. CONCLUSION
Correct identification of cancerous thyroid nodule in ultrasound images through precise characterization is very essential as it can assists the radiologist for accurate diagnosis. This work is focused on the extraction of LBP, LCP and CLBP
Performance Features
LBP LCP CLBP LBP+LCP LCP+CLBP
Accuracy 81.33 85.16 94.50 89.00 92.50 Sensitivity 80.01 86.00 97.25 92.67 97.25 Specificity 89.51 89.00 94.50 87.16 91.50
NPV 74.33 85.00 96.33 92.67 96.33
PPV 88.33 85.33 92.67 85.33 88.67
Fig. 2. Performance of Linear SVM
0 20 40 60 80 100 120
P
e
rf
o
rma
n
ce
M
e
as
u
res
in
%
Features
Performance Comparision using Linear SVM
Accuracy
Sensitivity
Specificity
TABLE I
LINEARSVM PERFORMANCE MEASURES
TABLE II
PERFORMANCE MEASURES SVM – POLYNOMIAL OF DEGREE 1
Performance Features
LBP LCP CLBP LBP+LCP LCP+CLBP
features for the identification of the cancerous nodule using linear SVM, SVM with polynomial kernel of degree 1 and SVM with RBF. A
Fig.3. Performance of SVM Polynomial of 1st Order
80 82 84 86 88 90 92 94 96 98 100 102
P
erf
o
rma
n
ce
m
ea
su
res
in
%
Features
Performance of SVM with polynomial kernel of degree 1
Accuracy
Sensitivity
Specificity
Fig.4. Performance of SVM with RBF
75 80 85 90 95 100 105
P
e
rf
o
rma
n
ce
M
e
as
u
res
in
%
Features
Performance Comparison using SVM with RBF
Accuracy
Sensitivity
Specificity
TABLE III
SVM – RBF PERFORMANCE MEASURES
Performance Features
LBP LCP CLBP LBP+LCP LCP+CLBP
Accuracy 83.33 90.67 94.50 87.16 94.16 Sensitivity 84.60 94.50 96.33 95.6 97.25 Specificity 88.75 92.60 93.58 87.35 94.10
NPV 78.00 92.67 96.33 92.67 96.33
comparative study has been carried out and classification performances of various forms of SVM are evaluated using all the features extracted.
All the three forms of SVM are giving good accuracy of 94.5% with CLBP features. But the highest sensitivity of 99.67% is obtained by the combination of LCP and CLBP using SVM with polynomial kernel of degree 1. But overall performance is best with combination of LCP and CLBP features classified by SVM – RBF. These promising results encourages us to further explore more discriminative features along with feature vector optimization to improve the classification accuracy.
REFERENCES
[1] Stavros Tsantis, Nikos Dimitropoulos, Dionisis Cavouras, George Nikiforidis, “Morphological and wavelet features towards sonographic thyroid nodules evaluation”,
Computerized Medical Imaging and Graphics, Elsevier, vol. 33, no. 2, pp. 91-99, 2009.
[2] Michalis Savelonas, Dimitris Maroulis, Manolis sangriotis, “A computer aided system for malignancy risk assessment nodules in thyroid US images based on boundary features”,
Computer Methods and programs in Biomedicine, Elsevier, vol. 96, no.1, pp. 25-32, 2009.
[3] Grigorescu, S. N., Petkov, N., Kruizinga, P. “Comparison of texture features based on Gabor filters”, IEEE Transactions on Image processing, vol. 11, no. 10, pp. 1160-1167, 2002.
[4] Yuan Y. Tang, Yu Tao, Ernest C.M. Lam, “New method for feature extraction based on fractal behavior”, Pattern Recognition, vol. 35, no. 5, pp. 1071–1081, 2002.
[5] Lorris Nanni, Alessandra Lumini, Sheryl Brahnam, “Local
binary patterns variants as texture descriptors for medical image analysis”, Artificial Intelligence in Medicine, Elsevier, vol. 49, no. 2 pp. 117-125, 2010.
[6] Lorris Nanni, Alessandra Lumini, Sheryl Brahurveure descriptors for image classification”, Expert Systems with Applications, Elsevier, vol. 39, no. 3, pp. 3634-3641, 2012.
[7] Sunhua Wan, Xiaolei Huang, Hsiang Chieh Lee, James G
Fujimoto, Chao Zhou, “Spoke-LBP and Ring-LBP:New Texture features for tissue classification”, Pattern Recognition (ICPR) 2016 23rd International Conference on,pp. 2440-2445, 2016
[8] Mellisa Cote, Alexandra Branzan Albu, “Robust texture classification by aggregating pixel based LBP statistics”,
IEEE Signal Processing Letters, vol 22,no. 11, pp. 614-618, 2015.
[9] Lina Pedraza , Carlos Vargas, Fabian Narvaez , Oscar Duran , Em-ma Munoz, Eduardo Romero, “An open access thyroid ultrasound-image database”, Proceedings of SPIE, Vol. 9287, 2015.
[10] "P. Perona and J. Malik, “Scale-Space and Edge Detection Using Anisotropic Diffusion”, IEEE Transactions on Pattern Analysis and Machine Intelligence, vol. 12, no. 7, pp. 629-639, July 1990.
[11] "G. Grieg, O. Kubler, R. Kikinis, and F. A. Jolesz, “Nonlinear Anisotropic Filtering of MRI Data”, IEEE Transactions on Medical Imaging, vol. 11, no.2, pp. 221-232, June 1992.
[12] Ojala T Pietikainen M, Maeenpaa T, “Multiresolution gray-scale and rotation invariant texture classification with local binary patterns”, IEEE Transactions on Pattern Analysis and Machine Intelligence vol. 24, no. 7, pp. 971-987, 2002.
[13] Y. Guo, G. Zhao, and M. Pietikainen. “Texture
Classification using a ¨ Linear Configuration Model based
Descriptor” in 22nd British Mission Vision Conference , pp. 1-10, Sep. 2011.
[14] Zhenhua Guo, Lei Zhang, David Jhang, “A completed modeling of local binary pattern operator for texture classification”, IEEE Transactions on Image Processing,
vol. 19, no.6, pp. 1657-1663, June 2010.
[15] Corinna Cortes, Vladimir Vapnik. “Support-Vector
Networks”, Machine Learning, vol. 20, no. 3, pp. 273-297, 1995.
[16] T.Saravanan, “Noise Removal In Ultrasound
Images”, International Journal of Engineering Trends and Technology (IJETT), Vol 3, Issue 2, No. 4, April 2012.
[17] Suman Pandey, Deepak Kumar Gour, Vivek Sharma,
“Comparative Study on Classification of Thyroid Diseases”, International Journal of Engineering Trends and Technology (IJETT), Vol 28, No. 9, October 2015.
[18] Anjali Kapoor, Taranjeet Singh, “Speckle Reducing