Wales Journal of Learning and Teaching in Higher Education 2018, Volume 1, Number 1, 18-27 pp
ISSN 2396-7285 (online) Edited by Simon K. Haslett & Caroline B. Usei
Evidence in managing the learning experienc
e.
S. J. Rees
1; S. Hole
1, M. Dacey
1& H. Protheroe
21Faculty of Architecture, Computing & Engineering, University of Wales Trinity Saint David, Swansea, SA1 6ED.
2GLAS Business Systems Ltd., Business Development Centre, Main Avenue, Treforest Industrial Estate, Rhondda
Cynon Taff, CF37 5UR, UK.
Summary -
Crynodeb
Quality systems in general rely on the availability of appropriate evidence to permit the development of continuous improvement schemes. Practical service in managing the learning experience has highlighted the rich variety of sources of information available to the HE manager. Time basis has a critical importance in control, and the cycles of evidence collection occurs across the year are of variable value in terms of critique and analysis. The importance of formal mechanisms for quantitative and qualitative data collection are well established, but some of the use of such data is open to question, particularly where statistics are applied for small samples. The informal mechanisms are no less important, and can offer both short cycle opportunities for practical intervention and long-term quality improvements based on professionalism and systematic developments that are often not captured in the formal reporting cycles. The implications of typical problems and the value of the evidence sources within the context of likely use are assessed, with corrective actions indicated. The role of perception, and particularly of the setting and meeting of expectations, and the complexities arising from prior beliefs, is emphasised. Quality evidence is a matter of signposts for investigation; successful improvement of correct interpretation.
Yn gyffredinol mae systemau ansawdd yn dibynnu ar allu cael gafael ar dystiolaeth briodol er mwyn caniatáu datblygu cynlluniau gwella parhaus. Mae gwasanaeth ymarferol o ran rheoli’r profiad dysgu wedi tynnu sylw at yr amrywiaeth gyfoethog o ffynonellau gwybodaeth sydd ar gael i’r rheolwr AU. Mae pwysigrwydd tyngedfennol i’r sylfaen amser o ran rheolaeth, ac mae’r cylchoedd casglu tystiolaeth sy’n digwydd ar draws y flwyddyn o werth amrywiol o ran beirniadaeth a dadansoddi. Mae pwysigrwydd trefniadau ffurfiol ar gyfer casglu data meintiol ac ansoddol wedi hen ennill ei blwyf, ond mae modd cwestiynu rhywfaint o’r defnydd o ddata o’r fath, yn enwedig pryd y defnyddir ystadegau ar gyfer samplau bach. Nid yw’r trefniadau anffurfiol yn llai pwysig, a gallant gynnig cyfleoedd cylch byr ar gyfer ymyrraeth ymarferol a gwelliannau hirdymor o ran ansawdd wedi’u seilio ar broffesiynoldeb a datblygiadau systematig na fyddant yn aml yn cael eu cofnodi yn y cylchoedd adrodd ffurfiol. Asesir goblygiadau problemau nodweddiadol a gwerth y ffynonellau tystiolaeth o fewn cyd-destun y defnydd tebygol, gan nodi camau unioni. Pwysleisir rôl canfyddiad, ac yn benodol gosod a chyflawni disgwyliadau, a’r cymhlethdodau sy’n codi o gredoau blaenorol. Mae tystiolaeth o ansawdd yn fater o gyfeiriadau i’w harchwilio; gwella dehongliadau cywir yn llwyddiannus.
Keywords: Higher education, management, learning experience, evidence, continuous improvement,
qualitative and quantitative data
Introduction
feedback; and effective communication. The use of evidence in creating a measurable conception of the variance between the current operation of the course and the envisioned ideal is a standard methodology in manufacturing. In higher education this is not a simple task, because a number of the variables themselves remain uncertain.
Two basic postures result. In the first, the information base is viewed as uncertain. Accordingly, academic managers primarily rely on lecturer commentary. The chain of logic is that students do not understand higher education (HE) until they have completed it. Their input is unreliable. At its extreme, student malfeasance (idleness, lack of diligence in study, social orientation) is treated as the primary cause of student difficulties. Staff create a range of mythologies about “their” students which limit responsibility for the learning experience other than providing the minimum context necessary for it to occur. The alternative stance idealises the gathered information as unarguable. Given the lecturer has access to good data throughout the learning process, it is unacceptable to see problems with progression and attainment because these should have been fixed during the learning and teaching activities.
Management by exception is generally adopted for the consideration of module performance. As a result, focus usually falls on modules with statistics falling away from the mean or normal range. The question then is whether the available evidence is sufficient to derive causality. Identification of cause provides the most direct route to improvement.
Evidence
The Evidence Base: Module and Course Operation
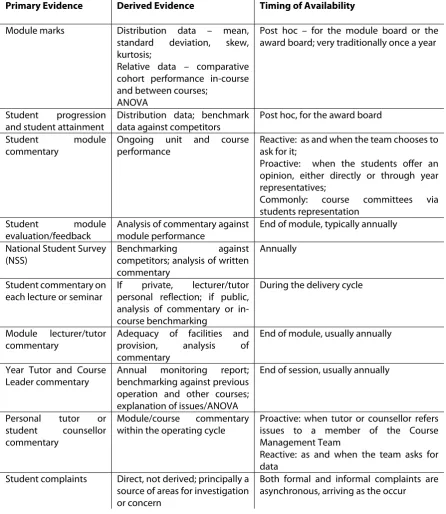
A consideration of the standard sources of evidence, derived information and time cycle is given in Table 1 overleaf. The principal point is obvious: there are numerous sources of data on module and course performance available once the module or course has completed its operation; there are limited data sources customarily garnered whilst the course or module is running. Quality systems benefit both from long- and short-term variation data to be most effective and reduce the risks of over control.
The quality of the data sources is variable in content and interpretation. Students often struggle to disaggregate dislike for a topic from the way it has been delivered. Academics disparage the slightest defect in statistical measures, often an issue with mark calculators with student record systems. Mark calculators are usually bespoke developments in standard packages, coding each university’s unique rules. Problems include statistical handling of zero scores and non-submissions, and a variety of solecisms arising from rule interpretation. Comments about National Student Survey methodology and results are frequently adverse, though the system only records independently student commentary, and the detailed written supporting information often clarifies well the data outliers.
In spite of the growth of Postgraduate Certificate qualifications in learning and teaching and HEA membership, lack of reflective quality in lecturers’ module reports can be problematical.
process. Methods can range from early assessment marks through personal tutor feedback and Module Leader observations.
Table 1 - Sources of Evidence
Primary Evidence Derived Evidence Timing of Availability
Module marks Distribution data – mean,
standard deviation, skew, kurtosis;
Relative data – comparative cohort performance in-course and between courses;
ANOVA
Post hoc – for the module board or the award board; very traditionally once a year
Student progression and student attainment
Distribution data; benchmark data against competitors
Post hoc, for the award board
Student module commentary
Ongoing unit and course performance
Reactive: as and when the team chooses to ask for it;
Proactive: when the students offer an opinion, either directly or through year representatives;
Commonly: course committees via students representation
Student module evaluation/feedback
Analysis of commentary against module performance
End of module, typically annually
National Student Survey (NSS)
Benchmarking against competitors; analysis of written
commentary
Annually
Student commentary on each lecture or seminar
If private, lecturer/tutor personal reflection; if public, analysis of commentary or in-course benchmarking
During the delivery cycle
Module lecturer/tutor commentary
Adequacy of facilities and provision, analysis of commentary
End of module, usually annually
Year Tutor and Course Leader commentary
Annual monitoring report; benchmarking against previous operation and other courses; explanation of issues/ANOVA
End of session, usually annually
Personal tutor or student counsellor commentary
Module/course commentary within the operating cycle
Proactive: when tutor or counsellor refers issues to a member of the Course Management Team
Reactive: as and when the team asks for data
Student complaints Direct, not derived; principally a source of areas for investigation or concern
Both formal and informal complaints are asynchronous, arriving as the occur
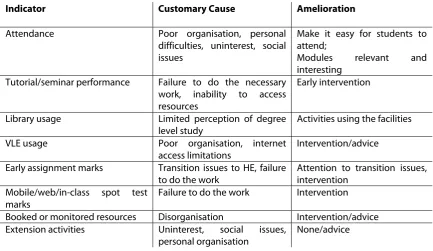
The Evidence Base: Student Engagement
on mobile and web-based spot tests, sessions used on (booked or monitored) scarce resources, and attendance and participation in extension or extracurricular activities.
Table 2 - Student Engagement Indicators
Indicator Customary Cause Amelioration
Attendance Poor organisation, personal
difficulties, uninterest, social issues
Make it easy for students to attend;
Modules relevant and interesting
Tutorial/seminar performance Failure to do the necessary work, inability to access resources
Early intervention
Library usage Limited perception of degree
level study
Activities using the facilities
VLE usage Poor organisation, internet
access limitations
Intervention/advice
Early assignment marks Transition issues to HE, failure to do the work
Attention to transition issues, intervention
Mobile/web/in-class spot test marks
Failure to do the work Intervention
Booked or monitored resources Disorganisation Intervention/advice
Extension activities Uninterest, social issues,
personal organisation
None/advice
The ability to use data warehousing techniques to mine the electronic data, from attendance monitoring systems (increasingly used because of government requirements for Tier four immigrant licences), library systems, VLEs and online activities offers the department the ability to build up a multidimensional vector representation of engagement. Comparison with typical patterns for successful students and failing students gives a means of partitioning clusters of predictive performance, perhaps early enough to allow successful intervention. The ability to avert withdrawal and failure is a key goal for widening participation. It is not simply that recruitment effort is expensive: there is no greater loss than wastage of human potential.
Monitoring student engagement brings the university a difficult issue. The resources to provide personal and remedial support are limited, the system presently request driven, and only those students seeking support are offered assistance. Few institutions will welcome the increased resource burden of an institution-led approach.
Improvement
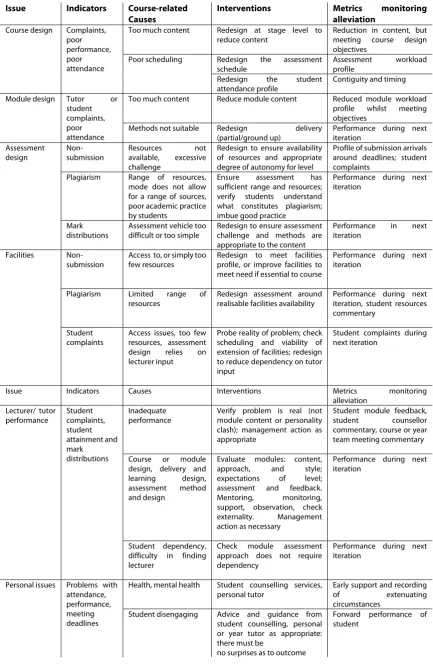
In order to improve performance, we seek causal relationships. In essence, the goal is to use the available evidence as a guide to likely issues. Table 3 below lists common issues, their associated indicators and interventions used in alleviation of them.
Input (selection) is an obvious place to for problems to arise. It is important that the prerequisites for study for the course are actually met. Perhaps the most unfortunate examples of this occur with basic English language ability with international students. Courses with viability issues attempting to broaden their recruitment base by attracting non-standard qualification entrants present obvious risks unless appropriate attention is paid to transition and the additional support needed to engage successfully.
the result of some personal issue, it is not amenable to systematic improvement, but only to individual support and intervention which may be outside the ambit of the course team.
Interventions vary; the underlying principles of quality do not. Improvement is the use of data to find causes and the deployment of action to resolve issues: facing the facts, solving the problems.
Aspects of this discussion are focused on measurable evidence and directed interventions. It is beneficial to consider the issue of complaints and comments in the round. This does not consist of formal complaints to the university’s systems alone, but the usual informal issues raised by students to academic staff, by staff to each other, and collegial suggestions arising from basic quality improvement activities such as peer observation. Lecturers can and do work together to monitor each other’s performance. This may be formalised, by creating groups tasked to attend each other’s lectures, and assessment processes such as second marking and internal moderation of assignments. Such activities use materials and delivery as evidence to manage the learning experience, for example to confirm parity of academic standards and ensure required student effort is balanced to the credit obtained in assessments.
Lecturers within discipline groups share similar modules and experiences, so it is not uncommon for informal discussions to lead to attempts to develop new teaching approaches, content changes or even the instigation of new modules aimed at addressing performance and currency issues. Such activities have a direct effect on the student experience, but they are not captured unless reported through the lecturer module monitoring procedures. Lacking metrics for measuring their impact, the importance of these informed and focused interventions is sometimes overlooked.
The evidence base is the key available source of guidance to steer investigations and interventions, whether formal or informal, managed or self-motivated. It ensures the problems fixed are those causing real difficulties, rather than the inevitable anecdotal or “folk lore” issues which thrive in the institutional environment. The Pareto principle (Juran 1999) guides us preferentially to seek out and solve the big problems first.
Using the Numerical Data
Most institutions produce statistical data on recruitment, progression, assessment outcomes and other aspects of student performance as part of annual programme monitoring exercises and for examination boards. The data is rarely pristine which feeds an insatiable desire to cavil on the part of many lecturing staff, even though the data disagrees from their own observations by minutiae well below the bounds of statistical relevance. No doubt the use of arbitrary limits to define “exceptional”, or outlier, modules and units has fed this fascination with detail, in that it is easier to quibble over data than explain unusual performance. Care in data preparation and some basic statistical understanding is essential in minimising the associated wasted time.
Numerical data contains a discriminating narrative as to the student experience and staff confidence. The “gotcha” approach to assessment (teach one thing, examine another: why not; it was on the reading list; any good student would have got it …), student disappointment or anger at outcomes, bimodal groupings in a unit – these may speak clearly to a lack of lecturer self-belief, poor communications skills, and cliquishness. The underlying causes are there to be sought once the data reveals a line of enquiry.
Sample size
Table 3 - Issues, Indicators, Interventions and Metrics in Improvement
Issue Indicators Course-related
Causes
Interventions Metrics monitoring
alleviation Course design Complaints,
poor performance, poor attendance
Too much content Redesign at stage level to
reduce content
Reduction in content, but meeting course design objectives
Poor scheduling Redesign the assessment
schedule
Assessment workload profile
Redesign the student attendance profile
Contiguity and timing
Module design Tutor or
student complaints, poor attendance
Too much content Reduce module content Reduced module workload
profile whilst meeting objectives
Methods not suitable Redesign delivery
(partial/ground up)
Performance during next iteration Assessment design Non-submission Resources not available, excessive challenge
Redesign to ensure availability of resources and appropriate degree of autonomy for level
Profile of submission arrivals around deadlines; student complaints
Plagiarism Range of resources,
mode does not allow for a range of sources, poor academic practice by students
Ensure assessment has sufficient range and resources; verify students understand what constitutes plagiarism; imbue good practice
Performance during next iteration
Mark distributions
Assessment vehicle too difficult or too simple
Redesign to ensure assessment challenge and methods are appropriate to the content
Performance in next iteration
Facilities
Non-submission
Access to, or simply too few resources
Redesign to meet facilities profile, or improve facilities to meet need if essential to course
Performance during next iteration
Plagiarism Limited range of
resources
Redesign assessment around realisable facilities availability
Performance during next iteration, student resources commentary
Student complaints
Access issues, too few resources, assessment design relies on lecturer input
Probe reality of problem; check scheduling and viability of extension of facilities; redesign to reduce dependency on tutor input
Student complaints during next iteration
Issue Indicators Causes Interventions Metrics monitoring
alleviation Lecturer/ tutor performance Student complaints, student attainment and mark distributions Inadequate performance
Verify problem is real (not module content or personality clash); management action as appropriate
Student module feedback, student counsellor commentary, course or year team meeting commentary
Course or module design, delivery and learning design, assessment method and design
Evaluate modules: content, approach, and style; expectations of level; assessment and feedback. Mentoring, monitoring, support, observation, check externality. Management action as necessary
Performance during next iteration
Student dependency, difficulty in finding lecturer
Check module assessment approach does not require dependency
Performance during next iteration
Personal issues Problems with attendance, performance, meeting deadlines
Health, mental health Student counselling services, personal tutor
Early support and recording
of extenuating circumstances
Student disengaging Advice and guidance from
student counselling, personal or year tutor as appropriate: there must be
no surprises as to outcome
Preparing the data
Any real world data collection will include outliers and aberrations. In order to give consistency and improve the extraction of meaning, preparation of the data is necessary. The sample sizes may be such that use of data is only appropriate as a broad brush pointer, so over preparation is something of a waste of time. The key questions with typical student results data are:
(i) Do we include those students that scored zero in the data? Typically these will have not submitted the coursework or not attended the examination but have not withdrawn from the course. Most universities will do this.
(ii) Do we include the marks of students who did not engage? We could treat the number not engaged separately, as a quantitative indicator of whether the module is, of itself, engaging. This is less common practice
(iii) Do we take out any students with valid extenuating circumstances? This seems obvious, but again is not common practice.
Data preparation requires human intelligence, and introduces the possibility of unconscious bias in selection. As professional researchers, deliberate, or conscious, selection bias is less likely with academic staff. Put cynically, if so inclined there are easier opportunities for an examiner or assessor to weight the system outcomes.
Distributions
A well-run honours degree course under CNAA regulations during the 1980s would expect a module to deliver a mean (average) mark of around 55% and a standard deviation of 12. This presents a normal curve with an average performance in the 2.2 band, limited numbers of failures and limited numbers of firsts. Such a performance in most universities at present would indicate difficulties, with NSS data indicating 70% and more of students now attain 2.1 or 1st class honours in many reputable institutions. For a normal distribution this is more indicative of a mean of above 65% and smaller standard deviation if the number of 2.1s is to exceed the number of 1st class awards. More realistically, it indicates a skewed distribution which is not normal (Gaussian) in shape.
Distributions can be made from time-bound data (i.e. this year’s cohorts) or can be compared across time. The Open University has a highly regarded system of comparison throughout the lifetime of a course, but also has sufficient numbers on units to make formal application of distributions meaningful.
A distribution with limited numbers of students can only serve as an indicator. The opportunity to identify and interrogate the operation and methods in modules with mark distributions lying well away from the institutional norms for the cohort, course or discipline is basic good practice in quality terms. Repeated disparity is a managerial issue that may speak to problems in selection, transition or preparation of students, or in course design.
Although this discussion focuses principally on course level analyses, there are implications for the ways in which marks are aggregated to ascertain awards. Yorke (2009) discusses in some depth the implications of distributions in the individual classification context and arrives at a less than positive conclusion as to their probity.
Distributions are conventionally used in quality systems in the form of control charts. These are visual indicators which map the mean and variance of input data as the measure of performance. On a numerical basis, analysis of variance (ANOVA) can be used to indicate the significance of differences between distributions. Because there is no expectation of group differentials, the statistical approach of application of F-tests, Tukey, and numerical analysis is not common. The customary approach is in the form of analysing areas where variance from expectation has occurred, and seeking causal relationships from events rather than group class.
Using the Qualitative Data
for measurability. Quantitative data (marks, grades) are used as the proxy measure for the disaggregated parts.
Qualitative data derived from student comment and opinion has the merit of reflecting the recipient of the learning’s experiences. It lacks, in most cases, the benefit of perspective and comparison, because the student has nothing with which to compare in similar levels of study. Calibration, therefore, is a significant issue.
Disappointingly, the equivalent data derived from tutor/lecturer comment often suffers from a lack of objectivity. For all the research training an individual may have received, the ability to perceive oneself as doing an ordinary, or indeed a poor, job suffers from the psychology of being a lecturer, the feeling of the right to stand in front of others and “educate” them. Anecdotally, few lecturers regard themselves as less competent than the worst educators of their own undergraduate experience.
Elements of Professional Qualitative Data
The courses universities run, in general, lead to participation as professional practitioners in the discipline of study. Opinions from employers of course graduates and other practitioners with whom they work are an evaluation of how well the course fits this purpose.
Opportunistic elements
Consideration of the various elements of assessment undertaken during the course should show the characteristics of the course’s expected outcomes;
If a final individual or group project is included, the students’ conduct of the projects and their outcomes should show the attributes of the course;
The opinion of lecturers and tutors as to an individual’s assimilation of course attributes;
Commentary from external sources if workplace-derived or as-live projects are included in the course;
Commentary from employers of the course output graduates if such external inputs are included in course advisory panels or garnered during visits
Designed elements
Narrative arc built through assessment elements in the final year;
Final project, dissertation, display or collection (equivalent to the ancient “apprentice piece” concept) as appropriate to the discipline;
Individual or small group tutor relationship;
Feedback elements
Qualitative Change
Disaggregating the holistic view of the processes that make up a discipline practitioner or a discipline professional yields a number of aspects that one might expect to see change over the duration of study:
(a) A transformation in the students’ understanding of the discipline. This should be evident in the quality of assessed work and the nature of the feedback provided by tutors;
(b) The development of the core technical skills of the discipline, which is evidenced in the practice arc of the course;
(c) The assimilation of professional/practitioner attitudes and confidence, and evincing an appropriate synergistic view of the discipline. This is seen in tutor and personal tutor commentary; and
(d) The adoption of behaviours appropriate to lifelong learning and professional updating, seen in reflection on performance and participation (attendance, interest, contribution) in the peripheral and extension activities taking place around the course.
(e) Significant change and improvement in professional/practitioner performance. Whilst higher education is not training, it is reasonable to expect the outcomes of learning will enhance performance.
This evaluation is perhaps where the course learning outcomes, included as mandatory in most universities’ course validation documentation, provide a potential metric set for assessment of impact. The authors of this paper have variously worked and studied in eight UK universities, and have been involved as external advisers in validations with a further twelve. In none of these has any overt use of course learning outcomes been seen to be made in monitoring and quality improvement.
Qualitative Data: Are We Meeting Expectations?
NSS has thrown into stark relief the business of the expectations on both parties in learning. Academic staff use their expectations as a part of their design of courses, modules and assessments. Explicitly or implicitly, this is the aspect of being a “learning professional”. Students equally bring a range of expectations to HE. Practical experience shows these are diverse, ranging from simply more of the educational process and style they received in school through to a student-centric practice led environment or some romanticised view of a 1930s Oxbridge tutorial relationship. Unfulfilled expectations might be one of the keys to improving student perceptions. Yet expectations are fluid. Their achievement may be as much in setting them in an achievable range as in delivery of some perfect system. Setting explicit and limited expectations at a module and course level is a communication issue; setting expectations on assessment has the more direct option of aligned assessment (Biggs 2003). Robinson and Udall (2006) implemented this as the concept of aligning the students’ understanding with the tutor’s expectations as part of the learning process in a variety of ways, including marking grids (Rees and Robinson 2012).
Collection here is less easy in terms of naturally occurring evidence. For example, it is unlikely students will think to comment on the excellence of the alignment process for a particular module, and generally meeting expectations is more likely to generate a “warm glow” (better NSS outcomes in the round) rather than any analysis. It may require addition of a direct question to standard end-of-module student feedback requests or inclusion in per-lecture feedback where this is garnered.
The use of the evidence is subject to the duality of the question: met or set? Clinton (2009) suggests the idea of the psychological contract as in workplace studies (Rousseau 1995) is a key part of expectation satisfaction. An improvement action can be a matter of content and delivery change or of more robustly establishing for the module or course the learning contract of exchange.
Conclusion
Garnering a rich set of data concerning the course during operation and on how it operated once completed delivers the sources of information to drive change and continuous improvement. It is an aspect of care for the student experience and learning. The information is key to the enhancement of the ability of academic practitioners to support learning. Methodical processes which use the expertise of the course leader and course team provide a framework to buttress enthusiasm with evidence, and help to filter the reality of learning from unsubstantiated opinion and folklore beliefs.
Systematic, evidence-based improvement requires three things: an individual or small group who own the process and take responsibility for enhancement; a course team that cares about the quality of the graduates they produce and will change approach to improve; and a willingness to put the necessary time into gathering and evaluating the evidence. This is mainstream quality thinking. As Edwards Deming (2000) and many others have observed an expert and interested team, working to an excellent design, operating the right monitoring processes and assiduous in making improvements, will produce superior products. Academics face challenges beyond those of most production and service delivery environments, not least that the students have to opt in to the change processes. But the core approaches remain: excellence in design and evidence-based continuous improvement are the foundations of a good student experience.
REFERENCES
Biggs, J. 2003. Aligning Teaching for Constructing Learning, HEA, 2003,
https://www.heacademy.ac.uk/sites/default/files/resources/id477_aligning_teaching_for_constructing_learnin g.pdf, accessed 10.00, 22 June, 2016
Clinton, M. 2009. Managing Students’ and Teachers’ Expectations of Higher Education: A Psychological Contract Approach, in Higher Education Research Network Journal: Prizewinning Essays, Vol 3, D. Hay (Ed.), King's Learning Institute, London, 2011, ISBN 978-0-955-8633-7-0, pp 23 – 28
Edwards Deming, W. 2000. Out of the Crisis, MIT Press. Cambridge, Mass, ISBN 0262541157
Gibbs, G. 1988. Learning by Doing: a Guide to Teaching and Learning Methods, Oxford: Further Education Unit, Oxford Polytechnic, 1988, structured teaching reflection tool available from:
https://www.learning.ox.ac.uk/media/global/wwwadminoxacuk/localsites/oxfordlearninginstitute/documents/ supportresources/lecturersteachingstaff/resources/resources/Structured_Teaching_Reflection_Tool.pdf, accessed 03/05/2016
Holroyd, C. 2000: Are Assessors Professional? Student Assessment and the Professionalism of Academics, Active Learning in Higher Education 1(1), 2000, pp. 28 – 44
Juran, J, & Blanton Godfrey, A., Eds. 1999. Juran's Quality Handbook, 5th Ed., McGraw-Hill, 1999, ISBN 0-07-034003-X, pp. 520 – 524
Ramsden, P. 2003. Learning to Teach in Higher Education (2nd Ed.), Routledge Falmer, UK, 2003
Rees, S. J. & Robinson, A. (2012). The Student Experience, the Staff Experience and the Role of Assessment, 1st Solent Teaching and Learning Community Conference Proceedings, Southampton Solent University, 26th March 2012, pp28 – 42
Robinson, A. & Udall, M. 2006. Using Formative Assessment to Improve Student Learning through Critical Reflection, Innovative Assessment in Higher Education, 92-99
Rousseau, D. M. 1995. Psychological contracts in organizations: Understanding written and unwritten agreements. Thousand Oaks, CA: Sage, 1995
Yorke, M. 2009. Honours degree classifications: what we can and cannot tell from the statistics, QAA Quality Matters, September 2009, available as agenda item CSPC09/102E in: