Otong et al. World Journal of Pharmaceutical and Medical Research
RADIOLOGICAL ESTIMATION OF SEX USING TROCHLEAR SURFACE OF TALUS
IN ADULT NORTH EASTERN NIGERIANS
Eduitem S. Otong1*, Danladi S. Amaza2, Sani A. Bello1, Aminu A. Rufai1,Zainab Mustapha3 and Tamunotonye W. Jacks4
1
Department of Human and clinical Anatomy, College of Medical Sciences, Abubakar Tafawa Balewa University Bauchi, Bauchi State, Nigeria.
2
Department of Human Anatomy, Faculty of Basic Medical Sciences, College of Health Sciences, Kaduna State University, Kaduna State, Nigeria.
3
Department of Radiology, University of Maiduguri Teaching Hospital, Borno State, Nigeria. 4
Department of Human Anatomy, College of Medical Sciences, University of Maiduguri, Borno State, Nigeria.
Article Received on 02/05/2017 Article Revised on 23/05/2017 Article Accepted on 12/06/2017
1. INTRODUCTION
The field of forensic anthropology involves the building of an ante mortem profile of an individual from skeletal remains. This involves sex, race determination; age and stature estimation. Because most bones that are conventionally used for sex determination, age and stature estimation are often recovered either in fragments or incomplete state, it has become necessary to use denser bones that are often recovered intact such as the patella, calcaneus and talus.[1]
Surface or shallow burials often result in the loss of skeletal materials which can greatly impede an investigation. Unlike the skull and other long bones, the compactness and the associated soft tissues (ligaments) make the talus more resistance to taphonomic factors, thus increasing its chances of preservation and eventual field recovery. In situations requiring post-mortem identification where recovered skeletal material may be limited, this quality makes the talus an appropriate alternative for osteological analysis.[2]
ISSN 2455-3301
WJPMR
AND MEDICAL RESEARCH
www.wjpmr.com
*Corresponding Author: Eduitem S. Otong
Department of Human and clinical Anatomy, College of Medical Sciences, Abubakar Tafawa Balewa University Bauchi, Bauchi State, Nigeria.
ABSTRACT
Aim: To evaluate sexual differences using demarking points and index of sexual dimorphism using Trochlear Breadth of the talus in relation to age of males and females in north eastern Nigerians. Methodology: Three hundred and twelve (312) radiographs of adult north eastern Nigerians (156 males and 156 females) with age ranged 20 to 69 years were measured. Radiographs used for this study were obtained from the collection of the records unit of the Radiology Department, University of Maiduguri Teaching Hospital (UMTH) in Borno State, Nigeria. Radiographic viewing box, erasable maker and meter rule were used for the measurements. Both female and male samples were grouped into two separate subsamples (right and left talus). Samples were classified separately into five (5) age groups spanned ten years’ interval. The antero-posterior views of the plain radiographs of the ankle were mounted on viewing box connected to a light source with good illumination. Trochlear Breadth (TLB) of the talus (linear distance between the most medial and most lateral point on the trochlear surface) were identified and marked using a maker and the distances between them were measured with a meter rule in centimeters (cm). Results: The means of TLB of talus for males are all significantly greater than their female counterparts of the same age group. The results also show statistically significant (p<0.001) differences between the Trochlear Breadth of talus in males and females with the values of demarking points (DP) in males higher than those in the females. Parameters of index of sexual dimorphism (ISD) are greater than 100 which suggest that males have higher value over their female counterparts. The result also shows age related variation with male TLB of the talus ranged from 4.41 cm at 60-69 years age group to 4.68 cm at 30-39 years age group; while the female TB of the talus ranged from 3.96 cm at 60-69 years age group to 4.19 cm at 30-39 years. Conclusion: It was observed that the TLBs of talus are sexually dimorphic; the DPs of male parameters are all higher than those of their female Counterparts. It was also observed that the ISD for male TLBs are greater than those of the female counterparts as the ISDs are all greater than 100 at all age groups. However, more studies are required in other part of Nigeria, so as to capture the racial variation in the country.
Categorization of human remains by sex and age has been a challenge for the medico-legal profession. Metrical study of bones has been done by various authors.[30,4] Advocated the DP can identify the sex of the individual with 100% accuracy.[5] Reported that even within the same general population, mean value may be significantly different in bones from different zones.[6] Showed that DP should be calculated separately for different region of population, because the mean of parameter, may differ in values. To be certain in identification, calculated ranges have to be considered, which was worked out by adding and subtracting 3 X standard deviation (SD) to and from the mean of any parameter.[4] called the limiting point of such calculated range: demarking point, which identify sex with 100% accuracy from any given population or region, hence the need for this study to evaluate sexual differences using DPs and ISDs of the length of the talus in relation to age of males and females in north eastern Nigerians.
2. MATERIAL AND METHODS
This retrospective study used radiographs obtained from the collection of the Records Unit over a period of five years (2005-2010) from Radiology Department University of Maiduguri Teaching Hospital (UMTH) in Maiduguri, Borno State, Nigeria. The distance between the cassette and the X-ray tube was short; hence magnification obtained was 0.1 mm (0.01 cm). Only radiographs that were reported by a consultant radiologist as normal without any bone defect were used for this study. Plain lateral X-ray radiographs of the ankle for three hundred and twelve (312) subjects (156 males and 156 females) with age ranged from 20 to 69 years were measured. Both female and male samples were grouped into two separate subsamples (right and left talus). Samples were classified based on their ages which spanned ten years interval (Table 1). Each patient’s age and sex were taken directly from the film jackets. Radiographic viewing box, erasable maker, calibrated meter rule was used for the measurements. The viewing box was connected to a light source which gave good illumination.
Table 1: Distribution of Subjects according to Age Groups.
Age Group (years)
Males Females
Total Right Left Right Left
20-29 30-39 40-49 50-59 60-69
16 15 17 15 15
16 15 17 15 15
16 15 17 15 15
16 15 17 15 15
64 60 68 60 60 Total 78 78 78 78 312
Trochlear Breadth (TBs) in centimeters was taken on each talus. Erasable marker was for noting the points of measurements while a calibrated meter rule was used for the measurements. Each measurement was taken three times and an average was computed. The methods
adopted for the measurements were a modification from. [7]
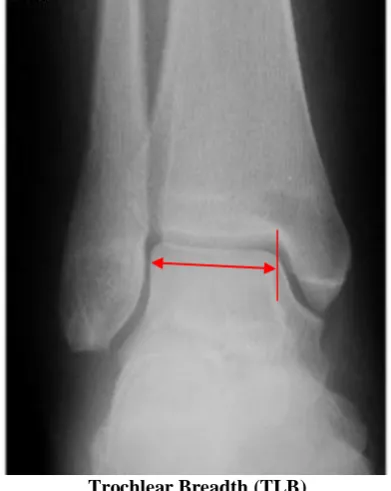
The X-ray films were mounted on a viewing box. The margins of the talus were well outlined and the most medial and the most lateral points on the body were marked by erasable marker. Then the linear distance between the two points were measured by a transparent calibrated meter rule in centimeter as TB (Figure 1). All the measurements were taken directly on the radiographs.[8,9]
Trochlear Breadth (TLB)
Figure 1: Antero-posterior Radiograph of the Ankle showing Troclear Breadth (red line).[10]
2.1 Statistical Analysis
Values for Index for Sexual Dimorphism (ISD) were obtained using the formula:
ISD= Male Mean x 100% [12] Female Mean
Values for CR and DP were obtained using the formula = mean ± 3 x Standard Deviation
3. RESULTS AND DISCUSSION
3.1 Analysis of Results for Trochlear Breadth of the Right Talus in Males and Females
The TLB of the right talus between male and female was compared. It was observed that male value ranged from 3.55 cm at 60-69 years’ age group to 3.74cm at 30-39 years’ age group: while female mean value ranged from 3.06 cm at 60-69 years’ age group to 3.31 cm at 30-39 years’ age group with significant differences among males and females (p<0.001) (Table 2).
Table 2: Descriptive Statistics for Trochlear Breadth of Right Talus in Males and Females.
Age GP (YRS) Male Female
Mean ± SD(cm) 95% CL(cm) Mean ± SD(cm) 95% CL (cm) 20 -29
30 -39 40 -49 50 -59 60 -69
3.61±0.28 3.74±0.24 3.69±0.34 3.63±0.24 3.55±0.20
3.46-3.75 3.61-3.88 3.51-3.87 3.51-3.75 3.44-3.66
3.28±0.22*** 3.31±0.21*** 3.26±0.22*** 3.14±0.20*** 3.06±0.25***
3.17-3.40 3.20-3.43 3.15-3.37 3.04-3.24 2.92-3.20 SD=Standard Deviation; CL=Confidence Limit; GP=Group; P=Probability; CM=Centimeter, *** = P<0.001
3.2 Analysis of the Results for Trochlear Breadth of the Left Talus in Males and Females
The TLB of the left talus between male and female was compared. It was observed that male value ranged from 3.51cm at 60-69 years’ age group to 3.71 cm at 30-39
years’ age group: while female mean value ranged from 3.05 cm at 60 - 69 years’ age group to 3.30 cm at 30-39 years’ age group with significant differences (p<0.001) among males and females (Table 3).
Table 3: Descriptive Statistics for Trochlear Breadth of Left Talus in Males and Females.
Age GP (Yrs)
Male Female
Mean ± SD (cm) 95% CL (cm) Mean ± SD (cm) 95% CL (cm) 20-29
30-39 40-49 50-59 60-69
3.59±0.21 3.71±0.28 3.65±0.32 3.61±0.28 3.51±0.21
3.48-3.70 3.56-3.87 3.49-3.82 3.47-3.79 3.40-3.63
3.24±0.24*** 3.30±0.21*** 3.20±0.19*** 3.11±0.21*** 3.05±0.21***
3.12-3.36 3.19-3.42 3.10-3.30 3.00-3.22 2.94-3.17 SD=Standard Deviation; CL=Confidence Limit; GP=Group; P=Probability; CM=Centimeter *** = P<0.001
3.3 Analysis of the Results for the TLB of the Right and Left Talus in Males
The TLB of the right and left talus in male was compared. It was observed that right mean value ranged from 3.55 cm at 60-69 years’ age group to 3.74cm at
30-39 years’ age group: while left mean value ranged from 3.51 cm at 60-69 years’ age group to 3.71cm at 30-39 years’ age group with significant differences (p>0.05) among males and females (Table 4).
Table 4: Descriptive Statistics for the TLB of the Right and Left Talus in Males.
Age GP (Yrs) Right Left
Mean ± SD (cm) 95% CL (cm) Mean ± SD (cm) 95% CL (cm) 20-29
30-39 40-49 50-59 60-69
3.61±0.28 3.74±0.24 3.69±0.34 3.63±0.24 3.55±0.20
3.46-3.75 3.61-3.88 3.51-3.87 3.51-3.75 3.44-3.66
3.59±0.21 NS 3.71±0.28 NS 3.65±0.32 NS 3.61±0.28 NS 3.51±0.21 NS
3.48-3.70 3.56-3.87 3.49-3.82 3.47-3.76 3.40-3.63
SD=Standard Deviation; CL=Confidence Limit; GP=Group; P=Probability; CM=Centimeter; NS= Not Significant
3.4 Analysis of the Results for the TLB of the Right and Left Talus in Females
The TLB of the right and left talus in female was compared. It was observed that right mean value ranged from 3.06cm at 60-69 years’ age group to 3.31cm at
Table 5: Descriptive Statistics for the TB of the Right and Left Talus in Females.
Age GP (yrs)
Right Left
Mean ± SD (cm) 95% CL (cm) Mean ± SD (cm) 95% CL (cm) 20-29
30-39 40-49 50-59 60-69
3.28±0.22 3.31±0.21 3.26±0.22 3.14±0.20 3.06±0.25
3.17-3.40 3.20-3.43 3.15-3.37 3.04-3.24 2.92-3.20
3.24±0.24 NS 3.30±0.21 NS 3.20±0.19 NS 3.11±0.21 NS 3.05±0.21 NS
3.12-3.36 3.19-3.42 3.10-3.30 3.00-3.22 2.94-3.17
SD=Standard Deviation; CL=Confidence Limit; GP=Group; P=Probability; CM=Centimeter; NS= Not Significant
3.5 DP and ISD for TLB of the Right Talus for Male and Female
DPs for the male TLB of the right talus ranged from >3.74cm at 50-59 years’ age group to >4.15cm at 30-39 years’ age group: while the DPs for the female ranged from <2.67cm at 40-49 years’ age group to <3.02cm at
30-39 years’ age groups. ISD at 20-29 years’ age group was 110.06, 30-39 years’ age group was 112.99, 40-49 years’ age group was 113.19, 50-59 years’ age group was 115.61 and 60-69 years’ age group was 116.01 (Table 6).
Table 6: The DP and ISD for TLB of the Right Talus for Males and Females.
Age GP (Yrs)
Male Female
D.P (cm) ISD Mean ± SD (cm) CR (cm) D.P(cm) Mean ± SD (cm) CR (cm)
20-29 30-29 40-49 50-59 69-69
3.61±0.28 3.74+0.24 3.69±0.34 3.63±0.24 3.55±0.20
2.77-4.45 3.02-4.46 2.67-4.71 2.91-4.35 2.95-4.15
>3.94 >4.15 >3.92 >3.74 >3.81
3.28±0.22 3.31±0.28 3.26±0.22 3.14±0.20 3.06±0.25
2.62-3.94 2.47-4.15 2.60-3.92 2.54-3.74 2.31-3.81
<2.77 <3.02 <2.67 <2.91 <2.95
110.06 112.99 113.19 115.61 116.01 SD=Standard Deviation; D.P=Demarking Point; ISD=Index of Sexual Dimorphism; CM=Centimeter; YRS= years; GP= Group; CR=Calculated Range.
3.6 The DP and ISD for TLB of the Left Talus for Male and Female
DP for the male TLB of the left talus ranged from >3.68cm at 60-69 years’ age group to >3.96cm at 20-29 years’ age group: while the DPs for the female ranged
from <2.69cm at 40-49 years’ age group to <2.96cm at 20-29 years’ age group. ISD at 20-29 years’ age group was 110.80, 30-39 years’ age group was 112.42, 40-49 years’ age group was 114.06, 50-59 years’ age group was 116.06 and 60-69 years’ age group was 115.08 (Table7).
Table 7: The DP and ISD for TLB of the Left Talus for Male and Female.
Age GP (Yrs) Male Female D.P (cm) ISD
Mean ± SD (cm) CR (cm) D.P (cm) Mean ±SD (cm) CR (cm) 20-29
30-39 40-49 50-59 60-69
3.59±0.21 3.71±0.28 3.65±0.32 3.61±0.28 3.51±0.21
2.96-4.22 2.87-4.55 2.69-4.61 2.77-4.41 2.88-4.14
>3.96 >3.93 >3.77 >3.74 >3.68
3.24±0.24 3.30±0.21 3.20±0.19 3.11±0.21 3.05±0.21
2.52-3.96 2.67-3.93 2.63-3.77 2.48-3.74 2.42-3.68
<2.96 <2.87 <2.69 <2.77 <2.88
110.80 112.42 114.06 116.06 115.08 SD=Standard Deviation; D.P=Demarking Point; ISD=Index of Sexual Dimorphism; CM=Centimeter; YRS= years; GP= Group; CR=Calculated Range.
3.7 Comparison of the Troclear Breadth (TLB) between age groups
Table 8: Descriptive Statistics for TB in both sexes among 20-29 & other Age Groups (Yrs).
Sex
20-29 Years 30-39 Years
Mean ± SD (cm) 95%CL (cm) Mean ± SD (cm) 95%CL (cm)
Males 3.60±0.01 3.47-3.73 3.75±0.02NS 3.53-3.92
Females 3.26±0.03 3.01-3.51 3.31±0.01NS 3.24-3.37
20-29 Years 40-49 Years
Males 3.60±0.01 3.47-3.73 3.67±0.03NS 3.42-3.92
Females 3.26±0.03 3.01-3.51 3.23±0.04NS 2.85-3.61
20-29 Years 50-59 Years
Males 3.60±0.01 3.47-3.73 3.62±0.01NS 3.49-3.75
Females 3.26±0.03 3.01-3.51 3.13±0.02* 2.93-3.32
20-29 Years 60-69 Years
Males 3.60±0.01 3.47-3.73 3.53±0.03 NS 3.28-3.78
Females 3.26±0.03 3.01-3.51 3.06±0.01** 2.99-3.12
SD=Standard Deviation; CM=Centimeter; TLB=Trochlear Breadth, *** = P<0.001, ** = P<0.01, * = P<0.1 and NS = Not Significant
The TLB of the talus in both sexes was compared among 30-39 and other age groups. It was observed that the
difference was significant at 50-59 years age group and above in both sexes. (Table 9).
Table 9: Descriptive Statistics for TB in both sexes among 30-39 & other Age Groups (Yrs). Sex
30-39 Years 40-49 Years
Mean ± SD (cm) 95% CL (cm) Mean ± SD (cm) 95% CL (cm)
Males 3.73±0.02 3.53-3.92 3.67±0.03NS 3.42-3.92
Females 3.31±0.01 3.24-3.37 3.23±0.04 NS 2.85-3.61
30-39 Years 50-59 Years
Males 3.73±0.02 3.53-3.92 3.62±0.01** 3.49-3.75
Females 3.31±0.01 3.24-3.37 3.13±0.02** 2.93-3.32
30-39 Years 60-69 Years
Males 3.73±0.02 3.53-3.94 3.53±0.03** 3.28-3.78
Females 3.31±0.01 3.24-3.37 3.06±0.01*** 2.99-3.12
SD=Standard Deviation; CM=Centimeter; TLB=Trochlear Breadth, *** = P<0.001, ** = P<0.01, * = P<0.1 and NS = Not Significant.
The TLB of the talus in both sexes was compared among 40-49 and other age groups. It was observed that the
difference was significant at 60-69 years age group and above in males and females (Table 10).
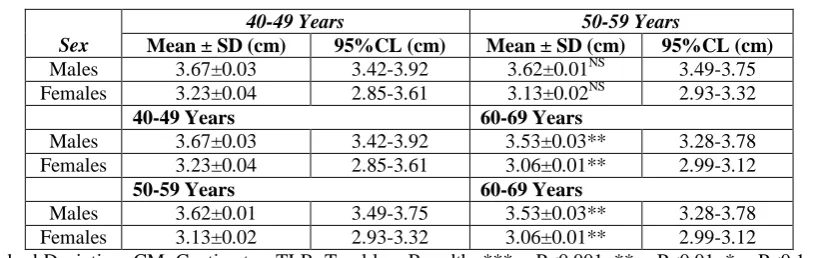
Table 10: Descriptive Statistics for TB in both sexes among 40-49 & other Age Groups (Yrs).
Sex
40-49 Years 50-59 Years
Mean ± SD (cm) 95%CL (cm) Mean ± SD (cm) 95%CL (cm) Males 3.67±0.03 3.42-3.92 3.62±0.01NS 3.49-3.75 Females 3.23±0.04 2.85-3.61 3.13±0.02NS 2.93-3.32
40-49 Years 60-69 Years
Males 3.67±0.03 3.42-3.92 3.53±0.03** 3.28-3.78 Females 3.23±0.04 2.85-3.61 3.06±0.01** 2.99-3.12
50-59 Years 60-69 Years
Males 3.62±0.01 3.49-3.75 3.53±0.03** 3.28-3.78 Females 3.13±0.02 2.93-3.32 3.06±0.01** 2.99-3.12
SD=Standard Deviation; CM=Centimeter; TLB=Trochlear Breadth, *** = P<0.001, ** = P<0.01, * = P<0.1 and NS = Not Significant
4. DISCUSSION
It was observed from the present study that the mean trochlear breadth of the talus was significantly greater in males than females of the same age in all the age groups. The average value for male trochlear breadth of the talus was 3.55 cm against 3.11 cm in females. Theses value
impact on the ankle joint which can directly affect the growth of the talus.
From this study, it was deduced that the mean trochlear breadth of the talus changed with age. The differences between age group were statistically significant in some age groups. The difference in trochlear breadth between 20-29 years group and 60-69 year age group were significant (P<0.01), while between the 30-39 years group and 60-69 years age group were highly significant (P<0.001) in both sexes. The trochlear breadth showed the highest value at the 30-39 years group which could be attributed to the fact that bone like any other organ grows as the individual grows. Bones continuously undergo a vigorous process of resorption and deposition known as bone metabolism. Both the rate of bone resorption and deposition depends on age [13]. At about 20 to 30 years of age, the rate of bone deposition exceeds the rate of bone resorption that leads to bone growth at this age range. At about 30 to 40 years, the rate of deposition is approximately equal to the rate of bone resorption, as such, bone maintained the highest status at this age range which suggest why trochlear breadth of the talus showed the highest value between 30-39 years age group in this study. At 50 years and above, the rate of bone resorption exceeds the rate of bone deposition which leads to the reduction in the size and mass of bones as was observed in this work. It should be noted that the rate of bone resorption and deposition depend on certain factors such as nutrition, lifestyle, exercise, occupation etc.
These two factors affect the rate of calcium assimilation from the gut; as such increase the rate of bone resorption and reduce the rate of bone absorption, thereby reducing the size and mass of the bones as age progresses.[14]
The comparison of the right and left side indicated that male mean trochlear breadth of the right talus differs insignificantly from the left. The average value of the right trochlear breadth was 3.64 ± 0.24 cm against 3.52 ± 0.21 cm of the left talus in males. The average value of the right trochlear breadth was 3.24 ± 031cm against 3.13 ± 0.23 cm of the left in females. [15] Found that in the late byzantine era, talus has no significant side differences in talar articular facets. [16] Observed that the trochlear surface of the right talus was insignificantly greater than the left side.[17,18] observed insignificant side differences in both the anteroposterior length and transverse breadth of talus in north eastern Nigerian. These studies are in agreement with the present study which showed a slight but insignificant difference between the right and the left talus. The mean trochlear breadth of both sexes on both sides was seen to be highest at 30-39 years age group, but lowest at 60-69 years age group. It was also observed to have increased slightly from 20 years to 49 years, but maintained a close range as the value decreases down to the last age group. It was also observed that the trochlear breadth was sexually dimorphic since the demarking points of male
trochlear breadth were all higher than those of the females. Index of sexual dimorphism confirms that males trochlear breadth were all greater than females trochlear breadth as index of sexual dimorphism were all greater than 100 in all the age groups.
This sex difference can be as a result of genetic and environmental factors affecting growth and development (nutrition, physical activities, hormones and pathologies), or the interaction of these factors.[9] These parameters placed talus as a useful bone in sex determination among adult north-eastern Nigerians particularly where other bones commonly used for sex determination of individual from skeletal remains such as pelvic and skull are not found. The measurements of the talus for identification of sex by several researchers is not applicable to all regions, because of variations as observed by[19] in culture, diet, heredity, climate and other geographical conditions.[20,21] Also stated that the human body dimension can be affected by cultural, geographical, gender and age factor.
Limitation of this study being a retrospective study; minimal bias can be introduced, hence prospective study is recommended and also abnormal radiographs either due to fractures or bone diseases as well as normal radiographs of individuals less than 18 years of age were excluded from the measurements, because the study focused on normal adult Nigerians.
5. CONCLUSION
The result of the present study showed that, parameters of TB of talus were all greater in males than females (p<0.001). It was also observed that the TB changed with age, and the changes differ significantly between some age groups. ISD were also calculated, and it was observed that all parameters were found to be greater than 100. This showed that male had higher values over their female counterparts of the same age group. Hence the study of bones morphology is of used from region to region, because of these numerous factors in sex determination. Further work on the talus is required on the southern and other parts of Nigeria and this may be the reason why population specific standards must be developed for sex differentiation in Nigeria.
Ethical Approval
All authors hereby declare that all radiographs and measurement protocol have been examined and approved by the ethical committee of the University of Maiduguri Teaching Hospital (UMTH) and have therefore been performed in accordance with the ethical standards laid down in the 1964 Declaration of Helsinki.”
Competing Interests
REFERENCES
1. Bidmos M, Dayal M. and Asala S. Sex determination from the Talus of South African Whites by Discriminate Function Analysis. The American Journal of Forensic Medicine and Pathology, 2003; 24(4): 322-328.
2. Torres B. Population and Sex Determination Based on Measurements of the Talus. Journal of Biological Anthropology, 2010; 2: 1.
3. Davivongs V. The Pelvic Girdle of the Australian Aborigines; Sex difference and Sex Determination. American Journal of Physical Anthropology, 1963; 21: 443-445.
4. Jit I. and Singh S. Sexing of the adult Clavicle. Indian Journal of Medical Research, 1966; 54: 551-571.
5. Singh S. and Gangrade K. Sexing of adult Clavicle Verification and Applicability of Demarking point. Journal of Indian Academy of Forensic Science, 1968; 7: 20-30.
6. Singh P. and Singh S. Identification of Sex from the Humerus. Indian Journal of Medical Research, 1972; 60: 1061-1066.
7. Ari I. and Kafa M. Bone Length Estimation of Calcaneus and Talus. Coll. Antropol, 2009; 33(2); 613-618.
8. Kumar A, Tyagi A. and Aggarwal N. Sex determination by morphology of talus bone. Journal of Forensic Medicine and Toxicology, 2008; 25: 1. 9. Kafa M, Liker M. and Liknur A. Bone length
estimation and population specific feature of talus of the late Byzantine. Forensic Science international, 2009; 2: 613-618.
10. Ryan S, Michelle N and Stephen E. Anatomy for Diagnostic Imaging 2nd ed. Toroto, 2005; 609-615. 11. In Stat 3 Graph pad Graphpad software, inc. San
Diego California USA, 2003.
12. Marin V, Jelena D, Zeljko D, Dair M. Determination of sex by discriminant function analysis of mandibles from two Croatian archaeological sites. Acta Stonatology of Croatia, 2006; 40(3): 263-277. 13. Giles, E., and Elliot. O. Sex determination by
discriminant function analysis of crania. American Journal of Physical Anthropology, 1963; 21: 53-68. 14. Hollenbach KA, Barrett-Connor E, Edelstein SL,
Holbrook T. Cigarette smoking and bone mineral density in older men and women. Am J Public Health, 1993; 83: 1265-1270.
15 Oygulu O, Wafa M. and Ragaa M. Pelvic girdle assessment: sex determination from skeletal remains of Indian population. Forensic Science International, 2007; 125: 134-136.
16 Kafa, M., Iiker, M. and Iiknur, A.Bone length estimation and population specific feature of talus of the late Byzantine. Forensic Science international, 2009; 2: 613-618.
17 Eduitem SO, Aminu AA, Danladi SA, Zainab M, Jacks TW, Martha A. Estimation of Sex using antero-posterior dimension of talus in northeastern
Nigerians. British Journal of Medicine and Medical Research, 2016; 14(3): 1-8.
18 Eduitem S Otong, Aminu A Rufai, Danladi S. Amaza, Zainab Mustapha, Tamunotonye W Jacks and Sani A Bello Estimation of sex using transverse breadth of talus in north eastern Nigerians. International Journal of Medicine Research, 2016; 1(5): 14-19.
19 Kipper G. Determination of sex from femora. Forensic Sci. International, 2002; 113: 315-321. 20 Steele D. The estimation of sex on the basis of the
talus and calcaneus American Journal of Physical Anthropology, 2005; 45: 581-588.