R E S E A R C H A R T I C L E
Open Access
A rank weighted classification for plasma
proteomic profiles based on case-based
reasoning
Amy M. Kwon
Abstract
Background:It is a challenge to precisely classify plasma proteomic profiles into their clinical status based solely on their patterns even though distinct patterns of plasma proteomic profiles are regarded as potential to be a biomarker because the profiles have large within-subject variances.
Methods:The present study proposes a rank-based weighted CBR classifier (RWCBR). We hypothesized that a
CBR classifier is advantageous when individual patterns are specific and do not follow the general patterns like proteomic profiles, and robust feature weights can enhance the performance of the CBR classifier. To validate RWCBR, we conducted numerical experiments, which predict the clinical status of the 70 subjects using plasma proteomic profiles by comparing the performances to previous approaches.
Results: According to the numerical experiment, SVM maintained the highest minimum values of Precision and Recall, but RWCBR showed highest average value in all information indices, and it maintained the smallest standard deviation in F-1 score and G-measure.
Conclusions:RWCBR approach showed potential as a robust classifier in predicting the clinical status of the subjects for plasma proteomic profiles.
Keywords:Case-based reasoning, Plasma proteomic profiles, Classification, Rank
Background
Case-based reasoning (CBR) is an artificial intelligent approach based on an inference technique that is said to be the most effective method to construct an expert system [1]. When a target case occurs, CBR is mainly performed according to the following four procedures: retrieving, reusing, revising and retaining [2,3]. It solves a target problem by revising the solution with the previous cases in similar situations retrieved from the case-base, and the target case is retained in the case-base for the next problem once the problem is solved. Thus, up-to-date case-base is always maintained in CBR system. The CBR system has been applied in many learning or problem-solving techniques of real-world applications. In particular, the prediction techniques based on CBR can be more appropriate in bio-medical field than other fields because
CBR has less risk of overfitting in prediction, and medical cases can’t be often explained by general patterns of the case-base. It is important to classify the plasma proteomic profiles solely depending on their shapes because their distinct patterns of profiles are regarded as a potential bio-marker according to clinical status [4]. However, plasma proteomic profiles may be a typical example not following the general patterns which lead to poor accuracies in prediction by classification methods based on overall means of similarity due to large within-subject variance, and there is no gold standard to analyze the plasma proteomic profiles yet. The present study conducts a CBR based classification method with the plasma proteomic profiles which does not make decision for classification depending on the overall mean. However, CBR often also shows lower prediction performance compared to other learning techniques. Previous studies proposed some methods to improve the performance of CBR. Those stud-ies were primarily focused on either weight optimization
Correspondence:[email protected]
Big Data Science, Division of Economics & Statistics, College of Public Policy, Korea University, Sejong, Korea
methods [5–9] or feature (or subset) selection methods [10, 11], and one study proposed a hybrid generic approach to optimize the both with the number of neigh-bor cases to compute in the case retrieval procedure of CBR [12]. The meaningful set of features is often predeter-mined by experts in bio-medical fields, and the most simi-lar case may result in the best accuracy in prediction when output values of each feature are wide-spread like plasma proteomic profiles. If that is the case, a proper weight optimization may only enhance the prediction performance of CBR. The weights are optimized either subjectively or objectively. Subject weights are typically allocated according to the preference scores or informa-tion of experts such as Delphi method [5]. Objective weights can be allocated by entropy method [7], statistical method [8] or they can be optimized while proceeding algorithms such as generic algorithm (GA) [12] or neural-net (NN) [6]. Among these approaches, NN needs a large number of inter-connected neurons to allocate weights, so small or moderate-size samples may not attain a standard structure of NN [9]. GA is also criticized due to premature convergence or low reliability [9]. A weight by a statistical method was allocated by the proportion of Wald’s statis-tics [8] which is obtained by assuming asymptotically nor-mal distributions of parameters. The present study proposes a non-parametric weight allocation method without using normality assumption. We investigate the accuracy of a CBR based classification with plasma prote-omic profiles to diagnose cervical cancer, and observe the enhancement of the prediction performance of the CBR classifier by allocating feature weights. To validate our ap-proach, we also conduct previous weight allocation methods for the CBR classifier together with the plasma proteomic profiles. The paper is organized as follows. After introduction, section 2 briefly describes the CBR system and reviews previous studies. Section 3 presents
the proposed method using Rank, and section 4 describes our data schemes and empirical results. At last, the con-clusion and further research are discussed in section 5.
Methods
The CBR classifier with plasma proteomic profiles
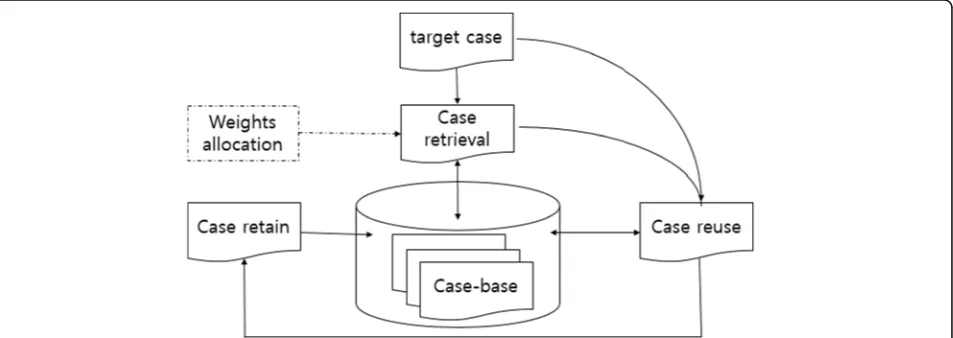
The general problem-solving process by the CBR classifier is described in Fig.1. The CBR classifier describes a target problem using old experiences, and finds a solution of the problem by retrieving similar cases stored in the case-base to the target problem where the case-base is the specific knowledge base of past experiences. The case is typically retrieved by learning techniques for the CBR classifier, and the most common technique is k-nearest neighbor (NN). The original CBR classifier uses 1-NN which retrieves the most similar case from the case-base to the target problem. The problem is adapted from the retrieved cases, and is revised. Once the problem is solved, the cases are retained. The CBR classifier with plasma proteomic profiles maintained the same scheme. The problem is to identify the class of a target case by comparing the pattern of the target case with those in the case-base where the case-base consists of trained samples with their class-labels. The case is retrieved from the case-base byk -near-est neighbor (NN) to solve the problem, and the target case as well as the retrieved case are stored in the case-base once the class of the target case is determined.
Prior studies for weight optimization
The original classifier assesses the similarity of a target case with cases in the case-base under the assumption that all features are equally likely important. However, it may be practical to think of the relative importance among the features, so some researches differently allocated the weights on features considering the relative importance. Since different weights for the attributes
can vary the distribution of the overall similarities among the cases, the retrieved cases by the CBR classifier can be different depending on the altered distribution of the similarities. Regarding that matter, the weight allocation or optimization is closely related with the performance of the CBR classifier. In particular, the weight allocation or optimization techniques have gained attention as a way to enhance the performance of the CBR classifier in previous studies.
DELPHI method is one of the most common approaches to allocate feature weights to the CBR classifier. DELPHI method directly reflects experts’ opin-ions about the features as the corresponding weights like Gu et al. [13] or Chang et al. [5], so the weights can be changed by the point of view of the subjects. Alterna-tively, weights have been objectively allocated using information gain or entropy. Cardie and Howe [14] first selected a set of relevant features using a decision tree, and assigned the weights with information gain to the feature which was chosen by the tree. Ahn and Kim [12] encoded feature weights with numbers from 0 to 7 which represented the relative importance of the features. These numbers were processed as 3-bit binary numbers and transformed into floating decimal numbers (xf) for weights. Zhao et al. [7] used information entropy
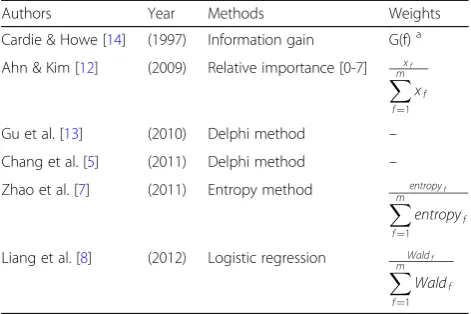
for feature weights to select suppliers. They computed the average regression coefficients to seek the integrated average index of each supplier, and calculated both the information gain in ID3 of the decision tree and the entropy. These values were later standardized as the numbers in the range of [0,1] for weights. Besides, Liang et al. [8] optimized feature weights by a statistical approach. They fitted features with binary logistic regression, and computed the Wald statistics of param-eter estimates for the features. Then, the statistics are standardized by dividing them by the sum of all the statistics before they are allocated to the features as the weights. Suitable weights may vary depending upon problems we encountered. Prior studies about the weight optimization or allocation methods are summa-rized in Table1.
Rank-based weight optimization Distance functions and problem setting
A typical similarity or dissimilarity measure is a distance metric, and it is crucial to learn a good distance metric to represent the similarity or dissimilarity in feature space although there are considerable researches on distance metrics [15–17]. Some researches have been focused on the comparison of their impacts on the performance in classification with known public database [18, 19]. However, no single similarity or dissimilarity showed dominantly superior to the others
in all methods in their studies [18, 19]. Most classifiers try to use a distance metric that keeps data points close if the class labels are the same while keeps distance from the data points if the class labels are different. The goal of the CBR classifier is to predict a class label of a target case of !x0 by retrieving the most similar case from the case-base using the proper distance metric. Letχ¼ f!x1 ;⋯;!xng be a collection of n data points in the
case-base with the known class labels of C= {c1,⋯,cn} where
x !
i∈Rm and ci∈{1,⋯,K}. The CBR classifier typically
adapts the k-NN approach to retrieve the similar cases to the target case with a givenk. Thek-NN approach as-sumes that the class conditional probability in the near-est neighbors to !x0;Nð!x0Þ, is constant, and tries to maintain consistency in predicting class labels for!x0 by obtaining its neighborhood as follows where I(·) is an in-dicator function.
p j x!0
¼
Pn
i¼1I x!i∈N x!0
I cið ¼ jÞ
Pn
i¼1I x!i∈N x!0
ð1Þ
The global distance between the target case and any case in the case-base is computed by summing up the local distances to determine the nearest neighbors for the target case on Eq. (1). The local distance is computed for each feature between the target case and any case in the case-base by the pre-defined local distance metric, and the types of local distance metric do not have to be the same among the features. Euclid-ean distance metric is typically used to compute the physical distance between the two data points, but it suffers in the case that vectors of data points aren’t linearly distributed like default measurements of proteomic profiles. On the contrary, Fre’chet distance metric is known to be useful to measure the distance between the data points when the vectors of those data
Table 1Prior studies about the weight optimization methods
Authors Year Methods Weights
Cardie & Howe [14] (1997) Information gain G(f)a
Ahn & Kim [12] (2009) Relative importance [0-7] xf Xm
f¼1
xf
Gu et al. [13] (2010) Delphi method –
Chang et al. [5] (2011) Delphi method –
Zhao et al. [7] (2011) Entropy method entropyf Xm
f¼1
entropyf
Liang et al. [8] (2012) Logistic regression Waldf Xm
f¼1
Waldf
a
indicates information gain of the f-th feature, and entropy is defined as−X
points lie on the non-linear curve [20]. According to the characteristics of the feature types, the distance metric consists of either Euclidean distance metric or Fre’chet distance metric for the present study. Euclidean distance metric and Fre’chet distance metric are defined for the feature, f, as follows where !xðifÞ and !x
ðfÞ
0 are sub-vectors of any data point in the case-base and the target case consisting of the feature, f, respectively.
df !xð Þif ;!x f ð Þ 0
¼ !xð Þif −!x f ð Þ 0
T
x
!ð Þf i −!x
f ð Þ 0
ð2Þ
df !x f
ð Þ
i ;!x f
ð Þ 0
¼ inf
α;β tmax0∈½0;1 d x
!ð Þf
i ðαð Þt0Þ;!x f
ð Þ 0 ðβð Þt0 Þ
ð3Þ
Conversion to rank-order information
Plasma proteomic profiles have the large within-subject variance. Although the class labels are the same, the profiles can be distributed over a considerable extent as well as they are not following the general pattern. We determined the proximity of the cases using the global similarity based on rank-order information of the distances [21] instead of using the distance itself to enhance robustness in predicting the class label of the target case in the present study. The similarity is com-puted as follows where N′is the number of cases having a unique ranking-order in the case-base and ωf is an
unknown weight for a feature off.
S x!i;!x0
¼Xm
f¼1
ωf N
0−rank d
f !xif;!x f 0
N0−1 2
4
3 5 ð4Þ
According to Eq. (4), the higher the rank, the greater the similarity between thei-th case and the target case.
Weight optimization
Every feature is equally likely important to the original CBR classifier. Since the original CBR classifier often showed lower predictability, there have been some researches to improve the predictability by assigning different weights to the features according to their relative importance. In the same line of thoughts, we adopted the different weights to the feature in calculating the similarity, and optimized the weights according to the objective function from Wilcoxon’s rank sum test statistics. The ability of the objective function is mainly influenced by the feature weights, and the weights are determined to maximize the ability of the objective function to differentiate the cases having different class labels. Wilcoxon’s rank sum test is a non-parametric test to assess the difference of the mean ranks for two samples, and it is known to be useful when outliers exist in the observations compared to the parametric tests. The
similarity is regarded as a function of ranks in the present study because the similarity is computed according to the corresponding rank-order informa-tion of the distances for features between the target case and any case in the case-base. Thus, the weights can be naturally allocated to the features in the similarity measure maintaining the same property from the objective function based on Wilcoxon’s rank sum statistics. The objective function for the present study can be summarized as follows where n1 is the
number of cases having the class label of 1 when the class labels are denoted as either 0 or 1 and the number of classes, J, is set to 2.
arg maxωf:f¼1;⋯;m
Xm
f¼1ωfrf
where rf¼
Xn1
i¼1rank
df
x
!ðfÞ
i ;!x
ð0Þ 0
−n1 ðn1þ1Þ
2
constraint to
f
0≤ωf≤1 Xmf¼1ωf ¼1
ð5Þ
On Eq. (5), as the probability increases that the two groups of the cases are truly drawn from the population-cases having the different class labels, the corresponding feature weight ofωf becomes large because the resulted
statistics,W, is large. The significance of the test statis-tics is directly represented by the magnitude of the cor-responding p-value, so the feature weights can be computed using the magnitudes of p-values from the test statistics as follows.
ωf ¼
1−pðjWj≥rfÞ
Pm
f¼11−pðjWj≥rfÞ
ð6Þ
where W denotes the test statistics of the Wilcoxon’s rank sum test. The feature weights from Eq. (6) are used to compute the similarity of Eq. (4).
Application and experiments
of the proteomic profiles was the excess heat capacity (ΔCp), which were recorded at the different
tempera-tures from 45 to 90 °C by incrementally adding 1 °C to the previous measuring temperature. The proteomic profiles were preprocessed prior to the analysis. The excess heat capacity (ΔCp) as the default measurement is
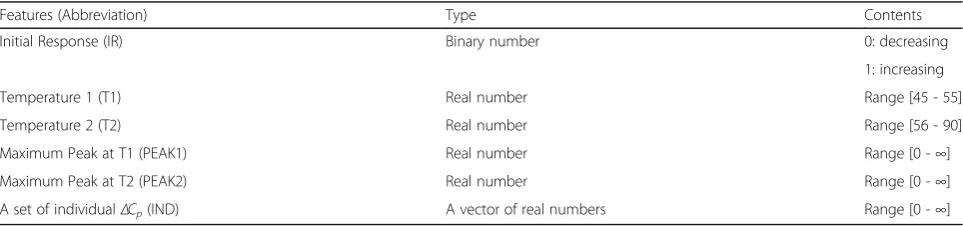
a vector of real numbers of length 451 and it typically shows one or two peaks on the range of temperatures during the experiment. We newly extracted 5 features from the pre-processed data besides the excess heat capacity. The feature information is summarized in Table 2. The class information for each proteomic profile was labeled as either ‘control’ or ‘cancer’ ac-cording to the clinical status of the corresponding sub-ject. On Table 2, PEAK1 and PEAK2 indicate those peaks, and T1 and T2 are temperatures that those peaks occur at where {PEAK1, PEAK2, T1, T2} were estimated by Gaussian kernel regression from the ex-cess heat capacity patterns. IND indicates a set of 451 individual measurement of the excess heat capacity, and IR is a binary value indicating the initial direc-tional tendency of the excess heat capacity as the temperature increases. IR is 1 if the directional ten-dency is positive, 0 otherwise.
Numerical experiments The purpose of the numerical experiments is to study the performance of the CBR classifier in prediction with the plasma proteomic pro-files by comparing with the previous approaches. In par-ticular, we observed whether the rank-based feature weights enhance the performance of the CBR classifier with proteomic profiles or not. As reference methods, two common machine learning methods,k-NN (k-NN) and support vector machine (SVM), a statistical ap-proach using the composite coefficient [23], and three CBR approaches weighted by different allocation methods in previous studies [7, 8] were conducted to validate the performance of the proposed CBR approach for the present study. The number of neighbors for k -NN was 5 which was determined by cross-validation (CV) with training samples, and SVM was conducted based on the radial basis kernel.
The statistical model was introduced to show the dif-ference of the plasma proteomic profiles between two groups having different clinical status using a composite coefficient which was a weighted product of an average probability being in the same group of the reference sample and Pearson’s correlation coefficient. In the present study, this model was conducted with the default setting of the composite coefficient as in the literature [23]. Namely, the reference set was composed with the cases in the‘control’class for this model, and the weight factor of the composite coefficient was set to 1 as described in the literature. This classification model is abbreviated as (SCUCC) indicating statistically classified using the composite coefficient for the experiments as a reference method. Among the CBR approaches, the first model is a classical CBR approach (CLCBR), which gives attributes equal-weights and uses1-NN for the case re-trieval. This model would be the base model to examine the effect of the CBR classifiers having different weights on features. ETCBR and LWCBR are the weighted CBR approaches. The feature weights were allocated with standardized entropy value in ETCBR [7]. In the present study, IR is Berno’ulli and the other features are assumed as normal distribution. The computed entropy was standardized by dividing each entropy by the sum of all entropy values prior to allocation, and 1-NN was used for the case retrieval. LWCBR indicates a weighted CBR approach from logistic regression model. This model adopted standardized Wald statistics of the re-gression coefficients for feature weights by fitting the observation with binary logistic regression. Namely, the Wald statistics were divided by the sum of the all statistics before they were allocated to the features [8], and also used 1-NN for the case retrieval. Logis-tic regression is a typical parametric approach and Wald statistics are derived from the regression coeffi-cients under the asymptotic normal assumption, so this model can be a good reference to observe the performance of the proposed feature weights. The proposed CBR approach is abbreviated as RWCBR indicating a rank-weighted CBR approach. As described in the above sections, the feature weights
Table 2Description of the features
Features (Abbreviation) Type Contents
Initial Response (IR) Binary number 0: decreasing
1: increasing
Temperature 1 (T1) Real number Range [45 - 55]
Temperature 2 (T2) Real number Range [56 - 90]
Maximum Peak at T1 (PEAK1) Real number Range [0 -∞]
Maximum Peak at T2 (PEAK2) Real number Range [0 -∞]
were computed from Wilcoxon’s rank sum test and the most similar case was retrieved as the other CBR approaches.
The data set of proteomic profiles consists of the pre-defined features on Table 2 with 70 subjects, and the class labels are fully given with the number of classes as two. The data set was randomly partitioned into five equal-sized subsets for 5-fold CV. At each fold, a subset was selected as a test set, and the other four subsets be-came a training set where the proportion of the cases were equally distributed from the two classes during the experiments. The feature weights for the ETCBR, LWCBR and RWCBR were estimated with the training set, and the optimized weights were allocated to the fea-tures in the test set.
Results
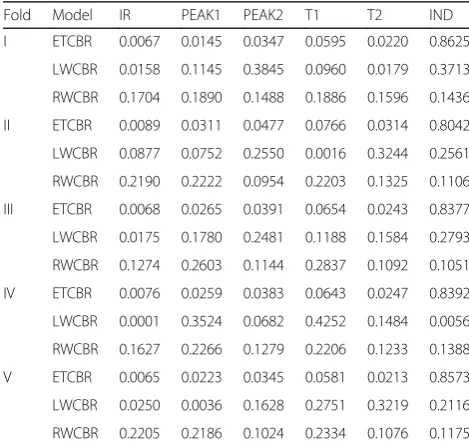
Each fold has the same size of cases in the test set and the training set as 14 and 56, respectively during the experiments. The estimated feature weights by ETCBR, LWCBR and RWCBR at each fold are sum-marized in Table 3. The performances of the seven different models were evaluated at each fold in terms of Precision, Recall, F-1 score, [24, 25] and G-measure [25]. The estimated weights in Table 3 were allocated to the features when the CBR classifiers re-trieved the most similar case from the case-base by ETCBR, LWCBR and RWCBR. The information indi-ces of Precision, Recall, F-1 score and G-measure are defined as follows.
Precesion¼
P
true positive P
true positiveþfalse positive
ð Þ
Recall¼
P
true positive P
true positiveþfalse negative
ð Þ
F‐1 score¼2 precisionrecall precisionþrecall
ð Þ
G‐measure¼pffiffiffiffiffiffiffiffiffiffiffiffiffiffiffiffiffiffiffiffiffiffiffiffiffiffiffiffiffiffiffiffiffiprecisionrecall
With the retrieved case for each target case, the class label of the target case was predicted according to Eq. (1), and the prediction results were used to compute the information indices at each fold according to the above definitions.
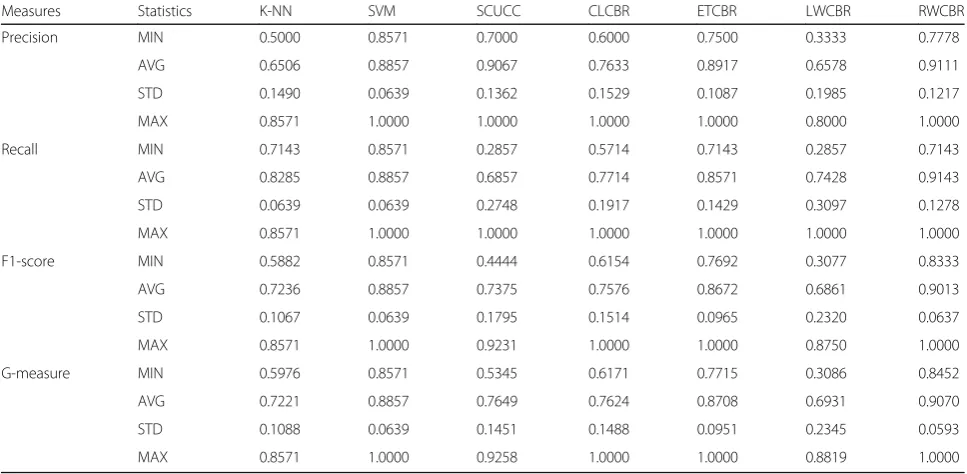
The resulting information indices at each fold are summarized on Table4, and the comprehensive statistics using the minimum (MIN), average, (AVG), standard deviation (STD) and the maximum (MAX) for each index are summarized on Table 5. Among the models, RWCBR and SVM consistently showed good perfor-mances over different sample sets in predicting the class labels with plasma proteomic profiles in comparison with others, but the performance of RWCBR was slightly better. In case of Precision and Recall indices, LWCBR had the biggest range from the minimum of 33% to the maximum of 80% and from the minimum of 29% to the maximum of 100%, respectively while SVM had the smallest range from the minimum of 85.7% to the max-imum of 100% in both indices. However, RWCBR showed the highest average value of 91% among the all models in both Precision and Recall, and the perform-ance was maintained at least 71%. ETCBR and RWCBR showed better performance than CLCBR in both Preci-sion and Recall, but LWCBR worked poor in compari-son with CLCBR by showing lower mean values in all indices although we generally expected a weighted CBR approach to perform better than CLCBR. Comparing CLCBR to SCUCC, a statistical approach, average preci-sion index of CLCBC was lower, but average recall index was higher. F-1 score and G-measure were similar between the two, so it appears that CBR approaches do not always work well with plasma proteomic profiles. Regarding F1-score and G-measure, SVM also main-tained the shortest ranges, but RWCBR showed the best performance at most aspects of summary statistics among the seven models. In particular, it maintained the smallest standard deviations in comparison with the other models.
The retrieved cases for each target case from the test set by RWCBR model at the first fold are displayed on Fig.2. The black solid lines represent the 14 target cases from the test set, and the red solid lines are the most similar cases retrieved from the case-bases according to the similarity measure of Eq. (4).
Table 3Estimated feature weights
Fold Model IR PEAK1 PEAK2 T1 T2 IND
I ETCBR 0.0067 0.0145 0.0347 0.0595 0.0220 0.8625
LWCBR 0.0158 0.1145 0.3845 0.0960 0.0179 0.3713
RWCBR 0.1704 0.1890 0.1488 0.1886 0.1596 0.1436
II ETCBR 0.0089 0.0311 0.0477 0.0766 0.0314 0.8042
LWCBR 0.0877 0.0752 0.2550 0.0016 0.3244 0.2561
RWCBR 0.2190 0.2222 0.0954 0.2203 0.1325 0.1106
III ETCBR 0.0068 0.0265 0.0391 0.0654 0.0243 0.8377
LWCBR 0.0175 0.1780 0.2481 0.1188 0.1584 0.2793
RWCBR 0.1274 0.2603 0.1144 0.2837 0.1092 0.1051
IV ETCBR 0.0076 0.0259 0.0383 0.0643 0.0247 0.8392
LWCBR 0.0001 0.3524 0.0682 0.4252 0.1484 0.0056
RWCBR 0.1627 0.2266 0.1279 0.2206 0.1233 0.1388
V ETCBR 0.0065 0.0223 0.0345 0.0581 0.0213 0.8573
LWCBR 0.0250 0.0036 0.1628 0.2751 0.3219 0.2116
Table 4Information indices by 5-Fold CV
Fold Measures K-NN SVM SCUCC CLCBR ETCBR LWCBR RWCBR
I Precision 0.5000 0.8571 1.0000 0.6667 1.0000 0.8000 1.0000
Recall 0.7143 0.8571 0.2857 0.5714 0.7143 0.5714 0.7143
F1-score 0.5882 0.8571 0.4444 0.6154 0.8333 0.6667 0.8333
G-measure 0.5976 0.8571 0.5345 0.6171 0.8452 0.6761 0.8452
II Precision 0.8571 0.8571 1.0000 0.8000 0.7500 0.3333 1.0000
Recall 0.8571 0.8571 0.8571 0.5714 0.8571 0.2857 0.8571
F1-score 0.8571 0.8571 0.9231 0.6667 0.8000 0.3077 0.9231
G-measure 0.8571 0.8571 0.9258 0.6761 0.8018 0.3086 0.9258
III Precision 0.6000 0.8571 0.8333 0.7500 0.8333 0.7778 0.7778
Recall 0.8571 0.8571 0.7143 0.8571 0.7143 1.0000 1.0000
F1-score 0.7059 0.8571 0.7692 0.8000 0.7692 0.8750 0.8750
G-measure 0.7171 0.8571 0.7715 0.8018 0.7715 0.8819 0.8819
IV Precision 0.7500 1.0000 1.0000 1.0000 0.8750 0.7778 1.0000
Recall 0.8571 1.0000 0.5714 1.0000 1.0000 1.0000 1.0000
F1-score 0.8000 1.0000 0.7273 1.0000 0.9333 0.8750 1.0000
G-measure 0.8018 1.0000 0.7559 1.0000 0.9354 0.8819 1.0000
V Precision 0.5455 0.8571 0.7000 0.6000 1.0000 0.6000 0.7778
Recall 0.8571 0.8571 1.0000 0.8571 1.0000 0.8571 1.0000
F1-score 0.6667 0.8571 0.8235 0.7059 1.0000 0.7059 0.8750
G-measure 0.6838 0.8571 0.8366 0.7171 1.0000 0.7171 0.8819
Table 5Comprehensive statistics for information indices
Measures Statistics K-NN SVM SCUCC CLCBR ETCBR LWCBR RWCBR
Precision MIN 0.5000 0.8571 0.7000 0.6000 0.7500 0.3333 0.7778
AVG 0.6506 0.8857 0.9067 0.7633 0.8917 0.6578 0.9111
STD 0.1490 0.0639 0.1362 0.1529 0.1087 0.1985 0.1217
MAX 0.8571 1.0000 1.0000 1.0000 1.0000 0.8000 1.0000
Recall MIN 0.7143 0.8571 0.2857 0.5714 0.7143 0.2857 0.7143
AVG 0.8285 0.8857 0.6857 0.7714 0.8571 0.7428 0.9143
STD 0.0639 0.0639 0.2748 0.1917 0.1429 0.3097 0.1278
MAX 0.8571 1.0000 1.0000 1.0000 1.0000 1.0000 1.0000
F1-score MIN 0.5882 0.8571 0.4444 0.6154 0.7692 0.3077 0.8333
AVG 0.7236 0.8857 0.7375 0.7576 0.8672 0.6861 0.9013
STD 0.1067 0.0639 0.1795 0.1514 0.0965 0.2320 0.0637
MAX 0.8571 1.0000 0.9231 1.0000 1.0000 0.8750 1.0000
G-measure MIN 0.5976 0.8571 0.5345 0.6171 0.7715 0.3086 0.8452
AVG 0.7221 0.8857 0.7649 0.7624 0.8708 0.6931 0.9070
STD 0.1088 0.0639 0.1451 0.1488 0.0951 0.2345 0.0593
MAX 0.8571 1.0000 0.9258 1.0000 1.0000 0.8819 1.0000
Conclusion and Discussion
Plasma proteomic profiles have been regarded as a potential biomarker to diagnose certain diseases according to their specific patterns. It is challenging to precisely predict the clinical status based solely on the patterns of profiles because some profiles do not frequently follow the general patterns, which leads to large within-subject variance. The prediction based on CBR based approaches may be effective in that case. The CBR classifier predicts the clinical status of a target case by retrieving the most similar case from the case-base, so it would be advantageous in prediction because it can avoid the risk to make decision according to deviated overall means due to the outlying pattern. However, CBR classifier often shows low predictability, and some studies made efforts to enhance the predictability using weight optimization for features. There is still no golden standard to optimize or allocate the feature weights, which can be dependent upon the characteristics of the data we encounter.
The present study suggests a rank-based weighted CBR classifier (RWCBR) to predict the clinical status of plasma proteomic profiles. The rank-based weighted CBR classifier uses a weighted similarity based on rank-order information of distance metrics to retrieve the most similar case from the case-base where the feature weights are optimized from Wilcoxon’s rank sum statistics. We conducted numerical experiments to validate the performance of RWCBR. As reference methods, two machine learning techniques, k-NN and SVM, a statistical method, SCUCC, a classical CBR (CLCBR) and two differently weighted CBR, ETCBR and LWCBR methods were compared in terms of Precision, Recall, F-1 score and G-measure. According to the results, SVM showed the lowest standard deviation and the high-est minimum value for Precision, Recall, but RWCBR
outperform in average value in all information indices, and it maintained the lowest standard deviation in F-1 score and G-measure. Also, LWCBR showed lower per-formance than CLCBR in most information indices. A weighted CBR approaches do not always perform well, so the weight allocation or optimization methods should take into accounts the characteristics of the data set to enhance the performance of CBR classifier.
The sample size of the plasma proteomic profiles was small in the present study. However, RWCBR approach showed potential to predict the clinical status based solely on plasma proteomic profiles as a robust classifier over different sample sets in the present study.
Abbreviations
AVG:Average; CBR: Case-based reasoning; CLCBR: Classical CBR; CV: Cross-Validation; ETCBR: Entropy-based CBR; k-NN: k-Nearest neighbor; LWCBR: Logistic regression-based Weighted CBR; MAX: The maximum; MIN: The minimum; RWCBR: Rank-based Weighted CBR; SCUCC: Statistically classified using composite coefficient; STD: Standard deviation; SVM: Support vector machine
Acknowledgements
We thank Assistant Professor NC Garbett at James Graham Brown Cancer Center in the University of Louisville for providing us with the data set and valuable comments. Also, we give thanks to Assistant Professor M. Ouyang at U Mass Boston for thorough scientific reviews and valuable comments.
Funding
This work was supported by the Korea University, Sejong, Korea [K1720701, 2017], and also supported by College of Public Policy, Korea University, Sejong, Korea [K1729001, 2018].
Availability of data and materials
The dataset for the current study are not publicly available due to the repository policy from the institute at this moment.
Author’s contributions
AMK do the model development, the numerical experiment and manuscript writing. The author read and approved the final manuscript.
Ethics approval and consent to participate
The study protocol was approved by the institutional review board of the University of Louisville in regard to the collection of the original data, and informed consent forms were voluntarily signed by the all participants [IRB\# 08.0108, 608.03]. All information about the subjects had been de-identified from the stage of data collection, and the de-identified data set was directly provided by the principal investigator only for the purpose of methodological development research, and the administrative permission will be required to access the raw data from the principal investigator, Dr. Garbett NC as well as the administrative policy corresponding with James Brown Graham Cancer center. The data was the secondary data for this study, and particular procedure of ethics approval for data analysis was not required.
Competing interests
The author declares that she has no competing interests.
Publisher’s Note
Springer Nature remains neutral with regard to jurisdictional claims in published maps and institutional affiliations.
Received: 26 June 2017 Accepted: 3 May 2018
References
1. Burke EK, MacCarthy B, Petrovic S, MacCarthy B, Petrovic S, Qu R. Structured cases in case-based reasoning-re-using and adapting cases for time-tabling problems. Knowledge Based Syst. 2000;13:159–65.
2. Althoff KD, Auriol E, Barletta R, Manago M. A review of industrial case-based reasoning tools, an AI perspective report. AI intelligence; 1995. p. 3–4. 3. Aamodt A, Plaza E. Case-based reasoning: foundational issues,
methodological variations and system approach. AI Commun. 1994;7:39–59. 4. Garbett NC, Miller JJ, Jenson AB, Chaires JB. Calorimetry outside the box a
new window into the plasma proteome. Biophys J. 2008;94:1377–83. 5. Chang WL. A CBR-based Delphi model for quality group decisions. Cybern
Syst. 2011;42:402–14.
6. Huang YS, Chiang CC, Shieh JW, Grimson E. Prototype optimization for nearest-neighbor classification. Pattern Recogn. 2002;35:1237–45. 7. Zhao K, Yu X. A case-based reasoning approach on supplier selection in
petroleum enterprises. Expert Syst Appl. 2011;38:6839–47.
8. Liang C, Gu D, Bichindaritz I, Li X, Zuo C, Cheng W. Integrating gray system theory and logistic regression into case-base reasoning for safety assessment f thermal power plants. Expert Syst Appl. 2012;39:5154–67. 9. Yan A, Shao H, Guo Z. Weight optimization for case-based reasoning using
membrane computing. Inf Sci. 2014;287:109–20.
10. Domingos P. Context-sensitive feature selection for lazy learners. Artif Intell Rev. 1997;11:1–5.
11. Skalac DB. Prototype and feature selection by sampling and random mutation hill climbing algorithms. Proceedings of the 11th international conference on machine learning, vol. 2; 1994. p. 293–301.
12. Ahn H, Kim K. Global optimization of case-based reasoning for breast cytology diagnosis. Expert Syst Appl. 2009;36:724–34.
13. Gu DX, Liang CY, Li XG, Yang SL, Zhang P. Intelligent technique for knowledge reuse of dental medical records based on Case-Base reasoning. J Med Syst. 2010;34:213–22.
14. Cardie C, Howe N. Improving minority class prediction using case-specific feature weights. Proceedings of the 14th international conference on machine learning; 1997. p. 57–65.
15. Cha SH. Comprehensive survey on distance/similarity measures between probability density functions. Int J Math Model Methods Appl Sci. 2007;1:300–7. 16. Chen Y, Garcia EK, Gupta MR, Rahimi A, Cazzanti L. Similarity-based
classification: concepts and algorithms. J Mach Learn Res. 2009;20:747–76. 17. Jain AK, Murty MN, Flynn PJ. Data clustering: a review ACM computing
survey. ACM Comput Surv. 1999;31:264–323.
18. Shirkhorshidi AS, Aghabozorgi S, Wah TY. Comparision study on similarity and dissimilarity measures in clustering continuous data. PLoS One. 2015;10: e0144059.
19. Khalifa A. Al., Haranczyk, M., Holliday, J. Comparison of nonbinary similarity coefficients for similarity searching, clustering and compound selection. J Chem Inf Model. 2009;49:1193–201.
20. Alt H, Godau M. Computing the Fre’chet distance between two polygonal curves. Int J Comput Geom Appl. 1995;5:75–91.
21. Li H, Sun J. Ranking-order case-based reasoning for financial distress prediction. Knowl-Based Syst. 2008;21:868–78.
22. Garbett NC, Merchant ML, Helm CW, Jenson AB, Klein JB, Chaires JB. Detection of cervical Cancer biomarker patterns in blood plasma and urine by differential scanning calorimetry and mass spectrometry. PLoS One. 2014;9:e84710.
23. Fish DJ, Brewood GP, Kim JS, et al. Statistical analysis of plasma
thermograms measured by differential scanning calorimetry. Biophys Chem. 2005;152:184–90.
24. Powers DMW. Evaluation: from precision, recall and F-measure to ROC, Informedness, Markedness & Correlation. J Mach Learn Technol. 2011;2:37–63. 25. Nicolas PR. Scala for machine learning. Birmingham: PACKT Publishing Ltd;