* To whom all correspondence should be addressed. Mob.:+989126007319;
E-mail: [email protected]
Optimization of Protein Extraction and Evaluation of Functional
Properties of Tomato Waste and Seeds from Tomato Paste Plants
Seyed Mohamad Meshkani1*, Seyed Ali Mortazavi2, Amir Hosein Elhami Rad3 and Adel Beigbabaei4
1,3Department of Food Science & Technology, Sabzevar Branch,
Islamic Azad University, Sabzevar, Iran.
2 Department of Food Science and Technology, Ferdowsi
University of Mashad (FUM), P.O. Box: 91775-1163, Mashhad, Iran.
4 Department of Food Chemistry, Research Institute of Food Science and
Technology, PO Box 91735-147, Mashhad-Quchan Highway, Mashhad, Iran.
http://dx.doi.org/10.13005/bbra/2410
(Received: 02 February 2016; accepted: 04 April 2016)
There is an increasing interest to bio-components obtained from fruit and vegetable wastes. Response surface methodology (RSM) was used optimization of condition for extraction of protein from tomato waste and seeds. So the independent variables, alkaline and acidic pH (10-12 and 3.1-4.3), temperature (10-50°C), time (30-70min) and solvent to powder ratio (1:10-1:50w/v) were used. Also, the functional properties of fat and defatted proteins were evaluated. The results showed that the pH 12.00 for first and 3.73 for the second precipitation phase, temperature 37.73°C, time 60 min, solvent to powder ratio 1:40 were the best conditions of extraction. The responses in this condition, Protein Extraction Yield to Defatted Tomato Waste 86.84%; Defatted Tomato Waste Protein 35.29%; Protein Extraction Yield to Defatted Tomato Seeds 64.15% and Defatted Tomato Seeds Protein 44.65% were measured. Also, the results showed that the lowest of bulk density were for Tomato Waste Protein and Tomato Seeds Protein. The Water Absorption Capacity was increased to 55°C, while, the Oil Absorption Capacity were increased to 75°C. The Emulsification Activity Index and Emulsification Stability Index were increased along with pH, but the Emulsification Stability Index was highest at pH 7. The Foaming Capacity and Foaming Stability had significantly increased same to pH (p<0.05).
Keywords: Response surface methodology, tomato, waste, seeds, protein concentrate.
Tomato (Solanum lycopersicum L.) is member of family Solanaceae. Tomato is one of the most popular a garden crop of much interest, being widely used either fresh or processed such as salads, juice, soup, puree, paste, sauce, ketchup and salsa1-6. In 2015, Iran is ranked the world’s
sixth largest producer of tomato. Iran produces about 6,000,000 tons of fresh tomatoes per year7.
It well known that, tomato is one of the most consumed vegetable in the world approximately 30% is consumed as processed products. Global
processing tomato production this year is expected to increase 6% to reach 42.24 million tons, according to the latest estimate by the World Processing Tomato Council8. Besides its economic
importance, the nutritional value of its vegetables and fruits, the tomato, one of the main worldwide agricultural and horticultural crops, is rich in a large number of natural antioxidant compounds. The use of tomato products has been related epidemiologically to a lower incidence of gastrointestinal diseases, cardiovascular, epithelial cell cancers and prostate9. When tomatoes are
tomato and its products decrease the risk of heart diseases and cancer of the prostate, lung and stomach due to the existence of antioxidant components, in particular, lycopene and b-carotene, flavonoids and tocopherols and ascorbic acid2,5,10.
The food wastes contenting of high-quality nutrients that could be extensively used as fertilizer or feed and food. Industrial by products produced from vegetables and fruits processing and cooking represent a major problem for industry concerned. However, they are also valuable source of nutrient compounds which may be used for different purposes in feed or food and other industries11. The production units of tomato paste
are created 7.0–7.5% solid waste and 71–72% pomace3, 12, 13. The wastes are about 3-5 percent of
total weight of tomato that have been proposed according to assessments by the World Council14.
Also, waste of the tomato juice and pulp extraction process are contained lots of seeds, fibrous, skin and the major fundamental of the pomace including of 22-34% protein and 21–30% lipids3, 12, 13. In Iran,
the major part of tomato waste uses for livestock feed and some extent as fertilizers, but it has not been used for human consumption, although this waste contains valuable antioxidants, carbohydrates and proteins5, 15.
The seed protein could be extracted to produce protein isolate/concentrate16.Tomato seed
protein is rich of lysine in range of 80 to 100 g/kg N, therefore, could be improve the quality of cereal protein products. The tomato seed protein can be used to improve the physicochemical characteristics such loaf volume, texture and anti-staling12, 13. In world, the people use of tomato as a
very beneficial vegetable in daily meals. In the USA, about 57 % of daily lycopene absorbs come from cooking and processing tomato products and only 12 % from fresh tomatoes17.Also, in western
countries, the food products based of tomato include 85% of dietary lycopene18. Also, tomatoes
are cheap and they have lowest levels of anti-nutritional factors in comparison with other vegetables13. For several years, the food scientists
have done extensive studies in the field of tomato waste reusing and extraction of effective their materials, such as antioxidants, carotenoids and proteins19.Haddad Khodaparast et al.,20
investigated the production of the protein
concentrate from tomato waste. They selected the most appropriate conditions for protein extraction from tomato waste in alkaline pH 8-12, temperature 20-70 °C and acidic precipitation in pH 3.3-5.5. The results showed that the pH of the first phase 12 and for the second phase 3.9 in 25°C were the best condition to produce tomato waste protein. Shao
et al.4evaluated functional properties of two
proteins from tomato waste in two product condition (hot and cold break). The results showed that the lower protein extraction yield from 9.1 % to 26.3 % for defatted hot break tomato seed compared to from 25.6 % to 32.6 % for defatted cold break tomato seed under two conditions. Sogi
et al.21evaluated of the functional properties of
tomato seed meals and protein. Their results showed that the fat and water absorption for protein were highest. Also the bulk density for the salt-extraction was the highest. Emulsifying capacity values, as well as, water and oil absorption showed that meal had a good wettability and can blend well with oil and water systems. Foaming properties of meal were very poor since foam structure was very weak, and foam capacity and stability at room temperature was also low. The pH values for meals and protein concentrates were neutral and acidic, respectively. The foaming capacity and stability of meals and protein were low. The emulsion capacity of meals and protein was good, while the emulsion stability was excellent except for alkali-extracted. In general, tomato seeds protein isolates produced emulsions with greater globule size as compared to soybean protein isolate (SPI); however, both the concentrates were equally effective in constancy of emulsions.
Response surface methodology (RSM) has been widely used to analyze or to optimize the independent factors which influenced the extraction yield or extract profiles of valuable components of natural materials22. The aim of this
MATERIAL AND METHODS
Material
The chemical reagents and other material that used in study for example NaOH, HCl, Hexane and etc., were purchased from Merck (Merck, Darmstadt, Germany).
Methods: Protein preparation from tomato waste and seeds
Tomato protein concentrate from fat and defatted Tomato Waste Meal (TWM and DTWM), Tomato Seeds Meal (TSM and DTSM) were separated from the pulp, which had been collected from a tomato paste manufacturing plant located at Mashhad (Iran), by a sedimentation technique. Tomato waste and seeds dehydrated at 50 °C for 10 h in a dryer with air condition (Memmert, GmbH, Germany), then crushed by using a laboratory mill (Toos Shekan, Mashhad, Iran) to pass through a 80 mesh screen; for make defatted meal, fat was extracted with hexane in ratio 1:50 w/v, then desolventized with centrifuge at 5000×g (Sigma, Osterode am Harz, Germany) , and powder sieved again with 80 mesh screen (whole meal). Protein concentrates from defatted TW and TS were prepared in five ratio of solvent (distilled water) to TW and TS powder 1:10 to 1:50, in two phase, first, alkaline phase with NaOH 0.1 N at 10 to 50°C for 30 to 70 min and pH 9 to 13 in five point and centrifuge at 2600×g for 10 min and then solution phase were separated, second, acidic phase with HCl 0.1 N to pH 3.1 to 4.3 in 5 point (isoelectric region) and centrifuge at same above condition. Finally, proteins concentrates dried with freeze dryer (Martin Crist, Osterode am Harz, Germany) and hold at -18°C to before use them.
Determination of Protein
A titration method (Kjeldahl method) was used for determination of protein concentrates[23]. In this method, the protein content (%) was calculated as Eq. 1 and 2:
%Nitrogen = Vs,HCl− Vb,HCl × NHCl× 14
Sample weight × 1000 × 100 ...(1)
%Protein=%Nitrogen×6.26 ...(2) Functional Properties
Bulk Density
The bulk density was determined by a scaled plastic centrifuge tube. The samples in six replicate were filled to 25 ml and the tubes were stroked to delete the spaces between the particles.
The bulk density was calculated as Eq. 3[24]:
Bulk density =W2− W1
V ...(3)
In the above equation W1 is weight of the tube without sample (g), W2 weight of the tube with sample (g), V is volume observed (ml). Water and Oil Absorption Capacity
The WAC and OAC was determined by using of Shao et al. [4] method with a little modification. For WAC and OAC test, a sample (1 g) was taken in a test tube and mixed with 10 ml of distilled water for WAC and corn oil for OAC. The tube held in 6 temperature and then they were centrifuged at 4000×g for 10 min. Finally, after removed of the supernatant, the tube with the sediment was weighted. The WAC and OAC were calculated as Eq.4[4, 24]:
= 1− 2 ...(4)
The WAC and OAC were calculated as Eq.4[4, 24]:
In the above equations W1 is weight of the tube plus the dry sample (g), W2 weight of the tube plus the sediment (g), Ws is weight of the dry sample (g).
Emulsification Properties
The EAI and ESI of protein samples were determined as described by [25, 26]with some modification. First, made of a 0.5% (w/v) protein solution prepared in distillation water and after stirring for 1min with a magnetic stirrer (Heidolph, Germany), the pH of the solution was adjusted to 4-10 with either 0.1 M HCl or NaOH. Then, 4.5 ml of this solution mixed with 1.5 ml of corn oil were homogenized at 4500×g for 1 min. 250 ìL of this emulsion was picked out from the bottom at two times (at 0 and 10 min) and diluted with 50 mL of 0.1% sodium dodecyl sulfate solution (NaC12H25SO4) and then vortexed for 10 s. Absorbance of this samples were measured at 500 nm using a UV–visible Spectrophotometer (Biochrom, England). ESI (min) and EAI (m2/g) were
calculated using the following Eq.5 and 6:
EAI =2 × 2.303 × A0× N
c × φ × 104 ...(5)
ESI = A0
absorbance of the diluted emulsion instantly after homogenization, A10 is the absorbance of the diluted emulsion 10 min after homogenization, N is the dilution factor (×150), c is the weight of sample per volume (g/mL), ϕ is the fat volume fraction of the emulsion and t is the time distance (10 min). Foaming Properties
The FC and FS was determined according to the method described by4with minor
modifications, 0.5 g of protein was dispersed in 50 ml of distilled water. The pH of the protein solution was regulated to 4, 5, 6, 7, 8, 9 and 10 with either 0.1 M HCl or 0.1 M NaOH. The solutions were stirred for 3 min with blender at the maximum speed. The stirred protein solution was instantly transferred into a 100 ml cylinder, then volume was observed before (Vb) and after (Va) stirring. The FC was calculated by the following Eq. 7:
FC =Va− Vb
Vb × 100 ...(7) In the above equations Va is volume after stirred, Vb is volume before stirred.
Also, the FS was determined as time (min) required to decline 50 % volume of foam.
Statistical analysis
RSM was used to optimize the protein extraction from tomato waste and tomato seeds. A Box-Behnken design (BBD) was used in the optimization of process variables with five factors at five levels with 50 runs, including 8 central points (condition of the produce: Alkaline pH, x1; Acidic pH, x2; Temperature, x3; Time of extraction, x4; Ratio of solvent to powder, x5) (Table 1). The experimental design and statistical analysis were performed using Design-Expert software (version 8.0.7.1, Stat Ease Inc., Minneapolis, MN, USA). The design included 50 experiments, that adopted by adding 8 central points and this used for estimating the experimental error and a measure of lack-of-fit.27.
The responses function (Y) was partitioned into linear, quadratic and interaction. Experimental data were fitted to the second-order regression Eq. 8:
= 0+ +
=1
2+
=1
+ =1
> ...(8)
The model sufficiency were checked in terms of the values of R 2 and adjusted R2. Analysis of
variance (ANOVA) was employed to determine the significance of the models (p<0.05). Verification of optimized conditions and predicted values were done in triplicate to confirm the validity of the models.
Also, for functional properties of protein extracted from TW and TS (bulk density, EAI, ESI, WAC, OAC, FC and FS) data were subjected to analysis of variance (ANOVA) and Duncan’s by using of IBM SPSS Statistics V.22 (SPSS Inc., USA), in three replication.
As stated above, the data were analyzed by RSM statistical design for the first phase, then the optimized condition of protein extraction selected for making protein concentrate of DTW and DTS. Then for second phase, the functional tests were used by determine the nature of technological of these proteins and compared with the protein extracts from TW, TS, DTW and DTS in central point condition.
RESULT AND DISCUSSION
Statistical analysis
In this study, BBD was used for RSM with five process variables (pH, temperature, time and solvent to powder ratio) at five levels on protein extraction of TWM and TSM. Designs using BBD are generally more efficient in terms of the number of required runs and so they are less expensive to run compared to CCD. The points of design fall
Table 1. Independent variables and their levels used for Box-Behnken design
Independent variables Factors Levels
(X) -2 -1 0 +1 +2
Alkaline pH X1 10 10.5 11 11.5 12
Acidic pH X2 3.1 3.4 3.7 4 4.3
Temperature(°C) X3 10 20 30 40 50
Time of extraction(min) X4 30 40 50 60 70
T
able 2.
The
ANOV
A
for the experimental variables as a linear
, quadratic and interaction
terms of each response variable and corresponding coefficients for the predictive models
Source D F PEY of DTW (%) DTWP (%) PEY of DTS (%) DTSP (%) Sum of Mean p-V alue Sum of Mean p-V alue Sum of Mean p-V alue Sum of Mean p-V alue Squares Square Squares Square Squares Square Squares Square Model 2 0 6471.259 323.563 < 0.0001 697.867 34.893 < 0.0001 1689.667 84.483 < 0.0001 713.641 35.682 < 0.0001
Linear b1
T
able 3.
Box-Behnken design arrangement and responses for protein extraction yield and percent of protein
Run Coded a Uncoded P E Y DTWP P E Y DTWP Run Coded Uncoded P E Y o f DTWP P E Y DTSP Std X1 X2 X3 X4 X5 X1 X2 X3 X4 X5 of DTW (% ) of DTW (% ) S td X1 X2 X3 X4 X5 X1 X2 X3 X4 X5 D T W ( % ) of DTS (% ) 1 -1 -1 -1 -1 -1 1 0 3 .2 2 0 4 0 1:20 39.4 21.27 46.9 31.14 2 6 1 -1 -1 1 1 1 2 3 .2 2 0 6 0 1:40 65.2 34.09 56.4 43.01 2 1 -1 -1 -1 -1 1 2 3 .2 2 0 4 0 1:20 49.4 28.34 4 9 36.2 2 7 -1 1 -1 1 1 1 0 4 .2 2 0 6 0 1:40 5 1 2 9 .8 7 46.6 36.78 3 -1 1 -1 -1 -1 1 0 4 .2 2 0 4 0 1:20 40.8 21.73 41.7 32.12 2 8 1 1 -1 1 1 1 2 4 .2 2 0 6 0 1:40 85.1 33.51 56.3 42.14 4 1 1 -1 -1 -1 1 2 4 .2 2 0 4 0 1:20 50.5 28.3 49.6 38.4 2 9 -1 -1 1 1 1 1 0 3.2 4 0 6 0 1:40 52.3 29.98 50.6 37.89 5 -1 -1 1 -1 -1 1 0 3 .2 4 0 4 0 1:20 46.7 25.71 44.3 34.24 3 0 1 -1 1 1 1 1 2 3 .2 4 0 6 0 1:40 8 8 3 5 .3 4 6 2 4 3.68 6 1 -1 1 -1 -1 1 2 3 .2 4 0 4 0 1:20 54.4 29.88 55.4 41.22 3 1 -1 1 1 1 1 1 0 4 .2 4 0 6 0 1:40 54.4 30.92 53.6 40.16 7 -1 1 1 -1 -1 1 0 4 .2 4 0 4 0 1:20 45.1 23.16 43.3 33.21 3 2 1 1 1 1 1 1 2 4 .2 4 0 6 0 1:40 80.1 34.21 63.7 43.7 8 1 1 1 -1 -1 1 2 4 .2 4 0 4 0 1:20 51.8 27.51 54.7 41.27 3 3 -2 0 0 0 0 9 3 .7 3 0 5 0 1:30 71.2 33.11 54.7 41.35 9 -1 -1 -1 1 -1 1 0 3 .2 2 0 6 0 1:20 42.2 21.31 41.3 33.24 3 4 2 0 0 0 0 1 3 3 .7 3 0 5 0 1:30 77.8 35.21 53.1 42.2 1 0 1 -1 -1 1 -1 1 2 3 .2 2 0 6 0 1:20 50.6 26.35 46.8 37.83 3 5 0 -2 0 0 0 1 1 2 .7 3 0 5 0 1:30 46.7 17.34 38.2 27.41 1 1 -1 1 -1 1 -1 1 0 4 .2 2 0 6 0 1:20 45.3 23.36 46.5 32.21 3 6 0 2 0 0 0 1 1 4 .7 3 0 5 0 1:30 50.8 21.42 38.4 29.01 1 2 1 1 -1 1 -1 1 2 4 .2 2 0 6 0 1:20 51.5 28.18 4 7 37.21 3 7 0 0 -2 0 0 1 1 3 .7 1 0 5 0 1:30 58.4 25.11 50.1 33.75 1 3 -1 -1 1 1 -1 1 0 3 .2 4 0 6 0 1:20 47.4 23.48 43.5 34.87 3 8 0 0 2 0 0 1 1 3 .7 5 0 5 0 1:30 6 5 2 9 .3 4 57.5 37.95 1 4 1 -1 1 1 -1 1 2 3 .2 4 0 6 0 1:20 56.8 29.98 51.2 41.03 3 9 0 0 0 -2 0 1 1 3 .7 3 0 3 0 1:30 64.8 26.77 57.8 41.21 1 5 -1 1 1 1 -1 1 0 4 .2 4 0 6 0 1:20 49.3 25.19 44.5 34.42 4 0 0 0 0 2 0 1 1 3 .7 3 0 7 0 1:30 65.9 29.11 57.8 38.92 1 6 1 1 1 1 -1 1 2 4 .2 4 0 6 0 1:20 57.7 28.8 51.7 40.63 4 1 0 0 0 0 -2 1 1 3 .7 3 0 5 0 1:10 37.1 20.83 34.1 26.15 1 7 -1 -1 -1 -1 1 1 0 3 .2 2 0 4 0 1:40 46.8 26.79 46.9 37.14 4 2 0 0 0 0 2 1 1 3 .7 3 0 5 0 1:50 72.7 28.48 61.2 39.19 1 8 1 -1 -1 -1 1 1 2 3 .2 2 0 4 0 1:40 55.3 31.8 55.4 41.98 4 3 0 0 0 0 0 1 1 3 .7 3 0 5 0 1:30 72.9 29.37 52.4 38.21 1 9 -1 1 -1 -1 1 1 0 4 .2 2 0 4 0 1:40 51.1 28.91 48.1 37.6 4 4 0 0 0 0 0 1 1 3 .7 3 0 5 0 1:30 71.1 28.87 51.3 39.4 2 0 1 1 -1 -1 1 1 2 4 .2 2 0 4 0 1:40 54.9 30.35 53.6 41.03 4 5 0 0 0 0 0 1 1 3 .7 3 0 5 0 1:30 71.8 27.13 5 2 4 1.83 2 1 -1 -1 1 -1 1 1 0 3 .2 4 0 4 0 1:40 48.3 27.27 49.4 38.15 4 6 0 0 0 0 0 1 1 3 .7 3 0 5 0 1:30 71.3 27.54 47.6 37.92 2 2 1 -1 1 -1 1 1 2 3 .2 4 0 4 0 1:40 58.5 32.55 5 9 43.21 4 7 0 0 0 0 0 1 1 3 .7 3 0 5 0 1:30 67.4 27.8 50.4 39.32 2 3 -1 1 1 -1 1 1 0 4 .2 4 0 4 0 1:40 52.7 30.39 5 2 40.18 4 8 0 0 0 0 0 1 1 3 .7 3 0 5 0 1:30 67.2 26.17 4 8 3 6.71 2 4 1 1 1 -1 1 1 2 4 .2 4 0 4 0 1:40 61.5 32.01 60.6 43.12 4 9 0 0 0 0 0 1 1 3 .7 3 0 5 0 1:30 76.7 29.63 49.5 39.15 2 5 -1 -1 -1 1 1 1 0 3 .2 2 0 6 0 1:40 49.7 26.53 47.8 37.24 5 0 0 0 0 0 0 1 1 3 .7 3 0 5 0 1:30 66.4 24.97 51.3 40.23
a X
1
:
Alkaline pH , X
2
:
Acidic pH, X
3 : T emperature, X4 : T
ime of Extract, X
5
Table 4. Chemical composition of tomato waste and seeds meal
Samples (%) TWM DTWM TSM DTSM
Protein 22.83±1.08 27.16±1.23 34.42±0.94 39.81±1.11
Fat 9.22±0.51 - 27.65±0.82
-Ash 3.46±0.04 4.88±0.08 4.91±0.05 5.52±0.04
Fiber 26.12±0.97 29.52±0.86 31.77±1.05 34.68±0.82
Table 5(a).The Water Absorbance Capacity (ml H2O/g) of TWP, DTWP, Opt of DTWP, TSP, DTSP and Opt of DTSP under different temperature. (n=3)
Temperature(°C) 25 35 45 55 65 75
TWP 4.10±0.361a 4.73±0.208b 5.63±0.153c 6.17±0.252c 5.73±0.306c 5.67±0.379c
DTWP 5.10±0.100a 5.47±0.252b 6.07±0.252c 6.50±0.173d 6.20±0.100cd 6.00±0.100c
Opt of DTWP 5.33±0.058a 5.53±0.153a 6.23±0.153a 6.20±0.100a 6.30±0.100a 5.90±0.100a
TSP 3.10±0.100a 3.67±0.153b 4.57±0.153d 4.93±0.153e 4.37±0.153cd 4.27±0.153c
DTSP 3.50±0.100a 4.80±0.100b 5.27±0.153c 5.77±0.115d 5.40±0.100c 5.20±0.100c
Opt of DTSP 3.50±0.200a 4.73±0.115b 5.47±0.153cd 5.70±0.265d 5.47±0.252cd 5.27±0.153c
Mean ± S.D. values superscripted with dissimilar letters in rows are significantly different (p< 0.05)
Table 5(b). The Oil Absorbance Capacity (ml oil/g) of TWP, DTWP, Opt of DTWP, TSP, DTSP and Opt of DTSP under different temperature. (n=3)
Temperature(°C) 25 35 45 55 65 75
TWP 1.42±0.015a 1.47±0.010b 1.50±0.015b 1.54±0.015c 1.48±0.010b 1.60±0.015d
DTWP 1.45±0.015a 1.48±0.015ab 1.56±0.010c 1.58±0.025cd 1.51±0.010b 1.62±0.025d
Opt of DTWP 1.46±0.025a 1.50±0.015ab 1.59±0.015c 1.59±0.010c 1.53±0.015b 1.58±0.010c
TSP 1.05±0.050a 1.12±0.015b 1.23±0.036c 1.27±0.015c 1.21±0.010c 1.27±0.032c
DTSP 1.26±0.010a 1.31±0.017ab 1.34±0.031b 1.36±0.015b 1.34±0.055b 1.46±0.032c
Opt of DTSP 1.28±0.006a 1.33±0.021ab 1.36±0.020bc 1.40±0.015c 1.36±0.051bc 1.47±0.021d
Mean ± S.D. values superscripted with dissimilar letters in rows are significantly different (p< 0.05)
Table 6(a). The Emulsifier Activity Index of TWP, DTWP, Opt of DTWP, TSP, DTSP and Opt of DTSP under different pH. (n=3)
p H 4 5 6 7 8 9 10
TWP 4.28±0.046a 5.88±0.070b 7.14±0.092c 9.14±0.116d 12.97±0.148e 22.82±0.116f 26.67±0.092g
DTWP 3.82±0.046a 5.24±0.070b 6.48±0.116c 8.74±0.148d 12.56±0.070e 21.25±0.70f 24.04±0.092g
Opt of 3.78±0.046a 5.13±0.070b 6.17±0.122c 8.55±0.116d 11.99±0.116e 22.17±0.053f 25.39±0.070g
DTWP
TSP 3.68±0.046a 4.31±0.070b 5.96±0.116c 8.71±0.092d 15.38±0.092e 28.94±0.070f 32.67±0.070g
DTSP 3.24±0.096a 3.84±0.116b 5.53±0.046c 7.97±0.046d 14.55±0.092e 24.66±0.070f 29.63±0.096g
Opt of 3.10±0.096a 3.50±0.092b 5.39±0.046c 7.74±0.166d 14.42±0.122e 24.43±0.116f 30.98±0.096g
DTSP
Mean ± S.D. values superscripted with dissimilar letters in rows are significantly different (p< 0.05)
within a safe operating restrict, within the substantival low and high levels, as BBD does not consist any points at the vertices of the cubic region. This could be useful when the factor-level
compositions are expensive or impossible to test because of the physical process restrictions27.
Table 6(b). The Emulsifier Stability Index of TWP, DTWP, Opt of DTWP, TSP, DTSP and Opt of DTSP under different pH. (n=3)
p H 4 5 6 7 8 9 10
TWP 3.10±0.141a 3.03±0.152a 10.76±0.580b 26.96±0.630e 24.63±1.555d 24.00±0.709d22.65±0.225c
DTWP 3.99±0.085a 4.64±0.147a 13.19±0.538b 32.78±3.283d 21.10±0.724c 18.77±0.034c20.47±0.460c
Opt of
DTWP 4.06±0.570a 5.25±0.341a 15.44±1.536b 34.21±2.191e 27.37±0.748d 19.65±0.313c20.35±0.226c
TSP 6.00±0.451a 5.97±0.208a 18.96±0.493c 31.69±3.925e 25.53±1.141d 16.22±0.177b19.11±0.186c
DTSP 5.63±0.542a 7.48±0.784b 23.33±0.831d 40.88±1.204f 26.46±0.650e 21.99±0.418c21.80±0.379c
Opt of
DTSP 5.54±0.604a 8.54±0.418a 27.74±0.896c 46.63±5.282e 32.30±0.651d 22.08±0.453b19.55±0.124b
Mean ± S.D. values superscripted with dissimilar letters in rows are significantly different (p< 0.05)
Table 7(a). The Foaming Capacity of TWP, DTWP, Opt of DTWP, TSP, DTSP and Opt of DTSP under different pH. (n=3)
pH 4 5 6 7 8 9 1 0
T W P 7.69±1.923a 10.90±1.110b 14.74±1.110c 17.95±1.110d 25.00±1.923e 30.77±1.923f 42.31±1.923g
D T W P 9.62±1.923a 16.67±2.938b 25.00±1.923c 32.69±1.923d 42.31±1.923e 53.85±1.923f 68.59±2.938g
Opt of
D T W P 13.46±1.923a 22.44±1.110b 28.85±1.923c 39.74±1.110d 48.08±1.923e 62.82±4.441f 73.08±1.923g
TSP 16.67±1.110a 20.51±1.110a 30.13±1.110b 37.82±2.938c 48.72±2.938d58.33±2.9238e73.08±5.088f
DTSP 19.23±1.923a23.72±2.221ab 32.05±1.110b 42.95±2.221c 58.33±11.268d69.87±5.875e 82.69±3.846f
Opt of
DTSP 22.44±1.110a 35.26±2.938b 44.23±1.923c 57.05±2.938d 67.31±1.923e 79.49±2.938f 87.82±1.110g
Mean ± S.D. values superscripted with dissimilar letters in rows are significantly different (p< 0.05)
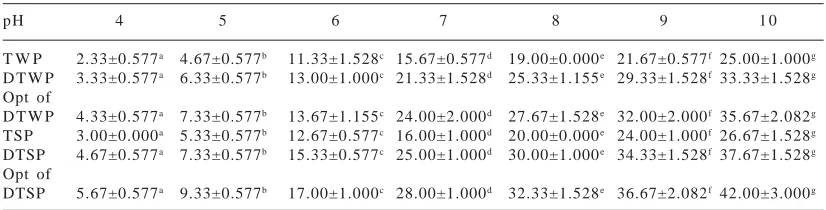
Table 7(b). The Foaming Stability of TWP, DTWP, Opt of DTWP, TSP, DTSP and Opt of DTSP under different pH. (n=3)
pH 4 5 6 7 8 9 1 0
T W P 2.33±0.577a 4.67±0.577b 11.33±1.528c 15.67±0.577d 19.00±0.000e 21.67±0.577f 25.00±1.000g
D T W P 3.33±0.577a 6.33±0.577b 13.00±1.000c 21.33±1.528d 25.33±1.155e 29.33±1.528f 33.33±1.528g
Opt of
D T W P 4.33±0.577a 7.33±0.577b 13.67±1.155c 24.00±2.000d 27.67±1.528e 32.00±2.000f 35.67±2.082g
TSP 3.00±0.000a 5.33±0.577b 12.67±0.577c 16.00±1.000d 20.00±0.000e 24.00±1.000f 26.67±1.528g
DTSP 4.67±0.577a 7.33±0.577b 15.33±0.577c 25.00±1.000d 30.00±1.000e 34.33±1.528f 37.67±1.528g
Opt of
DTSP 5.67±0.577a 9.33±0.577b 17.00±1.000c 28.00±1.000d 32.33±1.528e 36.67±2.082f 42.00±3.000g
Mean ± S.D. values superscripted with dissimilar letters in rows are significantly different (p< 0.05)
evaluated as a function of linear, quadratic and interaction effect of alkaline pH (X1), acidic pH (X2), temperature (X3), time of extraction (X4) and solvent to powder ratio (X5). The results of variance (ANOVA) and coefficients of the models for the responses, along with the corresponding coefficients of determination (R2), adj-R2 and
coefficient of variation (CV) are given in Table 2. Multiple linear regression analysis of the experimental data produced second-order
polynomial equations for PEY of DTW (%), DTWP (%), PEY of DTS (%) and DTSP (%) as postulated before. The statistical analysis demonstrated that the proposed model was enough, showing no significant lack-of-fit (p>0.05) with satisfactory values of R2 for all responses.
results are given in Table 2. Model summary statistics output (Table 2) showed that, for protein extraction of TWM and TSM the values for the R2
and adjusted R2 were the highest compared the
other models while the cubic model was disregarded as it is aliased. For quadratic versus 2FI, the P value obtained was less than 0.0001which shows strength of significance. The addition of the quadratic term to the mean, linear, and the 2FI terms would only strengthen the model. With the leaving aside of the cubic model, the BBD has sufficient data to interpret the results of the present system28. The R2 values were 0.8764, 0.8942, 0.8618
and 0.8342 for PEY of DTW, DTWP, PEY of DTS and DTSP, respectively; this showed that a high percentage of response variations were described by the response surface models.
Adjusted R2 is a modification of
R2 that adjusts for the number of expository terms
in a model. Vice versa R2, the adjusted R2 increases
only if the new term improves the model more than would be envisaged by chance. Thus, it is recommended using an adj-R2 to evaluate the
model adequacy29. In this study, the values of
adj-R2 coefficient were rather enough, advocating the
significance of the model. The coefficient of variation (CV), which indicates the extent to which data were dispersed, were found to be 9.64%, 3.52%, 6.05% and 4.18% for PEY of DTW, DTWP, PEY of DTS and DTSP, respectively (Table 2). Thus, it can be concluded that the selected model adequately
displayed the data for all the responses obtained. Fig. 1 shows that the polynomial regression model was in agreement with the experimental results. In this figure, each of the observed values is compared to the predicted value calculated from the model.
Determination and Optimization of Protein According Table 3, the ranges of protein content of DTW, DTS, PEY of DTW and PEY of DTS were 17.34-35.34%, 26.15-43.70%, 37.1-88% and 34.1-63.7%, respectively.
The all over results of the tests done on protein extraction of DTW, DTS and PEY of DTW, PEY of DTS showed that this extraction process was similar to other seeds protein, especially the protein of other tomato variety, soy and chickpea protein4, 20, 30, 31.Then, formulation optimized protein
extraction; for the maximum of yield and protein content by the Design Expert 7.0.0 software, were accomplished.
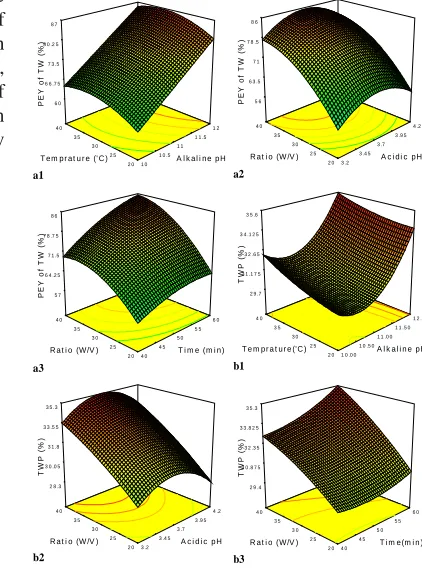
Fig. 2 and Fig. 3 showed the effect of alkaline pH (10-12), temperature (10-50°C), time of extraction (30-70 min) and solvent to powder ratio (1:10-1:50 W/V) in the first phase and acidic pH
Actual PEY of TW (%)
P
redi
ct
ed P
E
Y
of
T
W
(
%
)
37.00 50.00 63.00 76.00 89.00
37.12 49.85 62.58 75.31 88.04
Actual TW (%)
P
red
ic
ted T
W
(
%
)
37.00 42.75 48.50 54.25 60.00
37.34 42.92 48.49 54.07 59.65
Actual PEY of TS (%)
P
redi
ct
e
d
P
E
Y
of
T
S
(
%
)
34.00 41.50 49.00 56.50 64.00
34.10 41.50 48.91 56.32 63.73
Actual TS (%)
P
redi
ct
ed T
S
(
%
)
41.00 46.75 52.50 58.25 64.00
41.15 46.67 52.19 57.71 63.23
Fig. 1. Comparison between predicted and actual values of PEY of TW, TWP, PEY of TS and TSP
a1 a2
a3 b1
b2 b3
10 10.5
11 11.5
12
20 25 30 35 40 60 66.75 73.5 80.25 87
PE
Y
o
f TW
(
%
)
Alkaline pH
Temprature ('C) 3.2
3.45 3.7
3.95 4.2
20 25 30 35 40 56 63.5 71 78.5 86
P
E
Y
o
f T
W
(
%
)
Acidic pH Ratio (W/V)
40 45
50 55
60
20 25 30 35 40 57 64.25 71.5 78.75 86
P
E
Y
o
f T
W
(%
)
Time (min)
Ratio (W/V) 10.00
10.50 11.00
11.50 12.00
20 25 30 35 40 29.7 31.175 32.65 34.125 35.6
T
W
P
(%
)
Alkaline pH Temprature('C)
3.2 3.45
3.7 3.95
4.2
20 25 30 35 40 28.3 30.05 31.8 33.55 35.3
TW
P (
%
)
Acidic pH
Ratio (W/V) 40 45
50 55
60
20 25 30 35 40 29.4 30.875 32.35 33.825 35.3
T
W
P
(%
)
Time(min) Ratio (W/V)
(3.1-4.3) in the second phase on PEY of DTW %, DTWP %, PEY of DTSP % and DTSP %. In this figures, the interaction between of parameters is viewable on the responses.
By applying the desirability function method, according to formulation with desirability 0.992 to condition of protein extraction with properties mentioned, 12.00 of alkaline pH, 3.73 of acidic pH, 37.73°C of temperature, 60 min of time, 1:40 of ratio were determined; in conditions, PEY of DTW 86.84%; DTWP 35.29%; PEY of DTS 64.15% and DTSP 44.65% were measured.
Liadakis et al.32 were used of RSM with a
central composite design for extraction of tomato seed proteins. In this study optimum condition were temperature: 50°C, pH: 11.5, time of mixing: 20 min and water/solid ratio: 1:30 w/v. With above condition protein extract yield 66.1%, protein content of product 72.0% and total protein yield 43.6% were calculated. Ma et al.33 were produced
the peanut protein concentrate from defatted peanut flour by ethanol precipitation and separation with centrifuge, then for the extraction of protein they were used of RSM. The optimization condition of protein extract with ratio of liquid-to-solid of 1:11.79 w/v, ethanol of 85 mL/100 mL and temperature of 36.35°C for having highest of protein content were determined. Firatligil-Durmus and
Evranuz34 were used of RSM for extraction of
protein from red pepper seed meal. The maximum of yield protein was obtained 96.7% when temperature, pH, mixing time and solvent/meal ratio were 31°C, 8.8, 20 min, 1:21 w/v, respectively. Wani
et al.35 were used RSM in extraction conditions for
maximum protein recovery of watermelon seeds. The extraction of protein yield between 72.03 and 81.52 g/100 g. Also, the optimum of protein extraction was obtained when: 0.12 g/L NaOH, 15 min extraction time and 1:70 w/v solvent/powder ratio at 50°C.
Functional Properties
Functional properties of protein concentrate not only dictate its usage but also the level of its concatenation into different food products. It might either improve or destroy the quality of food product as well as the storage period. Various functional properties of the meals and concentrates provide sufficient knowledge to predict their optimal utilization. The result of chemical composition analysis of TWM, DTWM, TSM and DTSM are given in Table 4. In continue were evaluated of functional properties for them. Bulk Density
Bulk density (Fig 4) of different tomato protein concentrates from fat to defatted TWP, TSP and optimum of each DTWP and DTSP was 0.408-0.432, 0.444-0.484, 0.460-0.472, 0.416-0.408-0.432, 0.448-0.464 and 0.444-0.456 g/mL for TWP, DTWP, Opt of DTWP TSP, DTSP and Opt of DTSP, respectively. The protein concentrate prepared from Tomato of Mashhad variety had the highest value in antioxidant, pectin and protein in industrial waste after extraction process for making tomato paste20.
The differences in bulk density were statistically just significant between fat and defatted protein (P<0.05). It is an important property as it determines the behavior of a material (especially powders) in dry mixes as well as volume occupied while packaging. Kramer and Kwee15were extracted
protein from industrial tomato waste and after that, they were analyzed functional properties. They observed that tomato waste was bulkier than other samples. Sogi et al.21evaluated functional
properties of tomato seed meals (whole and defatted) and its protein concentrate. They observed that the salt-extracted protein was the highest. Also, the defatted meal had lower bulk density significantly compared with whole meal
c1 c2
c3 d1
d2 d3
10 10.5
11 11.5
12
20 25 30 35 40 53 55.75 58.5 61.25 64
PE
Y
o
f TS
(
%
)
Alkaline pH
Temprature ('C) 3.2
3.45 3.7
3.95 4.2
20 25 30 35 40 52 55 58 61 64
PEY
o
f TS
(%
)
Acidic pH Ratio (W/V)
40 45
50 55
60
20 25 30 35 40 53 55.75 58.5 61.25 64
PE
Y
o
f TS
(
%
)
Time (min) Ratio (W/V)
10 10.5
11 11.5
12
20 25 30 35 40 39.5 40.875 42.25 43.625 45
TSP
(
%
)
Alkaline pH Temprature('C)
3.2 3.45
3.7 3.95
4.2
20 25 30 35 40 39 40.425 41.85 43.275 44.7
TS
P (
%
)
Acidic pH Ratio (W/V)
40 45
50 55
60
20 25 30 35 40 40.2 41.4 42.6 43.8 45
T
SP (
%
)
Time(min) Ratio (W/V)
Fig 3. The 3d response surface graph for
that might be due to the finer particle size of the former. Shao et al.4 were separated the seeds from
tomato pomace and protein isolated from tomato seeds in two industrial methods (cold and hot break), then they were evaluated their functional properties. They observed that the bulk density of hot break tomato seeds (0.73 g/ml) was significant but defatted hot break tomato seeds (DHTS) and defatted cold break tomato seeds (DCTS)(0.62 and 0.61 g/ml, respectively) were not significant, also, which were significantly higher than that of soybean protein (SP) (0.50 g/ml) (P<0.05). Also, Liadakis et al.36who reported 0.27g/ml. The
difference in these values might be as a result of reasons like variation in raw material, processing, and analytical procedures.
Water and Oil Absorption Capacity
The WAC in term is the volume of water (H2O)/weight of protein for different products from tomato waste and seed indicated that the protein in native form can bind more water. The different treatments in the preparation of other products changed the protein functionality resulting in significantly lower water absorption power. WAC and OAC are important of physical parameters and affecting on some of textural and flavor properties in foods37.Table 5a is presented the ability of
different tomato protein concentrates of fat or defatted TWP, TSP and optimum of each DTWP and DTSP to bind water at range of temperature from 25 to 75°C. Protein concentrates from tomato waste and seeds showed significant differences in WAC (P<0.05). With increase of temperature from 25 to 55°C, the WAC of all samples were increased which could be ascribed to the denaturation of protein during the processes of crushing and extraction. However, the changes in WAC is due to differences in hydrophilic groups among tomato waste or seeds protein concentrates20. It could be
ascribed to the fact that as the pH approaches the isoelectric point, the WAC of protein is minimized. Also, the OAC of different tomato waste and seeds protein concentrates increased significantly from 1.05±0.05 to 1.62±0.025 mL/g with temperature increasing from 25 to 75°C. According to table 5b, the results showed that with increasing process temperature, the OAC had significant increasing (P<0.05).Generally, the increase of process temperature could be lead to denaturation of proteins, but the low increasing of temperature
don’t affect WAC significantly. Shao et al.4
observed that all tomato waste protein in compared with soybean protein had significant differences in WAC and OAC. They observed that WAC values of tomato samples were significantly higher than SP (~2.40 g/g) and also, SP had the highest OAC value (~2.80 g/g) followed by DHTS and DCTS (2.36 and 2.37 g/g), which were significantly bigger than that of HTS (~1.80 g/g) (P<0.05). WAC of the protein especially connected to condition and associated ingredients of protein, for example, amino acids, surface hydrophobicity, lipids, carbohydrate, protein conformation, temperature and pH38. Sogi et al.21 reported a water absorption
value of the tomato protein concentrates from alkali, water, and salt extraction procedures that were 2.15, 2.02, and 2.12 mL/g, respectively. They observed that WAC of the protein concentrates was significantly lower than that of meals, of course the difference could be attributed to the variety of tomatoes used and oil extraction procedures and also, reported the whole and defatted meals exhibited fat absorption values of 2.63 and 2.37 mL/g, while those for protein concentrates extraction were 1.87, 2.17 and 2.03 mL/g for alkali, water, and salt, respectively. The values obtained in this study for similar parameters are slightly lower. These deflection could be due to variations in processing conditions during protein concentrate preparation; however, the difference in values was not significant and the less values for concentrate from water extraction as compared to salt extraction complementarity in their findings. The lower OAC for defatted as compared to that for fat meal might be due to denaturation of protein effect as a result of temperature rise during grinding as well as the seed meal water extraction. Between the concentrates, the water extracted (alkali) showed the lowest OAC, which could be attributed to protein denaturation resulting in decreased binding points for the fat molecules. The results of the present study agree with those of Rahma et al.39 who reported similar values for defatted meal
of tomato seeds. However, Liadakis et al.36
native can bind more fat. Further treatments in the preparation of defatted and concentrates significantly lowered the OAC.
Emulsification properties
Table 6a and b, showed that the emulsifying properties (EAI and ESI) of all concentrate (0.5%, w/v; pH 4 to 10) with corn oil were investigated and also, the effects of pH on EAI and ESI were analyzed for protein concentration in above condition. The EAI is an ability to the protein concentrate to emulsion formation. The EAI preparing an approximation of the interfacial area fixated per unit weight of protein based on the turbidity of an emulsion25, 26.The results showed that
the EAI was increased with the growth of pH and had significant differences between pH 4 to 10. Also, the results showed that between the defatted and fat tomato protein in EAI were slight differences (p<0.05) (Table 6a). The results of Shao et al.4 were
showed that with increased of pH same to present study, EAI were increased. They expressed that the EAI values of SP were the highest (0.539-0.755 AV/ mm), and for other test cases, DCTS (0.080-0.951 AV/mm), DHTS and HTS (0.061-0.705 and 0.053-0.527 AV/mm, respectively) were determined. Boye et al.30
were observed that the EAI for the pulse protein concentrate of 4.6 m2/g for YP-UF (lowest) and 5.7
m2/g for the DC and KC-IEP (highest), however, no
significant differences were observed of pulse varieties.
The ESI is the stability of emulsion in a time of stationary period. The results in present study were showed that the ES value increased the pH of 4 to 7 and pH 7 was highest for all of proteins, Opt of DTSP in pH 7 to 46.63 min and TWP to 26.96 min were highest and lowest, respectively (Table 5b). At pH of 3 to 5, which were around protein isoelectric region32, the EAI and
ESI values of samples were the lowest. This was because most of proteins are slightly soluble at their isoelectric pH, weakly hydrated, and absence electrostatic repellent forces4. At the outside of
this region4-5, both EAI and ESI increased
significantly because of the increase in solubility of protein at high pH, however, enhances in ESI after pH 7 were not so significant. In general decrease and increase in EAI and ESI should be congruous with the pH-dependent of protein solubility and also, EAI depends upon the lipophilic-hydrophilic balance that was affected by
changing of pH. Therefore, EAI and ESI were pH-dependent because the alkaline pH improved the emulsion capacity more than acidic pH40.
Foaming (Whipping) properties
The FC (Table 7a) and FS (Table 7b) shows the values of TWP, DTWP, Opt of DTWP, TSP, DTSP and Opt of DTSP samples. The FC and FS are used as indices of the whipping properties of protein concentrates. Proteins foam when stirred because of their surface active properties. Also, FS is equally important since food products are generally stored under ambient or refrigeration conditions until consumed41. Foam formation is important in food
productions such as some beverages and cakes31.
In present study observed that when the pH increased, the FC and FS had significant increases. In general, in the studied pH 4 to 10, FC and FS showed similar trends (p<0.05). For the creating a good foaming agent from a protein concentrate, this protein should be has ability to adsorb swiftly at the air–water joint during the bubbling and the ability to undergo conformational changes and rearrangement at the interface with decrease of surface tension which might be due to extraction of globulin which has a higher FC under neutral pH conditions42. Deep Singh et al.43 reported the ability
of chickpea protein concentrates to produce foams in two pH 7 and 4.5 and conditions with and without the addition of 10g/L NaCl or 100g/L sucrose on two variety of chickpea (Desi and Kabuli). At pH 7, Desi cultivar PDG-4 showed the highest FC and FS, followed by Kabuli cultivar L-551, while Desi cultivars PBG-1 and GPF-2 showed the lowest FC, though their FS was comparable to that of the other cultivars. Obatolu et al.44 reported FC ranging from
1.98% to 40.2% for processed (boiled) and not processed (raw) yam bean respectively. Also, they observed that the large difference in FC between the boiled and raw bean varieties shows that processing treatments used in the study decreased FC significantly (P<0.05). FS of the raw flour was, however, less than that of the processed bean flours. Shao et al.4 reported the FC to 25.13–66.33 % and
FS to 36.67–92.00 min for SP that were significantly higher than those of DCTS (5.47–39.87 % and 0.50– 61.00 min, respectively), followed by DHTS (4.00– 20.53 % and 0.50–30.17 min, respectively) and then HTS (0– 14.50 % and 0–20 min, respectively) (P<0.05).
Response surface methodology technique demonstrated to be a useful tool in organizing optimum conditions for extracting tomato waste and seed protein. Protein was extracted from fat and defatted tomato waste and seeds powder with 50 selected combinations of temperature, pH (alkaline and acidic phase), extraction time and solvent to powder ratio. The experimental value of protein content for DTW 37.34-55.34%, DTS 41.15-58.70% and protein extraction yield of DTW 37.12-88.04% and DTS 34.1-63.7% were determined. The second order model developed for PEY of DTW, DTWP, PEY of DTS and DTSP represented a non-significant value for lack of fit and semi high value for the coefficient of determination (R2). The variables with the largest
effect were the alkaline pH, temperature and solvent to powder ratio. The optimum condition for extraction of DTW and DTS could be achieved in alkaline pH 12, acidic pH 3.73, temperature 37.73°C, time of extraction 60 min and solvent to powder ratio 1:40. These conditions resulted in PEY of DTW 86.84%; DTWP 35.29%; PEY of DTS 64.15% and DTSP 44.63%.
Also, the present study shows that the functional properties of tomato waste and seed protein concentrates were evaluated to assess their effective use in food systems. However, the functional properties (Bulk density, WAC and OAC, EAI and ESI, FC and FS) on TWP, DTWP, Opt of DTWP, TSP, DTSP and Opt of DTSP were determined. The TWP and TSP were lowest between the other samples in Bulk density. In WAC test, all of the samples were increased to 55°C and after a little decreased. For OAC test, all of the samples with increases to temperature were increased. The emulsifier properties (EAI and ESI) with increases in pH were increased but the ESI value was highest at pH 7 for all samples. Also, the foaming properties (FC and FS) had significantly increased with the growth of pH (p<0.05).
REFERENCES
1. Ray, R.C., El Sheikha, A.F., Panda, S.H., and
Montet, D. Anti-oxidant properties and other functional attributes of tomato: An overview. International Journal of Food and Fermentation Technology. 2011; 1(2): 139-148.
2. Kaur, D., Wani, A.A., Oberoi, D., and Sogi, D.
Effect of extraction conditions on lycopene extractions from tomato processing waste skin
using response surface methodology. Food
chemistry. 2008; 108(2): 711-718.
3. Arabani, A.A., Hosseini, F., Abbaspour, F., and
Anarjan, N. The effects of ultrasound pretreatment processes on oil extraction from
tomato wastes. International Journal of
Biosciences (IJB). 2015; 6(4): p. 8-15.
4. Shao, D., Atungulu, G.G., Pan, Z., Yue, T.,
Zhang, A., and Fan, Z. Characteristics of isolation and functionality of protein from tomato pomace produced with different industrial processing
methods. Food and Bioprocess Technology.
2014; 7(2): p. 532-541.
5. Stajèiæ, S., Æetkoviæ, G., Èanadanoviæ-Brunet,
J., Djilas, S., Mandiæ, A., and Èetojeviæ-Simin, D. Tomato waste: Carotenoids content,
antioxidant and cell growth activities. Food
chemistry. 2015; 172: p. 225-232.
6. Fahimdanesh, M. and Bahrami, M.E. Evaluation
of physicochemical properties of Iranian tomato
seed oil. Journal of Nutrition & Food Sciences.
2013.
7. FAOSTAT. Crop Statistics. 2015 Accessed 30
Dec 2015.; Available from: Available at http:// faostat3.fao.org/download/Q/QC/E.
8. WPTC. (World Processing Tomato Council).
2016; Available from: www.wptc.to.
9. Donkor, A., Osei-Fosu, P., Nyarko, S.,
Kingsford-Adaboh, R., Dubey, B., and Asante, I. Validation of QuEChERS method for the determination of 36 pesticide residues in fruits and vegetables from Ghana, using gas chromatography with electron capture and
pulsed flame photometric detectors. Journalof
Environmental Science and Health, Part B. 2015;
50(8): p. 560-570.
10. Strati, I.F. and Oreopoulou, V. Effect of
extraction parameters on the carotenoid recovery
from tomato waste. International Journal of
Food Science & Technology. 2011; 46(1): p. 23-29.
11. Schieber, A., Stintzing, F., and Carle, R.
By-products of plant food processing as a source of functional compounds—recent developments. Trends in food science & technology. 2001;
12(11): p. 401-413.
12. Sogi, D., Bhatia, R., Garg, S., and Bawa, A.
Biological evaluation of tomato waste seed meals
and protein concentrate. Food chemistry. 2005;
89(1): 53-56.
13. Sogi, D., Arora, M., Garg, S., and Bawa, A.
Fractionation and electrophoresis of tomato
waste seed proteins. Food chemistry. 2002; 76(4):
14. Zuknik, M.H., Norulaini, N.N., and Omar, A.M. Supercritical carbon dioxide extraction of
lycopene: A review. Journal of Food
Engineering. 2012; 112(4): p. 253-262.
15. Kramer, A. and Kwee, W. Functional and
nutritional properties of tomato protein
concentrates. Journal of Food Science. 1977;
42(1): p. 207-211.
16. Sogi, D., Bawa, A., and Garg, S. Sedimentation
system for seed separation from tomato
processing waste. Journal of food science and
technology. 2000; 37(5): p. 539-541.
17. Chug-Ahuja, J.K., Holden, J.M., Forman, M.R.,
Mangels, A.R., Beecher, G.R., and Lanza, E. The development and application of a carotenoid database for fruits, vegetables, and selected
multicomponent foods. Journal of the American
Dietetic Association. 1993; 93(3): p. 318-323.
18. Fraser, P.D. and Bramley, P.M. The biosynthesis
and nutritional uses of carotenoids. Progress in
lipid research. 2004; 43(3): p. 228-265.
19. Moayedi, A., Hashemi, M., and Safari, M.
Valorization of tomato waste proteins through production of antioxidant and antibacterial hydrolysates by proteolytic Bacillus subtilis: optimization of fermentation conditions. Journal of food science and technology. 2016;
53(1): 391-400.
20. Khodaparast, M.H.H., Nikzade, V., and
Piraieshfar, B. Feasibility Assessment of Protein Concentrate From Tomato Processing Wastes and Determination of Its Functional Properties. Iranian Food Science and Technology Research Journal. 2011. 7(2): p. 108-114.
21. Sogi, D., Garg, S., and Bawa, A. Functional
Properties of Seed Meals and Protein Concentrates From Tomato processing Waste. Journal of Food Science. 2002. 67(8): p. 2997-3001.
22. Wang, C., Shi, L., Fan, L., Ding, Y., Zhao, S.,
Liu, Y., and Ma, C. Optimization of extraction and enrichment of phenolics from pomegranate
(Punica granatum L.) leaves. Industrial Crops
and Products. 2013; 42: p. 587-594.
23. Kenkel, J., Analytical chemistry for technicians.
CRC Press. 2010.
24. Ogunwolu, S.O., Henshaw, F.O., Mock, H.-P.,
Santros, A., and Awonorin, S.O. Functional properties of protein concentrates and isolates produced from cashew (Anacardium occidentale
L.) nut. Food chemistry. 2009; 115(3): p.
852-858.
25. Karaca, A.C., Low, N., and Nickerson, M.
Emulsifying properties of chickpea, faba bean, lentil and pea proteins produced by isoelectric
precipitation and salt extraction. Food Research
International. 2011; 44(9): p. 2742-2750.
26. Pearce, K.N. and Kinsella, J.E. Emulsifying
properties of proteins: evaluation of a
turbidimetric technique. Journal of Agricultural
and Food Chemistry. 1978; 26(3): p. 716-723.
27. Montgomery, D.C., Design and analysis of
experiments. John Wiley & Sons. 2008.
28. Kumar, A., Prasad, B., and Mishra, I.
Optimization of process parameters for acrylonitrile removal by a low-cost adsorbent
using Box–Behnken design. Journal of
Hazardous Materials. 2008; 150(1): p. 174-182.
29. Koocheki, A. and Kadkhodaee, R. Effect of
Alyssum homolocarpum seed gum, Tween 80 and NaCl on droplets characteristics, flow properties and physical stability of ultrasonically prepared corn oil-in-water
emulsions. Food Hydrocolloids. 2011; 25(5): p.
1149-1157.
30. Boye, J., Aksay, S., Roufik, S., Ribéreau, S.,
Mondor, M., Farnworth, E., and Rajamohamed, S. Comparison of the functional properties of pea, chickpea and lentil protein concentrates processed using ultrafiltration and isoelectric
precipitation techniques. Food Research
International. 2010; 43(2): 537-546.
31. Boye, J., Zare, F., and Pletch, A. Pulse proteins:
processing, characterization, functional properties and applications in food and feed. Food Research International. 2010; 43(2): p. 414-431.
32. Liadakis, G.N., Tzia, C., Oreopoulou, V., and
THOMOPOULOS, C.D. Protein isolation from tomato seed meal, extraction optimization. Journal of Food Science. 1995; 60(3): p. 477-482.
33. Ma, T., Wang, Q., and Wu, H. Optimization of
extraction conditions for improving solubility of peanut protein concentrates by response
surface methodology. LWT-Food Science and
Technology. 2010; 43(9): p. 1450-1455.
34. Firatligil-Durmus, E. and Evranuz, O. Response
surface methodology for protein extraction optimization of red pepper seed (Capsicum
frutescens). LWT-Food Science and Technology.
2010; 43(2): p. 226-231.
35. Wani, A.A., Kaur, D., Ahmed, I., and Sogi, D.
Extraction optimization of watermelon seed protein using response surface methodology. LWT-Food Science and Technology. 2008; 41(8): p. 1514-1520.
36. Liadakis, G.N., Tzia, C., Oreopoulou, V., and
Thomopoulos, C.D. Isolation of tomato seed
meal proteins with salt solutions. Journal of
Food Science. 1998; 63(3): p. 450-453.
properties of proteins in foods: a survey. Critical Reviews in Food Science & Nutrition. 1976; 7(3): 219-280.
38. Mao, X. and Hua, Y. Composition, structure
and functional properties of protein concentrates and isolates produced from walnut
(Juglans regia L.). International journal of
molecular sciences. 2012. 13(2): p. 1561-1581.
39. Rahma, E., Moharram, Y., and Mostafa, M.
Chemical characterization of tomato seed
proteins (Var Pritchard). Egyptian Journal of
Food Science. 1986; 14: p. 221-230.
40. El Nasri, N.A. and El Tinay, A. Functional
properties of fenugreek (Trigonella foenum
graecum) protein concentrate. Food chemistry.
2007; 103(2): p. 582-589.
41. Kaur, M. and Singh, N. Characterization of
protein isolates from different Indian chickpea
(Cicer arietinum L.) cultivars. Food chemistry.
2007; 102(1): p. 366-374.
42. Fidantsi, A. and Doxastakis, G. Emulsifying and
foaming properties of amaranth seed protein
isolates. Colloids and Surfaces B: Biointerfaces.
2001; 21(1): p. 119-124.
44. Deep Singh, G., Wani, A.A., Kaur, D., and Sogi,
D.S. Characterisation and functional properties of proteins of some Indian chickpea (Cicer
arietinum) cultivars. Journal of the Science of
Food and Agriculture. 2008; 88(5): p. 778-786.
44. Obatolu, V., Fasoyiro, S., and Ogunsunmi, L.
Processing and functional properties of yam
beans (Sphenostylis stenocarpa). Journal of food