Harmonic Analysis of Front-End Current of Three-Phase
Single-Switch Boost Converter
Ahmed Al Mansur
Lecturer, Dept of EEE
Prime University, Bangladesh
Abdullah Al Bashit
Lecturer, Dept of EEE
Prime University, Bangladesh
Muhammad Rafiqul Islam
Electrical & Electronic Engineer
Dhaka, Bangladesh
ABSTRACT
Harmonic analysis of Front End Current (FEC) of three phase single switch boost converter to reduce the total harmonic distortion (THD), active switching & passive filters are incorporated in this work. A constant frequency switching is used for active filtering & pulse width modulation (PWM) technique is used to regulate the output voltage. Power factor improvement is accomplished by using PWM technique and passive LC high frequency harmonics filters. An Electro Magnetic Interference (EMI) filter is used to suppress the high frequency component generated by the active switching. Moreover, a series LC filter resonating with the supply frequency is also used to suppress the low frequency value could be made less than 3%, which is a great improvement over the earlier rectifiers that have only EMI filter. In the earlier types of rectifiers, the THD value was as high as 17%. The efficiency of the module is also studied. As the output voltage has the nonlinear relation with duty cycle, the efficiency is also nonlinear with output voltage variation. But up to certain range of duty cycle it could be made linear in nature with output voltage. The efficiency versus duty cycle and THD versus duty cycle curve for the proposed rectifier circuit is given for a clear understanding of the model.
General Terms
Three Phase Boost Converter, Harmonics Filter.
Keywords
Active Switching, Electro Magnetic Interference, Passive Filter, Power Factor Correction, Total Harmonic Distortion
1.
INTRODUCTION
Most electronic equipments are supplied by dc voltage. All these equipments are fed from single phase or three phase ac utility lines. So, ac to dc conversion is very common. Traditionally, ac to dc conversion [1] is achieved using single-phase or three-single-phase diode bridge rectifier [2-5]. But, a diode bridge rectifier is affected by high THD, large ripple and low power factor. The input current with large harmonics may cause excess heat and unstable operation. Low power factor leads high reactive power requirement and reduces voltage at the load [6-7]. As a result line and equipment losses increase. For stable and reliable operation loads require regulated dc voltage. In this respect switching regulators are available to perform regulation of dc voltage. Recently works have been proposed on switching regulators with single phase or three phase diode bridge rectifier between sources and loads. But non sinusoidal input current, high harmonic distortion, low
power factor, large ripple and lower efficiency are the major drawbacks of these regulators [9]. The problem can be solved by adding filter in input and output side of regulators.
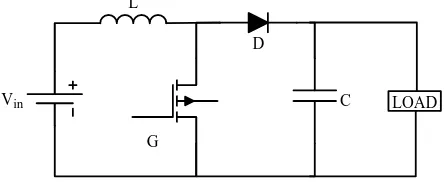
L
D
C
Vin LOAD
G
Fig 1: Circuit diagram of a typical Boost regulator
Some regulators have been developed recently with input and output filter which provides power factor near to unity at reduced THD [10-12]. But their sizes are the main advantages. To combats such problems, in this paper a Boost regulator has been analyzed with a three phase diode bridge rectifier. It is possible to improve power factor by this arrangement. Boost also offers large variation of output voltage with small variation of duty cycle. The objective of this work is to improve power factor keeping input current sinusoidal with low THD and improve the performance of the Boost rectifier using additional harmonic filter to maintain input current sinusoidal even with the variation of duty cycle which is necessary for voltage control purposes in variable voltage applications.
2.
PRINCIPLE OF OPERATION
the inductors start rising linearly and it gets stored. The resulting output voltage is in positive phase of the input voltage. The mathematical expressions in these modes are
𝑉
𝑖𝑛= 𝑉
𝐿= 𝐿
𝑡𝑑𝐼𝑜𝑛
(1)
𝑉
𝑖𝑛𝑡
𝑜𝑛= 𝐿𝑑𝐼
(2)
During low state of switching pulse switch gets turned off and inductor released its stored energy to the load through diode and bypass capacitor C. It is a continuous conduction process and power flow bidirectionally. The mathematical expressions in these modes are,
𝑉
𝑖𝑛− 𝑉
0= −𝐿
𝑡𝑑𝐼𝑜𝑓𝑓
(𝑉
𝑖𝑛− 𝑉
0)𝑡
𝑜𝑓𝑓= −𝐿𝑑𝐼
(𝑉
0− 𝑉
𝑖𝑛)𝑡
𝑜𝑓𝑓= 𝐿𝑑𝐼
(3)
From equations (2) and (3),
𝑉
𝑖𝑛𝑡
𝑜𝑛= (𝑉
0− 𝑉
𝑖𝑛)𝑡
𝑜𝑓𝑓(4)
𝑉
𝑜𝑡
𝑜𝑓𝑓= 𝑉
𝑖𝑛(𝑡
𝑜𝑛+ 𝑡
𝑜𝑓𝑓)
𝑉
𝑜= 𝑉
𝑖𝑛(𝑇−𝑡𝑇𝑜𝑛)
𝑉
𝑜= 𝑉
𝑖𝑛(1−𝐷)1(5)
From equation (5) it is seen that the output voltage is always higher than input voltage. The output voltage is controlled by varying duty cycle (D) with variation of dc reference voltage. The simulated results are shown in table I. From the above analysis it is seen that input current and output voltage are highly distorted. For high frequency switching action output voltage ripple increases with variation of duty cycle which is represented as current harmonics in input size.
3.
ANALYSIS
3.1
Boost Rectifier without EMI Filter
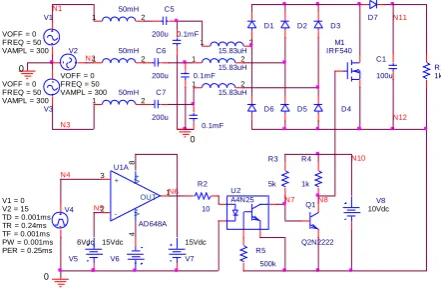
At first a single switch Boost regulator with three phase diode bridge rectifier is analyzed without input-side EMI filter. The circuit diagram of the rectifier with PWM control circuit is shown in figure 2. Here a Boost regulator is attached to a 3-φ rectifier with a resistive load. Rectifier is fed from a 3-φ ac utility lines having constant amplitude at constant frequency. The diodes of each phase conducts sequentially through highest positive input phase voltage. The PWM control
Fig 2: A single switch boost rectifier with PWM circuit
Fig 3: Input side current of the single switch boost rectifier
Fig 4: Output voltage of the single switch boost rectifier
Fig 5: Frequency spectrum of the input side current
circuit generated a switching voltage of limited amplitude which is applied to turn on/off the switching element with low switching stress. The pulse width modulation (PWM) technique has been implemented to generate switching pulses comparing a dc reference voltage with a carrier saw tooth wave. PWM technique is used for its simplicity and low cost. The input current and output voltage wave shapes are shown in figures 3 and 4.
D1
D4
N11
R5
500k
N8
V2
FREQ = 50 VAMPL = 300 VOFF = 0
V8
10Vdc
U2 A4N25 U1A
AD648A
3
2
8
4
1
+
-V+
V-OUT R2
10
N3
V5
6Vdc
D2
N5
D3
V3
FREQ = 50 VAMPL = 300 VOFF = 0
V4
TD = 0.001ms
TF = 0.001ms PW = 0.001ms PER = 0.25ms V1 = 0
TR = 0.24ms V2 = 15
N9
N12
N10
Q1
Q2N2222 D5
N6
M1 IRF540
N1
L1 1mH
1 2
C1
100u
N2
N4
R3
5k
V6
15Vdc
D7 V1
FREQ = 50 VAMPL = 300 VOFF = 0
R1 1k
0
R4
1k D6
N7
0
V7
15Vdc
T i m e
0 s 1 0 m s 2 0 m s 3 0 m s 4 0 m s
- I ( V 1 ) - 1 0 0 A
0 A 1 0 0 A
T i m e
0 s 1 0 m s 2 0 m s 3 0 m s 4 0 m s
A V G ( V ( N 1 1 ) - V ( N 1 2 ) ) 0 V
1 . 0 K V 2 . 0 K V
F r e q u e n c y
0 H z 0 . 2 K H z 0 . 4 K H z 0 . 6 K H z 0 . 8 K H z 1 . 0 K H z
Table 1. Performance parameter of a three phase boost regulated rectifier [13], [14]
Duty Cycle (D)
THD (cosθ) PF
Vout
(dc) volt
Iin
(peak) amp
Efficiency η (%)
0.2 0.3291 0.545 49.49 800 48.08
0.3 0.3981 0.621 40.21 890 88.53
0.4 0.4903 0.702 37.35 1000 98.54
0.5 0.55 0.767 29.69 900 98.86
0. 6 0.5749 0.869 22.62 780 97.23
0.7 0.5903 0.841 17.15 700 99.06
0.8 0.6205 0.903 12.72 600 98.41
0.5 0.6392 0.86 11.45 560 100
0.9 0.5939 0.847 11.17 550 100
0.95 0.7135 0.819 10.46 520 100
The simulated results are shown in table 1. From the above analysis it is seen that input current and output voltage are highly distorted. For high frequency switching action output voltage ripple increases with variation of duty cycle which is represented as current harmonics in input size. The input current is observed highly distorted and non sinusoidal in nature with low power factor. The THD% is calculated with equation (6).
𝑇𝐻𝐷% =
𝐼ℎ 2ℎ=∞ ℎ=2
𝐼1 (6)
Where, Ih is the magnitude of current harmonic Component and I1 is the magnitude of the component of current. Putting the values in the equation THD% is found to be 71.35% which is not acceptable. Filtering is required to improve the input current to sinusoidal by reducing the harmonics components and to make the power factor unity.
3.2
Boost Rectifier with EMI Filter
Fig 6: Boost Rectifier with EMI filter and Switching
Passive filter is a common solution to reduce THD from the input-side current of the rectifier. But the size of filter is an important issue to design a filter. Now, the Boost regulated rectifier is analyzed with an input passive filter having parameter L=10uH and C=1nF and with an output filter capacitor C=100uF. The circuit diagram of a Boost regulated three phase rectifier with passive filter is shown in figure 6.
The input side current and output voltages are shown in figure 7 and figure 8 respectively. The simulated results are shown in table 2.
Fig 7: Input current of the boost rectifier with input filters
Fig 8: Output voltage of the boost rectifier with input filters
Table 2. THD & Efficiency with duty cycle in single switch boost rectifier without series LC filter
Duty Cycle
(D)
THD (cosθ) PF
Vout
(dc) volt
Iin
(peak) amp
Efficiency η (%)
0.80 8.10 0.84 632 32.3 32
0.75 8.32 0.86 795 31.2 52
0.69 7.94 0.89 928 30.0 71
0.63 8.72 0.95 964 25.6 84
0.56 11.78 0.98 896 20.0 90
0.51 14.67 0.99 821 15.0 99
0.43 16.73 0.99 753 12.7 99
0.38 17.86 0.97 695 11.0 99
0.31 22.41 0.95 645 8.0 99
0.25 17.60 0.89 600 9.2 97
0.18 17.52 0.80 555 9.8 86
0.12 16.47 0.70 520 9.0 93
3.3
Boost Rectifier with EMI and series LC
Filter
It is seen that the amount of THD% is reduced than the previous condition and the input current is also found almost sinusoidal. But, the power factor has not improved satisfactorily. Another drawback is large harmonics peak is observed at 250Hz. In this perspective a harmonics filter is developed using formula XL= XC. Putting the resonating frequency the product of LC is calculated 4.053*107Changing the various values of L and C it is closely observed that better performance of the filter is found by L=18.83uH & C=0.1mF C1
100u 10uH
1 2
R2
10
D4 1n
D7
N12
R5
500k
0
1n
V4
TD = 0.001ms TF = 0.001ms PW = 0.001ms PER = 0.25ms V1 = 0
TR = 0.24ms V2 = 15
D2 D3
V8
10Vdc
1mH
1 2
Q1
Q2N2222 N2
0
1mH
1 2
V3
FREQ = 50 VAMPL = 300 VOFF = 0
U2 A4N25
R4
1k V2
FREQ = 50 VAMPL = 300 VOFF = 0
N9
1mH
1 2
1n
N10 N1
V5
5Vdc
N11
N7 D1 V1
FREQ = 50 VAMPL = 300 VOFF = 0
D6 10uH
1 2
N4
N5
R3
5k D5 10uH
1 2
V6
15Vdc
N3
V7
15Vdc
U1A
AD648A
3
2
8
4
1
+
-V+
V-OUT
M1 IRF540
R1 1k
N8 N6
Fig 9: Three phase rectifier with EMI & series LC filter
Fig 10: Input current of the boost rectifier with input filters
Fig 11: Output voltage of the boost rectifier with input filters
Table 3. THD & Efficiency with duty cycle in single switch boost rectifier with series LC filter
Duty Cycle
(D)
THD (cosθ) PF
Vout
(dc) volt
Iin
(peak) amp
Efficiency η (%)
0.96 0.96 0.80 450 33 17
0.88 0.98 0.80 412 32.5 14
0.84 1.03 0.80 640 32 35
0.80 1.04 0.80 800 31 57
0.72 1.14 0.80 930 30 72
0.64 1.33 1.00 900 19.7 91
0.54 1.65 1.00 820 16 93
0.47 2.01 1.00 750 13.5 93
0.31 3.78 0.95 635 11.7 81
0.26 3.85 0.84 590 10.6 87
0.18 3.37 0.72 550 9.9 93
0.12 2.10 0.61 510 9.2 99
0.05 2.04 0.61 483 8.9 99
This harmonics filter permits power quality to improve satisfactorily. Then the simulation results of Boost rectifier is shown in table 3. The proposed model consists of the following parts as follows: (a) a fixed 3-φ ac sources (b) rectifying stage (c) control circuit (d) PFC stage (e) filtering stage and (f) load. The schematic circuit diagram of Boost rectifier with passive high frequency and resonant filter is shown in figure 9. Typical input current and output voltage of this proposed scheme are shown in figures 10 and 11 respectively.
4.
RESULTS
The comparison between the two circuits (with and without LC series filter) for THD values, output voltage and efficiency for different values of duty cycle are shown in figures 12, 13 and 14 respectively. Figure 12 shows that, THD is less for the
Fig 12: THD vs Duty cycle curves with and without series LC filters
Fig 13: Output voltage vs Duty cycle curves with and without series LC filters
Fig 14: Efficiency vs Duty cycle curves with and without series LC filters
proposed model than the previous model that does not have the LC series filter. Figure 14 shows that output voltage increases for a certain range of duty cycle. It is seen that for a D2
C7
200u
U1A
AD648A
3
2
8
4
1
+
-V+
V-OUT 50mH
1 2
Q1
Q2N2222
0
N3
R4
1k
N7 N5
N10 R3
5k 0.1mF
V7
15Vdc
N6 N4
15.83uH
1 2
C5
200u 50mH
1 2
D6 15.83uH
1 2
V8
10Vdc
D5 V1
FREQ = 50 VAMPL = 300 VOFF = 0
0
0.1mF
R2
10
D7
R5
500k
D4
R1 1k
N12
V4
TD = 0.001ms TF = 0.001ms PW = 0.001ms PER = 0.25ms V1 = 0
TR = 0.24ms V2 = 15
N11
N2
V5
6Vdc
V2
FREQ = 50 VAMPL = 300 VOFF = 0
N1
V6
15Vdc
C1
100u
U2 A4N25 C6
200u
N8 0.1mF
50mH
1 2
M1 IRF540
0
D3
V3
FREQ = 50 VAMPL = 300 VOFF = 0
15.83uH
1 2
D1
T i m e
1 0 0 m s 1 1 0 m s 1 2 0 m s 1 3 0 m s 1 4 0 m s 1 5 0 m s 1 6 0 m s
- I ( V 1 ) - 4 0 A
0 A 4 0 A
T i m e
0 s 4 0 m s 8 0 m s 1 2 0 m s 1 6 0 m s
A V G ( V ( N 1 1 ) - V ( N 1 2 ) ) 0 V
certain range of D the variation of output voltage is linear with efficiency. Wave shapes of efficiency at different duty cycles are shown in figure 14. The variation of power factor with different duty cycle is shown in table 2. It is seen that the power factor remains almost unity with variation of duty cycle. Thus power factor improvement is achieved with proposed model.
5.
CONCLUSION
The proposed Boost rectifier is able to improve power factor and overall performance. With the harmonics filter and Boost switching action it is able to draw sinusoidal input current and almost unity power factor with various duty cycle. The efficiency is also improved and it is found above 80% from 0.05 to 0.65 duty cycle. The other advantages of this model are reduction of switching stresses, elimination of resonance problems and use of small input filter. Moreover, it is able to eliminate odd and even harmonics components thus total harmonics distortion is found in the range of maximum 14.7% and minimum 1.33%. Even though power factor is unity and performance is improved, it has some problems such that, the values of input current are higher in the beginning of duty cycle. The output voltage is found always greater than input voltage.
6.
REFERENCES
[1] Pan Ching-Tasai, and Sheih Jenn-Jong , " A single-stage
three phase boost-buck AC/DC converter based on generalized zero space vectors. ", IEEE Transactions on Power Electronics, Vol.14, N0.5, September 1999, . 949-947.
[2] Prasad, A.R., Phoivos, D., Ziogas, senior member, IEEE,
and stefanos Manias, "An active power factor correction technique for three phase diode rectifiers.", IEEE Transactions on Power Electronics, Vol.6, No.1, January 1999, pp. 83-91.
[3] Zargari, N.R., Ziogas, P.D., and Joos, G., " A two-switch
high-performance current regulated dc/ac converter module. ", IEEE Transactions on Industrial Applications, Vol.31, May/June 1995, pp.583-589
[4] Ghanemm, M., Haddas, K.A, and Ray, G., "A new single
phase buck-boost converter with unity power factor.", in IEEE APEC, 1993, pp. 785-792.
[5] Jin, He., Jacobs, Mark, E., "Two stage, three phase split
boost converter with reduced total harmonic distortion.",
http://www.patentstorm.us/patents/6031739-description.html.
[6] Wang, Chein-Ming, " A novel single-stage full bridge
buck-boost inverter ", IEEE, Transactions on Power Electronics, Vol.19, No.1, January 2004, pp. 150-158.
[7] Chan, Chok-You, " A nonlinear control for DC-DC
power converters. ", IEEE Transactions on Power Electronics, Vol.22, No.1, January 2007, pp. 216-221.
[8] Kikuch, Jun, and Lipo, Thomas, A., "Three-phase PWM
boost-buck rectifiers with power regenerative capability. ", IEEE Transactions on Industry Application , Vol.1, No.5, September/October 2002, pp.1361-1368.
[9] Abedin, A.H, Raju, A., and Alam, M.J., "Improvement of
input side currents of a three phase rectifier combining active and passive filters. ", Journal of Electrical Engineering., IEB, Vol.EE33, No.1&11, December 2006, pp. 87-90.
[10]Shieh, J. J., " SEPIC derived three-phase switching mode
rectifier with sinusoidal input current. ", Proc. IEE-Elect. Power Applicat., Vol.147, No.4, 2000.,pp.286-294.
[11] Ericksion, R.W.," Some topologies of high quality
rectifiers. ", in Proc. 1st Int. Conf. Energy, Power, and Motion Control, 1997, pp. 1-6.
[12]Tasi, F.S., " Low cost AC to DC converter having input
current with reduced harmonics. ", U.S. patent no. 5,652, 700, July,29,1997.
[13]Ruma and Mohammad Ali Ccoudhury, "Power Factor
Improvement of a Three Phase Rectifier by Boost Regulator.", Journal of Electrical Engineering The Institution of Engineers, Bangladesh Vol. EE 36, No. II, December 2009
[14]Ruma and Mohammad Ali Ccoudhury, Two Stages

![Table 1. Performance parameter of a three phase boost regulated rectifier [13], [14]](https://thumb-us.123doks.com/thumbv2/123dok_us/1321625.1640211/3.595.57.279.523.662/table-performance-parameter-phase-boost-regulated-rectifier.webp)