R E S E A R C H A R T I C L E
Open Access
Mitochondrial quality, dynamics and functional
capacity in Parkinson
’
s disease cybrid cell lines
selected for Lewy body expression
Emily N Cronin-Furman
1,2, M Kathleen Borland
3, Kristen E Bergquist
2, James P Bennett Jr
2,4and Patricia A Trimmer
2,5*Abstract
Background:Lewy bodies (LB) are a neuropathological hallmark of Parkinson’s disease (PD) and other
synucleinopathies. The role their formation plays in disease pathogenesis is not well understood, in part because studies of LB have been limited to examination of post-mortem tissue. LB formation may be detrimental to neuronal survival or merely an adaptive response to other ongoing pathological processes. In a human cytoplasmic hybrid (cybrid) neural cell model that expresses mitochondrial DNA from PD patients, we observed spontaneous formation of intracellular protein aggregates (“cybrid LB”or CLB) that replicate morphological and biochemical properties of native, cortical LB. We studied mitochondrial morphology, bioenergetics and biogenesis signaling by creating stable sub-clones of three PD cybrid cell lines derived from cells expressing CLB.
Results:Cloning based on CLB expression had a differential effect on mitochondrial morphology, movement and oxygen utilization in each of three sub-cloned lines, but no long-term change in CLB expression. In one line (PD63CLB), mitochondrial function declined compared to the original PD cybrid line (PD63Orig) due to low levels of mtDNA in nucleoids. In another cell line (PD61Orig), the reverse was true, and cellular and mitochondrial function improved after sub-cloning for CLB expression (PD61CLB). In the third cell line (PD67Orig), there was no change in function after selection for CLB expression (PD67CLB).
Conclusions:Expression of mitochondrial DNA derived from PD patients in cybrid cell lines induced the
spontaneous formation of CLB. The creation of three sub-cloned cybrid lines from cells expressing CLB resulted in differential phenotypic changes in mitochondrial and cellular function. These changes were driven by the expression of patient derived mitochondrial DNA in nucleoids, rather than by the presence of CLB. Our studies suggest that mitochondrial DNA plays an important role in cellular and mitochondrial dysfunction in PD. Additional studies will be needed to assess the direct effect of CLB expression on cellular and mitochondrial function.
Background
The neuropathological diagnosis of Parkinson’s disease (PD) is based on the loss of dopaminergic neurons in the substantia nigra, as well as by the presence of Lewy bodies (LB) and Lewy neurites in the substantia nigra and other brain regions [1]. A plethora of models have served as the foundation for research into PD pathogenesis. They range
from yeast to primates and utilize nuclear gene expression based on inherited forms of PD, as well as dopaminergic neurotoxins [2].
Of these PD models, human cytoplasmic hybrids or “cybrids” are unique because platelet-derived mitochon-drial DNA (mtDNA) from sporadic PD patients is ex-pressed in mtDNA-free (Rho0) human neuroblastoma (SH-SY5Y) cells or other cell lines [3,4]. Human cybrid cell lines provide an opportunity to study cellular consequences of the expression of mtDNA from sporadic PD patients.
Recent studies have clearly linked the consequences of mitochondrial dysfunction with sporadic and familial forms of PD [5,6]. Our PD cybrid lines are characterized, * Correspondence:[email protected]
2
Parkinson’s and Movement Disorders Center, Virginia Commonwealth University, Richmond, VA 23298, USA
5
Department of Anatomy and Neurobiology, Virginia Commonwealth University, Richmond, VA 23298, USA
Full list of author information is available at the end of the article
in part, by abnormalities in oxygen utilization and mito-chondrial electron transport chain (mtETC) function [3,7]. In addition, PD cybrid lines spontaneously generate intracellular proteinaceous aggregates (cybrid Lewy bod-ies: CLB) that replicate the composition and ultrastructure of cortical LB [8]. Like LB in PD brain sections, CLB in our PD cybrid lines created from individual PD patients stain with eosin, Congo red, Thioflavin S,α-synuclein, and ubiquitin, as well as with markers for mitochondria, the proteasome and lysosomes [8]. Until recently, LB studies have been limited to the analysis of post-mortem tissues [9-11]. CLB formation in PD cybrids provides a unique opportunity to explore the influence of LB formation on cellular and mitochondrial function in a live cell model.
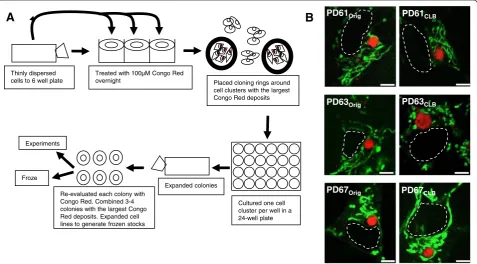
In an effort to better understand the relationship be-tween CLB expression and mitochondrial and cellular dysfunction, we selected three different CLB-expressing PD cybrid cell lines that exhibit a range in oxygen con-sumption from severely compromised to near normal function. The three PD cybrid lines used in this paper were generated from platelets donated by patients at stage 2.0 Hoehn and Yahr Parkinson’s disease staging score (see Additional file 1). Other patient characteristics such as age, disease duration, L-dopa therapy and pres-ence of dementia were also determined (see Additional file 1). Each of these three original PD cybrid lines (PD61Orig, PD63Orig, PD67Orig) was sub-cloned to enrich
for cells expressing CLB by labeling the CLB in living cells with Congo red. Cell clusters expressing CLB from each PD line were selected, sub-cloned and expanded to generate cybrid lines PD61CLB, PD63CLB and PD67CLB
(see Figure 1A).
Because other investigators have suggested that LB may be detrimental to neuronal function and survival [12-14], we anticipated that CLB-selected PD cybrid lines (PDCLB)
would exhibit compromised function compared to the ori-ginal PD cybrid lines (PDOrig). Contrary to our
expec-tations, enrichment for CLB expression differentially affected each of the three PDOrigcybrid lines. Cellular and
mitochondrial function improved in PD61CLB, worsened
in PD63CLB and was unchanged in PD67CLB. Analysis of
our results indicates that CLB expression in PDCLBcybrid
lines did not correlate with the changes in cellular and mitochondrial function we detected. Rather, the change in
function between PDOrig and PDCLB cybrid lines was
determined by the presence or absence of mtDNA in nucleoids in PDOrigcells containing CLB.
Results and Discussion
CLB morphology and composition in PDOrigand PDCLB
cybrid lines
Like LB in PD brain tissue, CLB in all PDOrigand PDCLB
cybrid lines exhibited a consistent range in size (see
PD63CLB PD63Orig
A
B
Thinly dispersed cells to 6 well plate
Treated with 100µM Congo Red
overnight Placed cloning rings around cell clusters with the largest Congo Red deposits
Cultured one cell cluster per well in a 24-well plate Expanded colonies
Re-evaluated each colony with Congo Red. Combined 3-4 colonies with the largest Congo Red deposits. Expanded cell lines to generate frozen stocks Froze
Experiments
PD61Orig PD61CLB
PD67Orig PD67CLB
Figure 1PDCLBcell lines were created from PDOrigcell lines. (A)PDCLBlines were created by selecting for cells containing large, circular,
Additional file 2) and stained uniformly with the histo-chemical dye Congo red (Figure 1B). Congo red binds to fibrillarα-synuclein as well as other misfolded, amyloidal (beta-pleated sheet folded) proteins [15]. While Congo red does not cross the blood brain barrier, it will cross living cell membranes and label intracellular amyloidal aggre-gates in vitro [16,17]. Like LB in PD brain, CLB also la-beled with antibodies to α-synuclein and polyubiquitin (see Additional file 3).
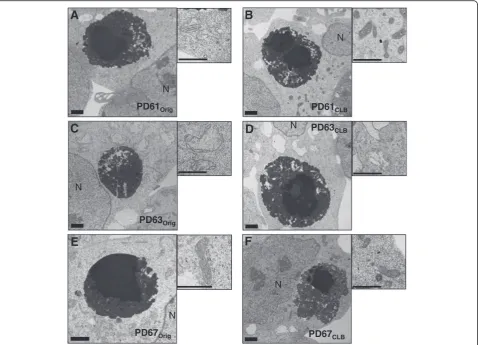
Using electron microscopy, CLB in all six PDOrig and
PDCLB lines were structurally equivalent (Figure 2). The
heterogeneous, dense granular appearance of CLB at the electron microscope level (EM) suggests that small pro-tein aggregates contribute to the continuous formation of CLB (Figure 2). LB in PD brain tissue are also composed of aggregated, dense granular material [18]. CLB do not consistently contain straight filaments, consequently they
more closely resemble cortical LB, rather than brainstem LB [8].
Generation of PDCLBlines using Congo red to select
CLB-expressing cells
In cultures of PD61Orig, PD63Orig and PD67Orig cybrid
lines, cells with Congo red-labeled CLB were selected and propagated to generate sub-cloned lines enriched for cells with CLB (PD61CLB, PD63CLBand PD67CLB). PDCLB
sub-cloned lines were propagated for 30 to 74 days, at which time numerous aliquots of each line were frozen for future use (see Figure 1A and Methods). Early in the sub-cloning process, CLB expression was increased (data not shown). However, assessment of Congo red-positive pixel intensity, pixel length or pixel area in cultures derived from current frozen stocks of PDCLBlines (at least 4-12 passages older)
revealed no difference in the frequency of Congo
red-PD61Orig
N
A
PD63Orig N
C
PD67Orig N
E
PD61CLB N
B
PD63CLB N
D
PD67CLB N
F
Figure 2Electron micrographs of CLB and mitochondria in PDOrigand PDCLBcybrid lines.CLB in PDOrig(A, C, E)and PDCLB(B, D, F)lines
positive staining among the PDOrigand PDCLBlines.
Fur-thermore, there was no change in CLB expression fre-quency (see Additional file 2).
To understand why increased CLB expression was not sustained in PDCLBcybrid lines, it is important to think of
CLB as aggresomes (as suggested by Olanow et al. [19]). Aggresomes are created in vitro by transiently inducing protein misfolding or the over-expression of proteins that are prone to misfolding [19]. Because the generation of misfolded and damaged proteins is continuous in PD cybrid lines, we consider CLB to be “professional
aggre-somes.” Like aggresomes, CLB form in the perinuclear
region, contain punctate gamma tubulin staining and are composed of aggregated, damaged and misfolded proteins [8]. Some speculate that LB are“permanent trash dumps”, while others consider LB to be recycling centers [19]. Fur-ther studies will be necessary to address this important topic. One way to determine if CLB are trash dumps or re-cycling centers is to visualize changes in the distribution and expression of fluorescently labeled proteins in CLB using fluorescence recovery after photobleaching.
In PD substantia nigra, the expression level of LB appears to be constant (3-4%) irrespective of the duration of the disease. This observation is consistent with the idea that LB are constantly forming and being eliminated [20].
The frequency of CLB expression in PDCLB clones and
parent PDOrigcybrid cell lines was also comparable to the
frequency of LB found in PD patient brain [21].
There are several potential mechanisms that could con-tribute to CLB expression levels in PD cybrid lines. Rujano et al. [22] showed that aggresomes are asymmet-rically distributed during somatic and stem cell mitosis. One daughter cell retains the aggresome while the other is free of damaged and misfolded proteins [22,23]. The same asymmetric inheritance of aggresomes also happens when a cybrid cell with a CLB undergoes mitosis (data not shown). If CLB-free daughter cybrid cells proliferate more efficiently than cells with the burden of a CLB, the frequency of CLB-positive cells would decline during cell line expansion after initial sub-cloning. CLB-positive cells are not completely eliminated from cybrid lines because protein misfolding and aggregation is an ongoing process. Each PDOrigand PDCLBcybrid line (see Additional file 2)
achieved a steady state level of CLB expression compar-able to Rujano et al. [22].
Another potential mechanism that may play a role in the steady state level of CLB expression is cytoplasmic ex-trusion. Extracellular LB have been identified in PD brain sections using α-synuclein antibodies [24]. Doehner et al. [25] characterized the accumulation of granular Reelin/ β-amyloid deposits in mouse hippocampus. They detected Reelin-positive budd-like extrusions that they claim re-present a protective reaction by postmitotic neurons with impaired protein degradation pathways. The extruded
misfolded proteins, mitochondria, vacuoles and debris are then cleared by intrinsic glia [25]. Extracellular CLB have been seen in cultures of PD cybrid cell lines (See Additional file 4) that may be the result of cytoplasmic ex-trusion. The time-lapse studies of CLB-expressing cells needed to confirm this possibility are beyond the scope of this paper.
Mitochondrial morphology in PDOrigand PDCLBcybrid lines Mitochondrial shape and changes in shape are intrinsically related to essential cellular functions such as mitochondrial membrane potential, ATP production, calcium signaling and ROS generation (reviewed in [26]). Consequently, the morphology of mitochondria either at the light or EM level provides insight into their functional capacity. Using light microscopy, we observed that mitochondria in PD61Orig,
PD63Orig and PD67Orig cells containing CLB varied from
elongate to short rod-like or globular in shape (Figure 1B).
The mitochondrial morphology in the PDOrig lines was
consistent with previous studies of PD cybrid cell lines [27].
Mitochondrial morphology at the light microscope level
was qualitatively unchanged in PD61CLB and PD67CLB
when compared to PD61Orig and PD67Orig, respectively
(Figure 1B). However the mitochondria in PD63CLBwere
noticeably different from those in PD63Orig (Figure 1B).
PD63CLB mitochondria were swollen, fragmented and
globular, rather than rod-like.
The shift from rod-like mitochondria in PD63Orig to
swollen, fragmented and globular mitochondria in PD63CLB
is evidence of altered mitochondrial dynamics. Mitochon-drial fragmentation can have many different causes [28]. Fragmented and dysfunctional, rather than elongated mito-chondria, are more susceptible to mitophagy [29,30]. Future studies will be necessary to reveal the specific cause of mitochondrial fragmentation in PD63CLB. Mitochondrial
movement, especially in neuronal processes, is also influ-enced by mitochondrial shape (reviewed in [31]). Measure-ment of mitochondrial moveMeasure-ment in the processes of differentiated PDOrigand PDCLBcybrid neurons is described
below.
In light of these observations, we also processed fixed pellets of each PDOrigand PDCLBcell line for EM (Figure 2).
Mitochondrial morphology at the EM level was qualita-tively unchanged in PD67CLBwhen compared to PD67Orig
(Figure 2E, F). The majority of the mitochondria in both PD67Origas well as PD67CLBcells exhibited normal
morph-ology with a rod-like shape, organized cristae and a dense matrix (Figure 2E, F). At the EM level, mitochondria in
PD61Orig were enlarged (increased width) with a pale
matrix and reduced numbers of cristae (Figure 2A, B).
The mitochondrial morphology in PD61CLBwas improved
compared to PD61Orig with normal appearing rod-like
#
#
**
#
#
#
#
A B
C D
E F
Figure 3Respiration rates of PDOrigand PDCLBcybrid clones. (A, C, E)OCR was measured using the Seahorse XF24 analyzer for all three PD
(Figure 2A, B). The mitochondria in PD63Orig cells were
swollen with a pale matrix and reduced and irregularly
shaped cristae (Figure 2C, D). PD63CLB had primarily
globular mitochondria with few cristae and a transparent matrix (Figure 2C, D).
Many critical mitochondrial functions are localized to cristae, such as the mtETC, iron/sulfur cluster biogenesis and the transport of mtDNA encoded proteins according to Zick et al. [32]. Therefore, the severe loss and disrup-tion of cristae in PD63Orig and PD63CLB suggests that
functions such as the mtETC and oxygen utilization should be dysfunctional. It has been estimated that 67% of all mitochondrial proteins are located in the matrix [33]. The matrix is the site for hundreds of enzymes, some of which participate in pyruvate and fatty acid metabolism and the citric acid cycle. Mitochondrial DNA enclosed in nucleoids, mitochondrial ribosomes and tRNAs are also localized in the matrix. The loss of matrix density in globular mitochondria in cybrid cells like PD63Orig and
PD63CLB is indicative of a functionally disabled organelle
that is a potential risk to the cell it occupies. Changes in mitochondrial morphology, such as the conversion of rod-like shapes to globular shapes can alter the cellular distri-bution of mitochondria. In complex cells like neurons, swollen and globular mitochondria can contribute to loss of synaptic function or cell death because these morpho-logically abnormal mitochondria cannot be transported into narrow caliber axons and dendrites [31,34].
Mitochondrial oxygen consumption in PDOrigand PDCLBlines Taking into account the abnormalities in mitochondrial morphology between some PDOrigand PDCLBcybrid lines,
we measured oxygen consumption using a Seahorse Extracellular Flux Analyzer XF24 (Seahorse Bioscience) [35-37]. The three PDOriglines that were selected for CLB
cloning expressed a range of basal oxygen consumption values prior to cloning (Figure 3). If CLB expression is det-rimental to cell function, then we anticipated that all three
PDCLB lines would exhibit reduced oxygen consumption
compared to PDOriglines. Figure 3 shows the oxygen
con-sumption rates (OCR) of confluent cultures of PDOrigand
PDCLBlines at baseline and after sequential treatment with
specific inhibitors (oligomycin to inhibit ATP synthase, carbonyl cyanide 4-(trifluoromethoxy)phenylhydrazone (FCCP) to dissipate the proton gradient across the inner mitochondrial membrane, rotenone to inhibit complex I and antimycin A to inhibit complex III, see Methods). Use of these inhibitors permits the determination of key aspects of mitochondrial function including basal OCR, maximum capacity OCR, ATP-linked OCR, complex I-linked OCR and the non-mitochondrial (residual) OCR [36,37]. Given the abnormal mitochondrial morphology shown above, it is important to determine if exposure to specific mitochondrial inhibitors during measurements of
OCR cause any cell loss. For all three pairs, there was no difference between PDOrigand PDCLBlines in cell viability
at the end of the experiment, as measured by live-dead counts (data not shown). The cell viability in these cell lines also did not significantly differ from the disease-free controls (n= three control lines).
PD61CLB had significantly higher basal, maximal and
complex I-linked OCR when compared to PD61Orig
(Figure 3A, B) suggesting that sub-cloning of cells expres-sing CLB resulted in improved oxygen consumption in PD61CLBcells. This change was mtETC selective because
there was no significant change in glycolysis (measured as extracellular acidification rate- ECAR, a surrogate for lac-tate production and aerobic glycolysis, data not shown) or in non-mitochondrial (residual) respiration. Significant improvements in basal, complex I-linked and maximum capacity OCR are also consistent with the improvement in mitochondrial ultrastructure in PD61CLBcells compared to
PD61Orig(Figure 2B).
In contrast, PD63CLB had minimal levels of basal OCR
and its response to mitochondrial inhibitors was significantly
reduced when compared with PD63Orig (Figure 3C, D).
There were also significant reductions in basal, maximum
capacity, complex I- and ATP-linked OCR in PD63CLB
compared to PD63Orig. However, there was no significant
change in non-mitochondrial respiration. Therefore, this
change in OCR in PD63CLB was selective for mtETC.
There was also no compensatory up-regulation in ECAR in PD63CLB. This was surprising because other studies
have shown that loss of complex I activity as a result of neurotoxicity induces a loss of OCR with a corresponding increase in ECAR [38]. This loss of mtETC function and OCR is consistent with the abnormal morphology of mito-chondria in PD63CLBcells (Figure 2D).
Finally, PD67CLB exhibited basal, maximum capacity
and complex I-linked OCR that was unchanged from
PD67Orig (Figure 3E, F). There was also no change
in ECAR (glycolysis) or non-mitochondrial respiration. These OCR values correlate with the consistent, normal morphology of mitochondria in PD67Origand PD67CLBat
the light and EM levels (Figures 1B, 2E, F).
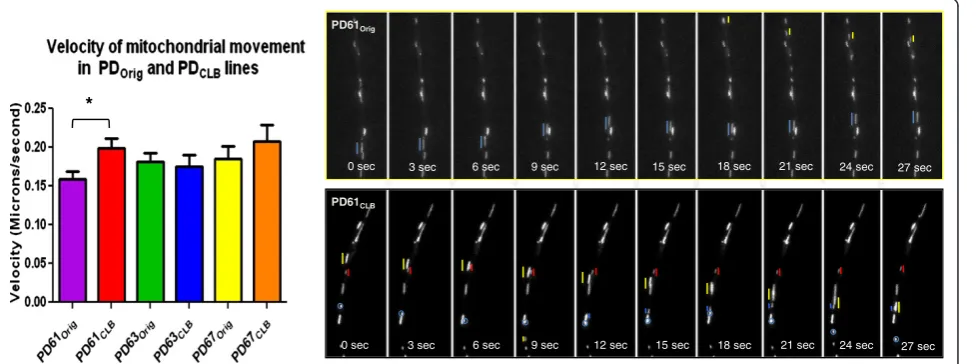
Movement of mitochondria by axonal transport in PDOrig
and PDCLBcybrid lines
are involved in altered axonal transport because LB can become Lewy neurites. Mitochondrial movement both an-terograde and retrograde depends on motor proteins that utilize ATP [43]. Chu et al. [39] reported a decline in motor proteins early in sporadic PD brain that precedes other PD related changes like loss of dopamine or tyrosine hydroxylase. This loss of motor protein expression was also highest in nigral neurons containing α-synuclein inclusions.
We previously showed that axonal transport of mitochon-dria was significantly reduced in the tyrosine hydroxylase-containing processes of PD cybrids [44]. To study changes in axonal transport, PDOrig and PDCLB cybrid lines were
differentiated into neuronal cells using low doses of stau-rosporine [45]. We measured the axonal transport velocity of fluorescently labeled mitochondria in individual cybrid neuron processes. In agreement with previous studies, mitochondrial velocity was reduced in all differentiated PDOrigcell lines compared to differentiated SH-SY5Y cells
[44]. The velocity of mitochondrial movement in PD67CLB
was not significantly different from PD67Orig (Figure 4).
This outcome is consistent with the lack of change in
mitochondrial morphology and OCR in PD67CLB after
subcloning. Only PD61CLBexhibited a significant increase
in mitochondrial velocity compared to PD61Orig(Figure 4).
This result is consistent with other improvements in mito-chondrial morphology and OCR (Figures 2B, 3A, B).
Given the poor mitochondrial morphology and OCR in PD63CLB, it was a surprise that mitochondrial velocity was
not comparably reduced (Figure 4). Whether induced by low dose staurosporine or retinoic acid, neuronal differen-tiation imposes increased demands for ATP and increased cellular stress. It is likely that cells with poor oxygen utilization and mitochondrial function are incapable of completing the process of differentiation. Therefore the most dysfunctional cells in PD63CLB should fail to
differ-entiate. Additional file 5A depicts typical phase contrast images of PDOrigand PDCLB cybrid cells after
differenti-ation. The cell density in a microscope field of
differen-tiated PD63Orig and PD63CLB cybrid neurons was
noticeably lower than the cell density for other cybrid lines. This information is also presented graphically in Additional file 5B. These data support the proposition that PD63orig cells with inadequate mitochondrial function
were unable to differentiate and only those cells with suffi-cient mitochondrial function differentiated into neurons. Consequently the velocity of mitochondrial movement in differentiated PD63CLB neurons was comparable to other
PD cybrid cell lines.
Nucleoid density in PDOrigand PDCLBcybrid cell lines The sub-cloning of cybrid cells expressing CLB did not re-sult in a uniform change in mitochondrial function among the PD cybrid cell line pairs. To establish if changes result-ing from sub-clonresult-ing could be due to changes in mtDNA distribution, we first visualized nucleoids. Nucleoids are structures consisting of one or more mtDNA molecules and associated proteins like single-stranded DNA binding *
PD61Orig
PD61CLB 0 sec
0 sec 3 sec
3 sec 6 sec
6 sec 9 sec
9 sec
12 sec
12 sec 15 sec
15 sec 18 sec
18 sec 21 sec
21 sec 24 sec
24 sec 27 sec
27 sec
Figure 4Mitochondrial movement in differentiated in PDOrigand PDCLBcell lines.The graph shows the velocity of mitochondrial
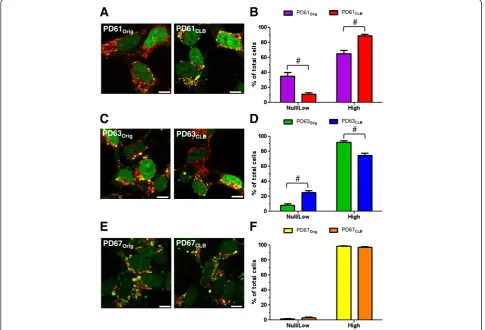
protein, Twinkle, mtDNA helicase and mitochondrial transcription factor A (TFAM) among others [46-48]. To visualize nucleoids, we used the DNA stain PicoGreen in combination with MitoTracker CMXRos (MTRed; Figure 5A, C, E) in live PDOrig and PDCLB cybrid cells.
Nucleoid content was scored as “low/null” or “high” in cells from each of the PD cybrid pairs (Figure 5B, D, F, see Methods). Rho0 cells that lack mtDNA are devoid of PicoGreen staining and nucleoids (data not shown and [46]). PicoGreen staining is also independent of mem-brane potential or mtETC function [46]. PD61Orig
con-tained cells that fell into the“low/null”category as well as cells with“high” numbers of nucleoids (Figure 5A, B). In contrast, PD61CLB contained significantly fewer cells in
the “low/null” category and more cells in the “high” nucleoid category compared to PD61Orig(Figure 5B). This
increase in cells with“high”numbers of nucleoids is con-sistent with previous data in this paper showing an
improvement in mitochondrial function and morphology in PD61CLB. PD63CLB had significantly more cells that
scored “low/null” and fewer cells in the “high” category than PD63Orig(Figure 5D). This was not surprising given
the decline in PD63CLB mitochondrial function and
morphology. Levels of nucleoid expression in PD67Orig
and PD67CLBwere comparable and consistent with
previ-ous data in this paper (Figure 5F).
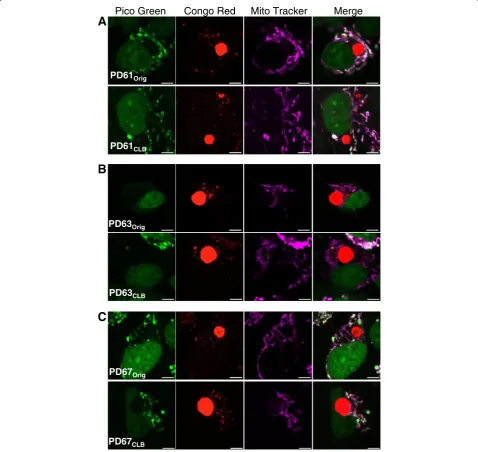
In light of these results, we visualized nucleoids in indi-vidual PDOrigand PDCLBcells containing CLB using
fluor-escent markers: Congo red (CLB and small protein aggregates), PicoGreen (nucleoids) and MitoTracker Deep Red (mitochondria) as shown in Figure 6. Remarkably, we found that all CLB-positive PD61Origcells contained
nu-merous nucleoids (Figure 6A, top panel). The same result was true of PD67Orig(Figure 6C, top panel). However, the
majority of CLB-expressing cells in PD63Origdid not
con-tain nucleoids (Figure 6B, top panel). Taken together, these
#
#
#
#
A
C
E
B
D
F
PD61Orig PD61CLB
PD63Orig PD63CLB
PD67Orig PD67CLB
Figure 5Nucleoid content in PDOrigand PDCLBcybrid lines. (A, C, E)Representative images of nucleoids in the PDOrigand PDCLBpairs using
PicoGreen and MTRed (green: DNA, red: mitochondria). Yellow puncta are nucleoids in mitochondria. Cells that lack nucleoids are red with no yellow puncta (A). The nucleoids in PD63Origand PD63CLB(C)were larger in diameter.(B, D, F) Cells were scored for nucleoid content as either
results indicate that the nucleoid content of the PDOrig
cells containing CLB correlates with changes in mitochon-drial quality and function detected in PDCLB cell lines.
PD61CLB had better mitochondrial quality and function
because it was sub-cloned from PD61OrigCLB-expressing
cells containing numerous nucleoids. PD63CLB had
reduced mitochondrial quality and function because it
was sub-cloned from CLB-containing cells in PD63Orig
with few nucleoids. CLB-containing cells in PD67Orighad
numerous nucleoids and these cells yielded the PD67CLB
cybrid line that also had cells with high numbers of nucleoids as well as adequate mitochondrial quality and function.
Gene expression levels for mtETC genes in PDOrigand
PDCLBcell lines
Since nucleoids contain mtDNA, we examined mtDNA copy number and expression in PDOrig and PDCLB lines.
Previous studies have shown that complex I is damaged and functionally impaired in post-mortem PD cortex homoge-nates [49]. Analysis of PD cybrid cell lines (including the three PDOrig lines included in the paper) showed that
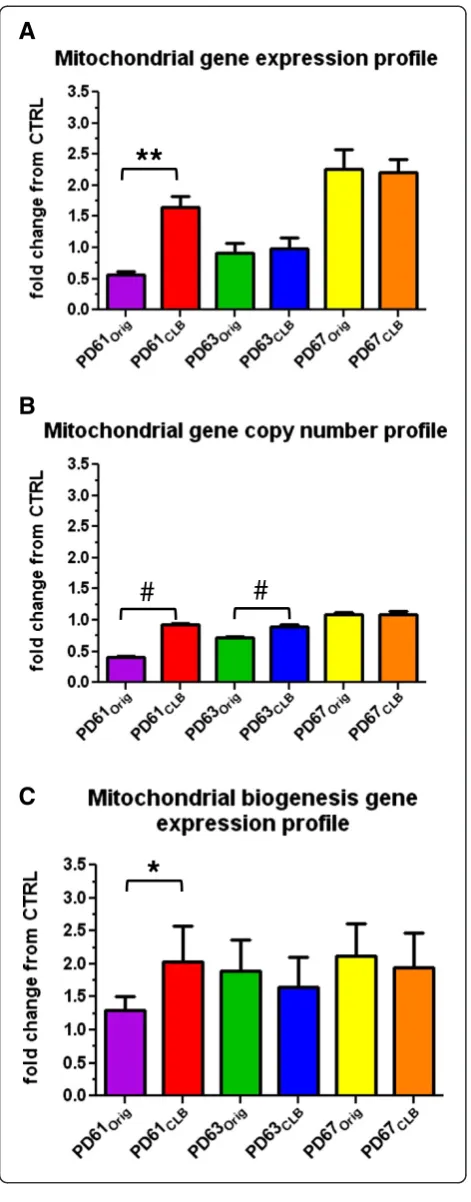
complex I gene expression was reduced and showed a robust correlation with the changes in mtETC gene ex-pression found in post-mortem PD cortex [50]. Enzymatic dysfunction related to complex I assembly is often asso-ciated with deficiencies in complexes III and IV because complex I assembly intermediates act like a scaffold for the assembly of other complexes in the mtETC [51]. We therefore measured gene expression and gene copy num-ber for mitochondrial genes ND2 and ND4 (complex I), CO3 (complex IV) and 12s ribosomal RNA using quanti-tative real-time polymerase chain reaction (RT-qPCR) to create mitochondrial gene expression and copy number profiles (Figure 7).
Figure 7A and B show that mitochondrial gene expres-sion in PD61CLBincreased nearly 3-fold and copy number
increased more than 2-fold over PD61Orig. This observed
improvement in mitochondrial gene expression and copy
number in PD61CLB is consistent with the improved
nucleoid content in PD61CLBcells. Furthermore, mtDNA
copy number improved to control levels in PD61CLBwhile
mtDNA expression levels were more than 2-fold higher than control levels. These results also suggest a potential mechanism for the improved mitochondrial morphology, mitochondrial respiration and mitochondrial movement observed in PD61CLB(Figures 1B, 2A, 2B, 3A, 3B, 4A) and
supports our conclusion that mtDNA content in the cells containing CLB in PD61Orig was a driving factor in the
functional improvements we observed in PD61CLB.
Mitochondrial gene expression was unchanged and remained reduced, as compared to control in both PD63Origand PD63CLB(Figure 7A). There was a slight but
significant increase (less than 2-fold) in mitochondrial gene
copy number in PD63CLB (Figure 7B). This increase in
gene copy number was surprising. We expected a decrease in mitochondrial gene copy number considering the reduced number of cells that scored “high” for nucleoid content (Figure 5C, D). Ashley et al. [46] suggested that fu-sion of nucleoids can occur as cells strive to maintain mtDNA copy number. Also, there is a linear relationship between mtDNA content and nucleoid volume [52]. Con-sequently, the large nucleoids in PD63CLB(Figure 5C) may
harbor increased numbers of mtDNA. Additionally, PD63CLBhad a decline in mitochondrial function and
de-crease in mitochondrial respiration, as compared with PD63Orig (Figures 1B, 2C, 2D; 3C, 3D, 4A). We speculate
that this slight increase in mitochondrial gene copy num-ber could be a compensatory mechanism. Since there was no change in mitochondrial gene expression, the increase in mtDNA copy number did not have downstream func-tional consequences. The poor cellular and mitochondrial function in PD63CLBreflects this outcome.
As expected, there was no change in mitochondrial gene expression or copy number between PD67Origand PD67CLB
(Figure 7A, B). Both of these cell lines exhibited similar mitochondrial morphology, mitochondrial respiration, mitochondrial movement and nucleoid content (Figures 1, 2, 3, 4). These results suggest that creation of PD67CLB
from PD67Origcells containing CLB did not substantially
alter mtDNA genetic or phenotypic expression.
Biogenesis gene expression in PDOrigand PDCLBlines Cellular regulation of mitochondrial biogenesis is critical for the maintenance of a functional pool of mitochondria in neurons [53]. In fact, the mitochondrial biogenesis pathway has emerged as a potential therapeutic target for PD [53,54]. Peroxisome proliferator-activated receptor gamma co-activator 1-alpha (PGC-1α) is a transcriptional co-activator and serves as the master regulator of mito-chondrial biogenesis (reviewed by [55]). A genome-wide analysis of PD patients and controls found that PGC-1α expression was reduced in PD patients [54]. Overexpres-sion of PGC-1αin neurons was found to be protective in a neurotoxin mouse model of PD [56]. In cell culture, pri-mary fibroblasts and cybrids generated using mtDNA
from patients with mitochondrial diseases showed
improved respiration after increased PGC1-α expression [57]. PPAR (peroxisome proliferator-activated receptor) agonists, such as bezafibrate (an agonist of PPARα), have also been shown to improve mitochondrial function in pa-tient fibroblasts and myoblasts [58] and in a mouse model of mitochondrial disease [59].
To explore what role mitochondrial biogenesis plays in
the mitochondrial changes found between the PDOrig
and PDCLB lines, we measured the expression of four
factor B1 (TFB1M) and mitochondrial transcription factor A (TFAM), and used their expression levels to create a mitochondrial gene biogenesis profile. NRF1 is a DNA-binding protein that serves to positively regulate nuclear-encoded subunits of the mtETC [60]. In contrast, TFB1M
and TFAM bind directly to mtDNA to initiate
mitochondrial-encoded gene transcription [61,62]. These four genes represent control of nuclear- and mitochondrial-encoded mtETC gene transcription, thereby creating a gene
expression profile that can be used to quantitate cell-wide activation of mitochondrial biogenesis.
In PD61CLB, expression of mitochondrial biogenesis
genes was significantly increased by approximately 1.5-fold compared to PD61Orig(Figure 7C). Improved
biogen-esis is consistent with the increased mitochondrial gene expression and mtDNA copy number described above (Figure 7A, B) and with the general improvement in cellu-lar and mitochondrial function in PD61CLB compared to
Pico Green Congo Red Mito Tracker Merge
PD61Orig
PD61CLB
PD67Orig
PD67CLB PD63Orig
PD63CLB
A
B
C
Figure 6Nucleoid content in cells containing CLB in PDOrigand PDCLBcell lines. (A,B,C)Representative images of cells containing CLB in
PDOrigand PDCLBpairs. Cells were triple-stained with PicoGreen, Congo red, and MitoTracker Deep Red (green: DNA, red: CLB, purple:
PD61Orig. This improvement in biogenesis may represent
a shift in the population of cybrid cells in PD61CLBto
in-clude more cells with improved mtDNA gene expression and copy number, or it may represent the improved
ex-pression of mitochondrial genes within cells. PGC-1α
enhances mtETC function and biogenesis by integrating cellular signals such as AMP/ATP ratios via the AMP-activated kinase (reviewed in [63]). Further research into this area would be beneficial for understanding the thera-peutic potential of PGC-1αmanipulation.
There was no difference in biogenesis gene expression between PD63Origand PD63CLB(Figure 7C). This was not
unexpected due to the decline in mitochondrial function in PD63CLB, compared to PD63Orig (Figures 3, 4). There
was also no change in biogenesis gene expression between PD67Origand PD67CLB(Figure 7C). This was also expected
because there was no difference in mitochondrial gene ex-pression, gene copy number, or mitochondrial function be-tween these two cell lines.
It is important to remember that in the cybrid model, mtDNA from individual patients is expressed against a common background of nuclear genes from the SH-SY5Y parent cell line. The differences we observed in expression of nuclear mitochondrial biogenesis genes across different cybrid lines are ultimately a consequence of the presence of individual patients’ mtDNA. However, the differences in mitochondrial biogenesis signaling across PDCLB
com-pared to PDOrig cell lines within each cybrid line are
derived from selection of CLB-producing cybrids. We found that selection of cybrid cells for CLB expression had a differential effect on mitochondrial biogenesis. Mitochondrial biogenesis gene expression improved in PD61CLB, but was unchanged in PD63CLBand in PD67CLB.
The molecular origins of these different consequences of CLB cloning remain unclear but suggest that the correl-ation between CLB expression and mitochondrial biogen-esis signaling is not consistent.
**
A
#
#
B
C
*
Figure 7Quantitative real-time PCR analysis of gene profiles in PDOrigand PDCLBcell lines. (A)Mitochondrial gene expression for
Concluding Remarks
Due to the lack of PD models that spontaneously make LB, studies have been limited to cataloging contents or in-ferring mechanism of formation and cellular consequences of LB formation from post-mortem tissue (for example, [9-11]). While neuropathological studies have been very valuable, a live cell model would help investigate the bio-logical significance of LB for PD pathogenesis. The disco-very that PD cybrid cell lines spontaneously form and express CLB has provided us with a much needed live cell model of LB. CLB display the components found in LB in PD brain including eosinophilia, α-synuclein-, ubiquitin-, parkin- and Thioflavin S-staining [8]. Furthermore, CLB in PD cybrid lines are generated without the need for genetic over-expression of molecules likeα-synuclein or inhibiting proteolytic processes such as proteosomal degradation or autophagy. PDOrig cybrid lines demonstrate that
expres-sion of the PD patient platelet mtDNA genes is responsible for the formation of CLB. By generating PDCLBcybrid cell
lines from PDOrigcybrid cells expressing CLB, our aim was
to create a model that focused on the cellular conse-quences of CLB formation.
The clinical significance of LB has been widely debated [64]. LB expression in the basolateral nucleus has been associated with visual hallucinations in PD [65]. Also, there are increased numbers of LB in demented versus non-demented PD brain sections from cortex, limbic structures and amygdala [66]. Several research groups have argued that LB are detrimental and contribute to neuronal dege-neration in PD [12-14]. Harrower et al. [67], in contrast, proposed that LB mark a“struggling cell,”a concept of the LB that is consistent with the results presented in this paper. Harrower et al. [68] and others have suggested that LB are formed by neurons in a effort to maintain normal function in the face of an ongoing pathological process [11,69-72]. The nature of the pathological process that results in LB formation has also been a subject of specula-tion. Zhou et al. [73] and Lin et al. [74] suggested that mitochondrial dysfunction precedes and drives LB path-ology and neurological dysfunction in PD. The results presented in this paper support the proposal that mito-chondrial dysfunction drives CLB pathology. Other altera-tions in cellular funcaltera-tions such as over-expression and aggregation of mutated α-synuclein or over-expression of wild typeα-synuclein can also generate LB [73,75].
If CLB are detrimental for cells, then all three PDCLB
lines should have exhibited worsening of cellular and mitochondrial functions. This did occur in PD63CLB, but
not in PD61CLB or PD67CLB. If CLB are an asset with
beneficial functions, then cellular and mitochondrial
func-tion should improve. This was the outcome in PD61CLB
but not in PD63CLBor PD67CLB. Sub-cloning
CLB-expres-sing cells to produce PD67CLBdid not substantially alter
cellular or mitochondrial function. These data suggest that
selection and sub-cloning of PDOriglines for CLB
expres-sion did not drive the dysfunction in PDCLBcybrid lines.
Whileα-synuclein aggregation does occur in PDOrig and
PDCLBcybrids, levels ofα-synuclein expression measured
by RT-qPCR were not significantly different between PDOrig and PDCLB lines (see Additional file 6). Further
studies are needed to determine what role LB play in PD. As proposed by Kanazawa et al. [42], LB and Lewy neur-ites may be more specifically involved in the disruption of axonal transport and the removal of damaged and mis-folded proteins.
Our studies of PDOrigand PDCLBcybrid cell lines suggest
that mtDNA is key to the expression of cellular and mito-chondrial dysfunction, such as altered ETC activity and oxygen utilization, abnormal mitochondrial morphology, changes in axonal transport, etc. The PDCLBcell lines that
featured significant changes in mitochondrial function and morphology also had distinct changes in mtDNA copy number and/or expression from the PDOriglines. Our data
supports the proposition by Esteves et al. [6] that mtDNA dysfunction is at least partly responsible for mtETC defects in sporadic PD. Exner et al. [5] further concluded that mito-chondrial dysfunction is a“common denominator” in the pathogenesis of sporadic and familial PD.
One intriguing finding in our data was the identification of individual cells with CLB that appeared to lack nucleoids and functional mtDNA (see Figure 6B). Since formation of an aggresome or CLB is ATP-driven, it seems unlikely that a cell without mtDNA could generate a CLB. This idea leads to speculation that loss of mtDNA and nucleoids could be part of PD pathogenesis. CLB-bearing PD cybrid cells without mtDNA or nucleoids can survive in culture because of the supportive culture conditions. Nucleoid-free and mtDNA-free neurons are unlikely to survive in vivo unless they can derive sufficient support from surrounding glia. The composition of LB in neuro-pathological tissue from pre-PD substantia nigra suggests the convergence of multiple pathways such as mitochon-drial dysfunction, oxidative stress, oxidative protein dam-age and altered post-translational modification play a role in PD disease progression [76]. This concept is supported by a recent publication that showed nuclear α-synuclein binds to the PGC-1α promoter in vivo and in vitro, and alters mtDNA copy number and function [77]. Our con-tribution to this ever-changing field has been to demon-strate the important role that mitochondrial quality, dynamics and function play in PD.
Methods
Cybrid cell lines
Dulbecco’s modified Eagle medium (DMEM, Gibco, Life Technologies) with 10% fetal bovine serum, antibiotic/
antimycotic, 100μg/ml sodium pyruvate and 50μg/ml
uridine, as described previously, to support the survival of cells with mitochondrial dysfunction [8,79]. For im-aging, cells were plated on 35mm poly-lysine coated dishes (MatTek Corp.). Cell lines were only kept in culture for a
maximum of two months. Cell pellets from PDOrig and
PDCLB pairs were always thawed simultaneously and
grown under the same culture conditions.
Generation of sub-cloned cybrid lines based on CLB expression
Glass-bottomed 6-well plates (MatTek Corp.) were treated with 200μg/ml poly-l-lysine/H2O (m.w. 30,000-70,000,
Sigma-Aldrich) at room temperature for ~40 min. Wells were rinsed twice with sterile water and plates were stored dry until they were loaded with cell suspension (typically 20,000 cells). Selected cybrid lines were harvested from T75 CellStar flasks (Greiner bio-one) with 0.05% trypsin diluted in phosphate buffered saline. GM was used to quench trypsin activity prior to re-plating of cells into glass-bottomed 6-well plates. Cells were incubated at 37°C with 5% CO2for 24-48 hours until cells divided into 2-4
cell clusters. Following an overnight (~18-24 hours) treat-ment with 100μM Congo red (Sigma-Aldrich) made up in GM, dishes were rinsed twice with GM without phenol red (clearGM) and further stained with 80nM Mitofluor Green (Invitrogen) in clearGM for 20 minutes at 37°C. Wells were again rinsed with clearGM and labeled cells were visualized with epi-fluorescence (Olympus IX-70 microscope) using fluorescein isothiocyanate (FITC) filters (Mitofluor Green) and Texas Red filters (Congo red). Clusters of cells with large (3-5μM) Congo red stained spheres were marked with an inked objective marker (Olympus) on the underside of the coverslip well. After re-moving GM from the wells, 6mM sterile glass cloning rings were seated around the marked cell clusters using sterile silicone grease (both from Thermo Fisher). Each cell cluster was trypsinized (see above) and re-plated into one well of a 24-well plate. The expression of Congo red positive CLB was later reassessed and the wells with the largest and most numerous Congo red stained spheres were retained and combined (2-5 clones per well). The other clones were discarded. Combined clones were cul-tured in GM and passed into larger wells as they became confluent. Sub-cloned cybrid lines were expanded into T25 flasks (Greiner bio-one). Each cybrid line was har-vested and plated into coverslip-bottom dishes and re-selected for CLB expression using Congo red and Mito-Fluor Green. These colonies were expanded into T75 flasks, at which time aliquots from each line were frozen for subsequent study.
Quantification of Congo red positive fluorescence
Cells were plated in 35mm dishes as described above and grown for 2-4 days until at least 75% confluent. Cells
were stained with Congo red at 100μM for 24 hours.
Dishes were then washed two times with clearGM with 25mM Hepes (Gibco, Life Technologies). Dishes were blinded for image collection and quantification. Images were acquired using an Olympus FV1000 confocal micro-scope (60X objective) at room temperature. Ten represen-tative fields were taken at random per dish and analyzed using MetaMorph image analysis software (Molecular Devices). Studies were repeated with cells from a different passage. Images were set to a common inclusive threshold and pixels over 1μm were measured for total pixel area, pixel intensity and pixel length. Pixel values were normal-ized to number of cells in each image. To calculate CLB frequency, Congo red positive inclusions over 1μm in diameter were counted for each set of ten images per dish. Number of CLB per dish was normalized to number of cells counted per dish. Student’s t-tests were run to com-pare the original and sub-clone pairs (Prism, Graph Pad).
Electron Microscopy
Sub-confluent T75 flasks for each cybrid line were fixed with 2% paraformaldehyde and 2.5% glutaraldehyde in 0.1M phosphate buffered saline, processed for EM, sec-tioned and stained by staff members of the Advanced Microscopy Facility at the University of Virginia, as pre-viously described [27]. Stained sections were imaged on a Jeol JEM-1230 transmission electron microscope at the Virginia Commonwealth University Microscopy Facility.
Nucleoid imaging and quantitation
Live cells were grown in 35mm dishes, stained with Quant-It PicoGreen dsDNA and MitoTracker Red CMXRos (both from Molecular Probes/Life Technologies) and imaged in clearGM as described above. Dishes were blinded prior to imaging. Six images were acquired at ran-dom per dish using an Olympus FV300 confocal micro-scope. Cell count totals were acquired by counting the PicoGreen positive nuclei per frame. Nucleoids were defined as areas of PicoGreen and Mitotracker Red colo-calization. Cells with less than five nucleoids per cell were considered “low/null”. All others were considered “high”. Only cells with both mitochondria and a nucleus in focus were counted. Two-way ANOVA with Bonferroni mul-tiple comparisons were run to compare PDOrigand PDCLB
Cellular Respiration
Oxygen consumption was measured using the Seahorse Extracellular Flux Analyzer (Seahorse XF24, Seahorse Biosciences) according to manufacturer’s instructions. In brief, cells were plated in Seahorse XF24 culture plates and grown for 24 hours to form a confluent monolayer. One hour prior to each experiment, growth media was exchanged for unbuffered DMEM, pH 7.4. The following inhibitors were used to obtain a bioenergetic profile:
oligo-mycin (1μM), FCCP (300nM), rotenone (100nM), and
antimycin A (10μM). For all inhibitors, the pH was ad-justed to 7.4 prior to the experiment. For each Seahorse experiment, three basal measurements of the oxygen con-sumption rate (OCR) were acquired and calculated by the Seahorse XF. Compounds were added in the order men-tioned previously, with two measurements following each inhibitor. At the end of each experiment, OCR values were normalized to protein content (Micro BCA Kit, Pierce). OCR values are reported as means ± SEM, except for uncoupled respiration (FCCP), where the highest value was used. Statistics were calculated using two-way ANOVA with Bonferroni multiple comparisons post-hoc tests in Prism software (GraphPad, Prism).
RT-qPCR
RNA and DNA were extracted from three independent PDOrig and PDCLB cell pellets from sub-confluent T175
flasks using the All Prep RNA/DNA Kit (Qiagen). RNA and genomic DNA (gDNA) were quantified using the NanoDrop 2000 (ThermoScientific). Complimentary DNA (cDNA) was made from RNA using the iScript cDNA Synthesis Kit (Bio-Rad). Quantitative real-time PCR (RT-qPCR) was run on cDNA and gDNA samples to measure mitochondrial gene and mitochondrial bio-genesis gene expression, as well as mitochondrial gene copy number. Glyceraldehyde 3-phosphate dehydrogen-ase, beta-actin and 18sRNA were used as endogenous reference genes. Primer and probe sequences can be found in the Additional file 7. Starting quantities were calculated by Bio-Rad CFX manager software based on cycle threshold of known standards (human fetal brain cDNA, human gDNA or human mtDNA). Samples and standards were run in quadruplicate. All values were nor-malized to the geometric mean of each sample from the endogenous reference genes. PDOrigand PDCLB data was
expressed as a fold change from the pooled mean of three age-matched disease-free control cell lines (Controls 56, 64 and 68) for each gene (see Keeney et al. [7]). The fold changes for each gene from the mean of each individual PDOrigor PDCLBcell line were then averaged to represent
the fold increase or decrease from control across each gene profile. Mitochondrial cDNA gene expression and gDNA copy number profiles were made up of ND2, CO3, ND4 and 12srRNA. The mitochondrial biogenesis gene
expression profile was made up of PGC-1α, TFAM, NRF1 and TFB1M. Statistical analysis was done using Prism software (GraphPad) using student t-test. In the cases of unequal variances, Welch’s correction was performed.
Axonal transport of mitochondria in the processes of differentiated PDOrigand PDCLBcybrid neurons
Proliferating PDOrigand PDCLBcells were harvested from
T75 flasks with 0.05% trypsin (Invitrogen, Life techno-logies) as previously described [44]. 40,000 cells in 2ml GM were added to each #0 glass bottomed 35mm dishes (MatTek Corp). After 18-24 hours, GM was removed and the differentiation media (DM) consisting of 500ml of Neurobasal with 10ml B27 supplements (Invitrogen, Life Technologies) plus glutamine (0.5mM), pyruvate, uridine and antibiotic-antimycotic, as previously described [45]. Staurosporine (4nM-8nM) dilutions were made fresh in DM and replaced every 2-3 days. Differentiation was com-pleted on day 12 [45].
To measure mitochondrial movement, PDOrig and
PDCLB cybrid neuronal cells were incubated with 50nM
MitoTracker CMXRos (MTRed; Invitrogen, Life Tech-nologies) for 10 min at 37°C. Time-lapse recordings were made using an Olympus IX70 microscope equipped with epifluorescence and Nomarski optics, a Lambda 10-2 filter wheel, a Photometrics CoolSnap HQ progressive scan CCD camera and a heater/controller to maintain cybrid cells at 37°C during image collection (World Precision Instruments, Inc). Image stacks and velocity measure-ments were collected using MetaMorph Imaging System (Molecular Devices). For standard recordings, images were collected every 3 seconds for 2 min. Mitochondrial
move-ment was measured in PD61Orig (n=4 cultures, 73
pro-cesses), PD61CLB (n=4 cultures, 94 processes), PD67Orig
(n=4 cultures, 98 processes), PD67CLB (n=5 cultures, 108
processes), PD63Orig (n=8 cultures, 167 processes) and
PD63CLB(n=4 cultures, 80 processes). Unlike other
stud-ies, the velocity of all mitochondria in each cell process was tracked individually whether they moved or not. The average velocity for individual mitochondria was calcu-lated using intervals where movement occurred. Neutral density filters are used to reduce illumination from the mercury lamp and minimize phototoxicity.
Additional files
Additional file 1:Patient disease characteristics.Demographics and disease characteristics for PD patients and controls used in this study
Additional file 3:CLB stained with antibodies forαlpha-synuclein and poly-ubiquitin.In short, cells were plated in dishes and grown for 48-72 hours before being fixed and permeabilized using citrate antigen retrieval buffer. Dishes were blocked with 1%BSA/1%Triton blocking buffer and incubated in primary antibodies overnight at 4°. Dishes were then stained with fluorophore conjugated secondary antibodies (Life Technologies) and mounted using Vectashield mounting medium with DAPI (Vector Labs). Antibodies used:αlpha-synuclein (1:400, Millipore AB5038); poly-ubiquitin (1:200, Enzo BML-PW8805). Scale bar: 5μm.
Additional file 4:Extracellular CLB.(A-B) Live PD cybrid cells showing extracellular CLB stained with Congo red. (C) Fixed PD cybrid cells stained with
αlpha-synuclein (green) and poly-ubiquitin (red) to mark CLB. Nuclei shown are in blue. Scale bar: 10μm (A, B), 5μm (C); arrows: extracellular CLB.
Additional file 5:Neuronal viability after differentiation.To determine neuronal viability for each cell line, 10 images were taken from 2 dishes of each differentiated PD cybrid pair with differentiated SH-SY5Y as a control. (A) Representative images for each cell line. Cells were counted in each image and calculated as cells per square centimeter and then normalized to cells per square millimeter originally plated in each dish. The normalized means from 2 dishes were combined and graphed (B). The mean per dish was substantially lower in PD63CLBthan PD63Orig. Scale bar: 10μm
Additional file 6:Gene expression ofαlpha-synuclein.α lpha-synuclein expression was measured using qRT-PCR. There was no difference in expression between PDOrigand PDCLBlines for any of the three pairs (Student’st-test, n=3, p<0.05).
Additional file 7:Primer and probe sequences for qRT-PCR.Primers and probes (Operon) were designed using Beacon Designer (Premier Biosoft).
Abbreviations
alpha-synuclein:α-synuclein; cDNA: Complimentary DNA; CLB: Cybrid lewy body, Cybrid lewy bodies; CNTL: Control; DM: Differentiation media; DMEM: Dulbecco’s modified eagle medium; DNA: Deoxyribonucleic acid; ECAR: Extracellular acidification rates; EM: Electron microscopy; ETC: Electron transport chain; FCCP: Carbonyl cyanide 4-(trifluoromethoxy)
phenylhydrazone; gDNA: Genomic DNA; GM: Growth media; LB: Lewy body, Lewy bodies; LCM: Laser capture microscopy; mtDNA: Mitochondrial DNA; NRF1: Nuclear respiratory factor 1; OCR: Oxygen consumption rates; PD: Parkinson’s disease; PGC-1α: Peroxisome proliferator-activated receptor gamma coactivator 1-alpha; RNA: Ribonucleic acid; RT-qPCR: Quantitative real-time polymerase chain reaction; TFAM: Mitochondrial transcription factor A; TFB1M: Mitochondrial transcription factor B1.
Competing interests
All authors declared that they have no competing interest.
Authors’contributions
ENC-F carried out experiments, performed statistical analysis and assisted in writing of the manuscript. MKB developed and carried out the cloning protocol and differentiated cells for axonal transport experiments. JPB designed primers and probes for RT-qPCR experiments and assisted in design and interpretation of the RT-qPCR experiments. KEB provided and maintained stocks of cybrid cell lines and carried out cell viability experiments. PAT carried out experiments, supervised and conceived of the presented research. All authors read and approved the final manuscript.
Acknowledgments
This research was supported by a Morris K. Udall Parkinson’s Research Center of Excellence grant (7P50 NS039788-11) from the NIH and the Medical College of Virginia Foundation. EM samples were processed and embedded with the help of Jan Redick and Dr. Stacey Guillot at the University of Virginia Advanced Microscopy Facility. Microscopy (sections and imaging with the help of Judy Williamson) was performed at the VCU Department of Anatomy and Neurobiology Microscopy Facility, supported in part, with funding from NIH-NINDS Center core grant (5P30NS047463).
Author details
1
Neuroscience Graduate Program, University of Virginia, Charlottesville, VA 22908, USA.2Parkinson’s and Movement Disorders Center, Virginia
Commonwealth University, Richmond, VA 23298, USA.3Department of
Neurology, University of Virginia, Charlottesville, VA 22908, USA.4Department of Neurology, Virginia Commonwealth University, Richmond, VA 23298, USA.
5
Department of Anatomy and Neurobiology, Virginia Commonwealth University, Richmond, VA 23298, USA.
Received: 31 August 2012 Accepted: 21 January 2013 Published: 26 January 2013
References
1. Braak H, Del TK, Bratzke H, Hamm-Clement J, Sandmann-Keil D, Rub U:
Staging of the intracerebral inclusion body pathology associated with idiopathic Parkinson’s disease (preclinical and clinical stages).J Neurol2002,
249(3):III/1–III/5.
2. Burbulla LF, Schelling C, Kato H, Rapaport D, Woitalla D, Schiesling C, Schulte C, Sharma M, Illig T, Bauer P,et al:Dissecting the role of the mitochondrial chaperone mortalin in Parkinson’s disease: functional impact of disease-related variants on mitochondrial homeostasis.
Hum Mol Genet2010,19:4437–4452.
3. Trimmer PA, Bennett JP Jr:The cybrid model of sporadic Parkinson’s disease.Exp Neurol2009,218:320–325.
4. Esteves AR, Domingues AF, Ferreira IL, Januario C, Swerdlow RH, Oliveira CR, Cardoso SM:Mitochondrial function in Parkinson’s disease cybrids containing an nt2 neuron-like nuclear background.Mitochondrion2008,
8:219–228.
5. Exner N, Lutz AK, Haass C, Winklhofer KF:Mitochondrial dysfunction in Parkinson’s disease: molecular mechanisms and pathophysiological consequences.EMBO J2012,31:3038–3062.
6. Esteves AR, Lu J, Rodova M, Onyango I, Lezi E, Dubinsky R, Lyons KE, Pahwa R, Burns JM, Cardoso SM, Swerdlow RH:Mitochondrial respiration and respiration-associated proteins in cell lines created through Parkinson’s subject mitochondrial transfer.J Neurochem2010,113:674–682. 7. Keeney PM, Dunham LD, Quigley CK, Morton SL, Bergquist KE, Bennett JP Jr:
Cybrid models of Parkinson’s disease show variable mitochondrial biogenesis and genotype-respiration relationships.Exp Neurol2009,
220:374–382.
8. Trimmer PA, Borland MK, Keeney PM, Bennett JP Jr, Parker WD Jr:
Parkinson’s disease transgenic mitochondrial cybrids generate Lewy inclusion bodies.J Neurochem2004,88:800–812.
9. Leverenz JB, Umar I, Wang Q, Montine TJ, McMillan PJ, Tsuang DW, Jin J, Pan C, Shin J, Zhu D, Zhang J:Proteomic identification of novel proteins in cortical lewy bodies.Brain Pathol2007,17:139–145.
10. Xia Q, Liao L, Cheng D, Duong DM, Gearing M, Lah JJ, Levey AI, Peng J:
Proteomic identification of novel proteins associated with Lewy bodies.
Front Biosci2008,13:3850–3856.
11. Wakabayashi K, Tanji K, Mori F, Takahashi H:The Lewy body in Parkinson’s disease: molecules implicated in the formation and degradation of alpha-synuclein aggregates.Neuropathology2007,27:494–506. 12. Galvin JE, Lee VM, Schmidt ML, Tu PH, Iwatsubo T, Trojanowski JQ:
Pathobiology of the Lewy body.Adv Neurol1999,80:313–324. 13. Shults CW:Lewy bodies.Proc Natl Acad Sci USA2006,103:1661–1668. 14. Lu L, Neff F, Alvarez-Fischer D, Henze C, Xie Y, Oertel WH, Schlegel J,
Hartmann A:Gene expression profiling of Lewy body-bearing neurons in Parkinson’s disease.Exp Neurol2005,195:27–39.
15. Conway KA, Harper JD, Lansbury PT Jr:Fibrils formed in vitro from alpha-synuclein and two mutant forms linked to Parkinson’s disease are typical amyloid.Biochemistry2000,39:2552–2563.
16. Sanchez I, Mahlke C, Yuan J:Pivotal role of oligomerization in expanded polyglutamine neurodegenerative disorders.Nature2003,421:373–379. 17. Bertrand SJ, Aksenova MV, Aksenov MY, Mactutus CF, Booze RM:
Endogenous amyloidogenesis in long-term rat hippocampal cell cultures.BMC Neurosci2011,12:38.
18. Dickson DW:Parkinson’s disease and parkinsonism: neuropathology.Cold Spring Harb Perspect Med2012,2:a009258.
19. Olanow CW, Perl DP, DeMartino GN, McNaught KS:Lewy-body formation is an aggresome-related process: a hypothesis.Lancet Neurol2004,3:496–503. 20. Lees AJ, Hardy J, Revesz T:Parkinson’s disease.Lancet2009,373:2055–2066. 21. Greffard S, Verny M, Bonnet AM, Seilhean D, Hauw JJ, Duyckaerts C:
A stable proportion of Lewy body bearing neurons in the substantia nigra suggests a model in which the Lewy body causes neuronal death.
22. Rujano MA, Bosveld F, Salomons FA, Dijk F, van Waarde MA, van der Want JJ, de Vos RA, Brunt ER, Sibon OC, Kampinga HH:Polarised asymmetric inheritance of accumulated protein damage in higher eukaryotes.PLoS Biol 2006,4:e417.
23. Fuentealba LC, Eivers E, Geissert D, Taelman V, De Robertis EM:Asymmetric mitosis: Unequal segregation of proteins destined for degradation.
Proc Natl Acad Sci USA2008,105:7732–7737.
24. Alafuzoff I, Ince PG, Arzberger T, Al-Sarraj S, Bell J, Bodi I, Bogdanovic N, Bugiani O, Ferrer I, Gelpi E,et al:Staging/typing of Lewy body related alpha-synuclein pathology: a study of the BrainNet Europe Consortium.
Acta Neuropathol2009,117:635–652.
25. Doehner J, Genoud C, Imhof C, Krstic D, Knuesel I:Extrusion of misfolded and aggregated proteins - a protective strategy of aging neurons?Eur J Neurosci2012,35:1938–1950.
26. Campello S, Scorrano L:Mitochondrial shape changes: orchestrating cell pathophysiology.EMBO Rep2010,11:678–684.
27. Trimmer PA, Swerdlow RH, Parks JK, Keeney P, Bennett JP Jr, Miller SW, Davis RE, Parker WD Jr:Abnormal mitochondrial morphology in sporadic Parkinson’s and Alzheimer’s disease cybrid cell lines.Exp Neurol2000,
162:37–50.
28. Knott AB, Perkins G, Schwarzenbacher R, Bossy-Wetzel E:Mitochondrial fragmentation in neurodegeneration.Nat Rev Neurosci2008,9:505–518. 29. Gomes LC, Di Benedetto G, Scorrano L:During autophagy mitochondria elongate, are spared from degradation and sustain cell viability.Nat Cell Biol2011,13:589–598.
30. Twig G, Hyde B, Shirihai OS:Mitochondrial fusion, fission and autophagy as a quality control axis: the bioenergetic view.Biochim Biophys Acta 2008,1777:1092–1097.
31. Palmer CS, Osellame LD, Stojanovski D, Ryan MT:The regulation of mitochondrial morphology: intricate mechanisms and dynamic machinery.Cell Signal2011,23:1534–1545.
32. Zick M, Rabl R, Reichert AS:Cristae formation-linking ultrastructure and function of mitochondria.Biochim Biophys Acta2009,1793:5–19. 33. Alberts B:Molecular biology of the cell. New York: Garland Pub; 1983. 34. Safiulina D, Veksler V, Zharkovsky A, Kaasik A:Loss of mitochondrial membrane potential is associated with increase in mitochondrial volume: physiological role in neurones.J Cell Physiol2006,206:347–353. 35. Ferrick DA, Neilson A, Beeson C:Advances in measuring cellular
bioenergetics using extracellular flux.Drug Discov Today2008,13:268–274. 36. Dranka BP, Benavides GA, Diers AR, Giordano S, Zelickson BR, Reily C, Zou L,
Chatham JC, Hill BG, Zhang J,et al:Assessing bioenergetic function in response to oxidative stress by metabolic profiling.Free Radic Biol Med 2011,51:1621–1635.
37. Brand MD, Nicholls DG:Assessing mitochondrial dysfunction in cells.
Biochem J2011,435:297–312.
38. Dranka BP, Zielonka J, Kanthasamy AG, Kalyanaraman B:Alterations in bioenergetic function induced by Parkinson’s disease mimetic compounds: lack of correlation with superoxide generation.J Neurochem 2012,122:941–951.
39. Chu Y, Morfini GA, Langhamer LB, He Y, Brady ST, Kordower JH:Alterations in axonal transport motor proteins in sporadic and experimental Parkinson’s disease.Brain2012,135:2058–2073.
40. Sekine S, Miura M, Chihara T:Organelles in developing neurons: essential regulators of neuronal morphogenesis and function.Int J Dev Biol2009,
53:19–27.
41. Cai Q, Davis ML, Sheng ZH:Regulation of axonal mitochondrial transport and its impact on synaptic transmission.Neurosci Res2011,70:9–15. 42. Kanazawa T, Uchihara T, Takahashi A, Nakamura A, Orimo S, Mizusawa H:
Three-layered structure shared between Lewy bodies and lewy neurites-three-dimensional reconstruction of triple-labeled sections.Brain Pathol 2008,18:415–422.
43. Saxton WM, Hollenbeck PJ:The axonal transport of mitochondria.J Cell Sci 2012,125:2095–2104.
44. Trimmer PA, Schwartz KM, Borland MK, De Taboada L, Streeter J, Oron U:
Reduced axonal transport in Parkinson’s disease cybrid neurites is restored by light therapy.Mol Neurodegener2009,4:26.
45. Borland MK, Trimmer PA, Rubinstein JD, Keeney PM, Mohanakumar K, Liu L, Bennett JP Jr:Chronic, low-dose rotenone reproduces Lewy neurites found in early stages of Parkinson’s disease, reduces mitochondrial movement and slowly kills differentiated SH-SY5Y neural cells.Mol Neurodegener2008,3:21.
46. Ashley N, Harris D, Poulton J:Detection of mitochondrial DNA depletion in living human cells using PicoGreen staining.Exp Cell Res2005,
303:432–446.
47. Bogenhagen DF, Rousseau D, Burke S:The layered structure of human mitochondrial DNA nucleoids.J Biol Chem2008,283:3665–3675. 48. He J, Cooper HM, Reyes A, Di Re M, Sembongi H, Litwin TR, Gao J, Neuman
KC, Fearnley IM, Spinazzola A,et al:Mitochondrial nucleoid interacting proteins support mitochondrial protein synthesis.Nucleic Acids Res2012,
40:6109–6121.
49. Keeney PM, Xie J, Capaldi RA, Bennett JP Jr:Parkinson’s disease brain mitochondrial complex I has oxidatively damaged subunits and is functionally impaired and misassembled.J Neurosci2006,26:5256–5264. 50. Borland MK, Mohanakumar KP, Rubinstein JD, Keeney PM, Xie J, Capaldi R, Dunham LD, Trimmer PA, Bennett JP Jr:Relationships among molecular genetic and respiratory properties of Parkinson’s disease cybrid cells show similarities to Parkinson’s brain tissues.Biochim Biophys Acta2008,
1792:68–74.
51. Moran M, Moreno-Lastres D, Marin-Buera L, Arenas J, Martin MA, Ugalde C:
Mitochondrial respiratory chain dysfunction: Implications in neurodegeneration.Free Radic Biol Med2012,53:595–609. 52. Bereiter-Hahn JaB M:Distribution and dynamics of mitochondrial
nucleoids in animal cells in culture.Exp Biol Online1997,1:1–17. 53. Wareski P, Vaarmann A, Choubey V, Safiulina D, Liiv J, Kuum M, Kaasik A:
PGC-1{alpha} and PGC-1{beta} regulate mitochondrial density in neurons.J Biol Chem2009,284:21379–21385.
54. Zheng B, Liao Z, Locascio JJ, Lesniak KA, Roderick SS, Watt ML, Eklund AC, Zhang-James Y, Kim PD, Hauser MA,et al:PGC-1alpha, a potential therapeutic target for early intervention in Parkinson’s disease.Sci Transl Med2010,2:52–73.
55. Hock MB, Kralli A:Transcriptional control of mitochondrial biogenesis and function.Annu Rev Physiol2009,71:177–203.
56. Mudo G, Makela J, Di Liberto V, Tselykh TV, Olivieri M, Piepponen P, Eriksson O, Malkia A, Bonomo A, Kairisalo M,et al:Transgenic expression and activation of PGC-1alpha protect dopaminergic neurons in the MPTP mouse model of Parkinson’s disease.Cell Mol Life Sci: CMLS2012,69:1153–1165.
57. Srivastava S, Diaz F, Iommarini L, Aure K, Lombes A, Moraes CT: PGC-1alpha/beta induced expression partially compensates for respiratory chain defects in cells from patients with mitochondrial disorders.Hum Mol Genet2009,18:1805–1812.
58. Bastin J, Aubey F, Rotig A, Munnich A, Djouadi F:Activation of peroxisome proliferator-activated receptor pathway stimulates the mitochondrial respiratory chain and can correct deficiencies in patients’cells lacking its components.J Clin Endocrinol Metab2008,93:1433–1441.
59. Wenz T, Diaz F, Spiegelman BM, Moraes CT:Activation of the PPAR/PGC-1alpha pathway prevents a bioenergetic deficit and effectively improves a mitochondrial myopathy phenotype.Cell Metab2008,8:249–256. 60. Scarpulla RC:Nuclear control of respiratory chain expression by nuclear
respiratory factors and PGC-1-related coactivator.Ann N Y Acad Sci2008,
1147:321–334.
61. Gaspari M, Larsson NG, Gustafsson CM:The transcription machinery in mammalian mitochondria.Biochim Biophys Acta2004,1659:148–152. 62. Diaz F, Moraes CT:Mitochondrial biogenesis and turnover.Cell Calcium
2008,44:24–35.
63. Wenz T:Mitochondria and PGC-1alpha in Aging and Age-Associated Diseases.J Aging Res2011,2011:810619.
64. Jellinger KA:Formation and development of Lewy pathology: a critical update.J Neurol2009,256(Suppl 3):270–279.
65. Harding AJ, Broe GA, Halliday GM:Visual hallucinations in Lewy body disease relate to Lewy bodies in the temporal lobe.Brain2002,125:391– 403.
66. Harding AJ, Stimson E, Henderson JM, Halliday GM:Clinical correlates of selective pathology in the amygdala of patients with Parkinson’s disease.
Brain2002,125:2431–2445.
67. Harrower TP, Michell AW, Barker RA:Lewy bodies in Parkinson’s disease: protectors or perpetrators?Exp Neurol2005,195:1–6.
68. Harrower T, Barker RA:Cell therapies for neurological disease–from bench to clinic to bench.Expert Opin Biol Ther2005,5:289–291.
70. Hindle JV:Ageing, neurodegeneration and Parkinson’s disease.Age Ageing2010,39:156–161.
71. Au WL, Calne DB:A reassessment of the Lewy body.Acta Neurol Taiwan 2005,14:40–47.
72. Kramer ML, Schulz-Schaeffer WJ:Presynaptic alpha-synuclein aggregates, not Lewy bodies, cause neurodegeneration in dementia with Lewy bodies.J Neurosci: Offic J Soc Neurosci2007,27:1405–1410. 73. Zhou J, Broe M, Huang Y, Anderson JP, Gai WP, Milward EA, Porritt M,
Howells D, Hughes AJ, Wang X, Halliday GM:Changes in the solubility and phosphorylation of alpha-synuclein over the course of Parkinson’s disease.Acta Neuropathol2011,121:695–704.
74. Lin CJ, Lee CC, Shih YL, Lin CH, Wang SH, Chen TH, Shih CM:Inhibition of mitochondria- and endoplasmic reticulum stress-mediated autophagy augments temozolomide-induced apoptosis in glioma cells.PLoS One 2012,7:e38706.
75. Devine MJ, Gwinn K, Singleton A, Hardy J:Parkinson’s disease and alpha-synuclein expression.Mov Disord2011,26:2160–2168.
76. Ferrer I:Neuropathology and neurochemistry of nonmotor symptoms in Parkinson’s disease.Parkinsons Dis2011,2011:708404.
77. Siddiqui A, Chinta SJ, Mallajosyula JK, Rajagopolan S, Hanson I, Rane A, Melov S, Andersen JK:Selective binding of nuclear alpha-synuclein to the PGC1alpha promoter under conditions of oxidative stress may contribute to losses in mitochondrial function: Implications for Parkinson’s disease.Free Radic Biol Med2012,53:993–1003.
78. Swerdlow RH, Parks JK, Miller SW, Tuttle JB, Trimmer PA, Sheehan JP, Bennett JP Jr, Davis RE, Parker WD Jr:Origin and functional consequences of the complex I defect in Parkinson’s disease.Ann Neurol1996,40:663–671. 79. Miller SW, Trimmer PA, Parker WD Jr, Davis RE:Creation and
characterization of mitochondrial DNA-depleted cell lines with "neuronal-like" properties.J Neurochem1996,67:1897–1907.
doi:10.1186/1750-1326-8-6
Cite this article as:Cronin-Furmanet al.:Mitochondrial quality, dynamics and functional capacity in Parkinson’s disease cybrid cell lines selected for Lewy body expression.Molecular Neurodegeneration20138:6.
Submit your next manuscript to BioMed Central and take full advantage of:
• Convenient online submission
• Thorough peer review
• No space constraints or color figure charges
• Immediate publication on acceptance
• Inclusion in PubMed, CAS, Scopus and Google Scholar
• Research which is freely available for redistribution