A NOVEL WEIGHT-IMPROVED
PARTICLE SWARM OPTIMIZATION
FOR COMBINED ECONOMIC AND
EMISSION DISPATCH PROBLEMS
BHUVNESH KHOKHAR
Department of Electrical Engineering, DCRUST, Murthal, Sonipat, Haryana 131039, India
K. P. SINGH PARMAR
Assistant Director (Technical), National Power Training Institute, Faridabad, Sector-33, Haryana 121003, India
Abstract:
This paper presents a weight improved particle swarm optimization (WIPSO) strategy for solving the combined economic and emission dispatch (CEED) problems. From point of view of the safety of the environment, it has become necessary to reduce the emission of harmful pollutants from power plants. This leads to an increased operating cost of the plant. So a compromise has to be made between the emission and the cost. In this paper, the presented WIPSO strategy has been applied to two generating systems, one comprising a three generator system and the other being IEEE 30-bus six generator system and its performance has been compared to the standard particle swarm optimization (PSO) strategy. The results show that the WIPSO strategy provides better solution as compared to the PSO in terms of reduced fuel cost and reduced emission.
Keywords: Economic Dispatch, Emission Dispatch, Particle Swarm Optimization, Weight Improved Particle Swarm Optimization, Combined Economic & Emission Dispatch
1. Introduction
Economic Dispatch (ED) is one of the most fundamental issues in power system operation. The main aim of ED is to minimize the operating cost of units, while satisfying the load demand and certain other constraints [1]. However, due to the increasing level of environmental concerns this single objective may no longer be considered adequate. A large number of fossil-fuelled power plants have been set up for fulfilling the ever increasing load demand which has resulted in the increased emission of pollutants such as sulphur oxides, nitrogen oxides and carbon dioxide. These pollutants cause harmful effects on the human beings as well as on the environment. So, during the load allocation process, the cost economy should not be the only objective but the reduction of emissions should also be taken into account [4-6].
Many works are there in literature for solving the economic/emission dispatch problems. Several methods have been developed to reduce the emissions from units. A solution procedure based on the LaGrange multiplier technique for the economic/emission problem has been proposed in [2]. Gent and Lamont [3] introduced the minimum-emission dispatch concept where they developed a program for online steam unit dispatch that resultedin minimizing the emission. They introduced the mathematical representation of emission of steam generating units and used a Newton-Raphson convergence technique to obtain base points and participation factors. Zahavi and Eisenberg [4] proposed a dispatch strategy considering both cost and emissions economy. Srikrishna and Palachinamy [5] proposed a method for Combined Economic and Emission Dispatch (CEED) using price penalty factor. Abido [7-8] developed a multi-objective evolutionary algorithm that determined the pareto optimal set simultaneously using the strength pareto evolutionary algorithm.
is applied to the CEED problem. In order to show the effectiveness of the presented method it has been compared with the particle swarm optimization (PSO) [10-11] technique. Feasibility of the proposed WIPSO method has been demonstrated on two systems, one comprising a three generator system and the other one comprising IEEE 30-bus, six generator test system.
2. Problem Description
2.1 Economic Dispatch
The objective of the ED problem is to determine the optimal active power output (MW) of each of the generator for a total load demand of (MW). Total fuel cost ($/hr) for generators is minimized subject to the equality and the inequality constraints. The fuel cost curve is approximated as a quadratic function of the active power output from the generators and is represented as [1]:
(1) Where,
, ,
are the fuel cost coefficients of the generator. The ED problem can be defined by the following equation:minimize =
∑
(2)subject to the constraints given as:
a)
the equality constraint –∑
(3.1)b)
the inequality constraint –(3.2)
Where,
- minimum power output limit of the generator (MW) - maximum power output limit of the generator (MW)
The total transmission losses, (MW) is a function of unit power outputs that can be expressed using B-coefficients as [1]:
∑
∑
∑
(4)2.2 Emission Dispatch
The objective of the emission dispatch is to minimize the harmful pollutants emitted from power plants due to burning of the fossil fuels. Pollutants include sulphur oxides, nitrogen oxides and carbon mono-oxides. In this paper only emissions have been considered. The emission can be approximated as a quadratic function of the active power output from the generators and is represented as:
+ exp( ) (5)
For a total emission of (Kg/hr), the emission dispatch problem can be defined as the following optimization problem,
minimize =
∑
(6)subject to the equality constraint (3.1) and the inequality constraint (3.2).
The economic dispatch and the emission dispatch are two different objectives. The former reduces the fuel cost of the generators without considering the emission economy and the latter reduces the emissions without considering the cost economy. Therefore, need is there to strike a proper balance between the two objectives. This can be achieved through the concept of combined economic and emission dispatch (CEED) [5].
The CEED problem can be formulated as [5],
minimize F(
,
) (7)subject to the constraints given by equation (3).
The multi-objective problem defined by equation (7) can be converted into a single objective problem by introducing a price penalty factor [5] as follows,
minimize ψ = + ($/hr) (8)
The above equation blends the emission cost with the fuel cost. The introduction of avoids the use of two classes of dispatching. The value of can be determined by the following procedure given below [5].
1. The fuel cost of each generator is evaluated at its maximum power output,
2. The emission release of each generator is evaluated at its maximum power output,
+ exp( )
3. for each generator is calculated as:
= / i = 1, 2, ……, NG (9)
4. (i = 1, 2, ……, NG)are arranged in ascending order.
5. The maximum capacity of each generator ( ) is added one at a time, starting from the smallest unit until ∑ ≥ .
6. At this stage associated with the last unit in the process is the price penalty factor for the given load demand .
Once the value of is known, the optimal generation schedule can be obtained by minimizing equation (8) subject to the constraints given by the equation (3).
3.Weight Improved Particle Swarm Optimization (WIPSO)
PSO, as an optimization tool, provides a population-based search procedure in which individuals called particles change their position (states) with time [10]. In a PSO system, particles fly around in a multi-dimensional search space. Let p and v denote a particle co-ordinate (position) and its corresponding flight speed (velocity) in a search space respectively. Therefore, each particle is treated as a volume less particle, represented as = ( , ,…, ) in the -dimensional space. The best previous position of the particle
is recorded and represented as = ( , ,…….. ). The index of the best particle among all the particles is treated as
global best particle, is represented as . The velocity for the particle is represented as = ( , , ……..., ). Further information regarding PSO can be obtained from [1] and [11].
The modified velocity and position of each particle can be calculated using the current velocity and the distance from to as shown in the following formulas [1],
= *w + *rand( )*( - ) + *Rand( )*( - ) (10)
= + (11)
w, known as inertia weight factor, often decreases linearly from about 0.9 to 0.4 during a run. In general, w is set according to the following equation,
w = – [( – )* ]/( ) (12)
Here, is the maximum inertia weight, is the minimum inertia weight, is current no. of iterations, is maximum no. of iterations.
In WIPSO, in order to improve the global search capability of standard PSO, inertia weight factor, cognitive and social components have been adjusted.
The velocity-update equation (10) using the modified inertia weight factor i.e. using the WIPSO method can be rewritten as [9]:
= * + *rand( )*( - ) + *Rand( )*( - ) (13)
Where,
= + w *rand1( ) (14)
w is calculated using equation (12).
/
(15)/
(16), – initial and final values of the cognitive component , – initial and final values of the social component rand1( ) – randomly generated number between (0,1)
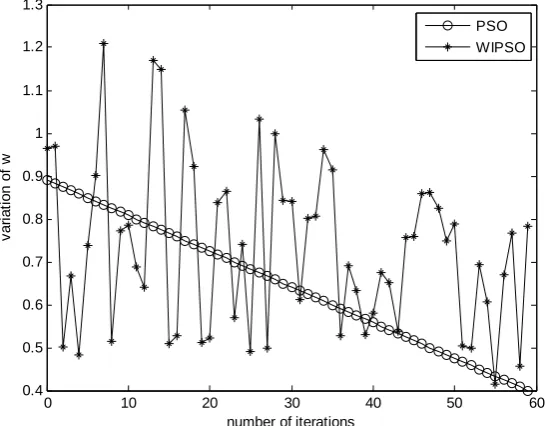
Figure 1 below shows the comparison in variation of inertia weight factor w, as obtained from equations (12) and (14) for 60 iterations.
Fig. 1: Comparison of weights by the two methods
0 10 20 30 40 50 60
0.4 0.5 0.6 0.7 0.8 0.9 1 1.1 1.2 1.3
number of iterations
v
ar
ia
ti
on of
w
4. WIPSO algorithm applied to the CEED problem
The sequential steps of the proposed WIPSO strategy are given below.
Step1: Choose the population size, maximum number of iterations, , , , , , and .
Step2: The particles of the swarm are initialized randomly according to the limit of each generating unit. These initial particles must be feasible candidate solutions that must satisfy the operating constraints.
Step3: Set generation counter t = 1.
Step4: Evaluate the fitness of each particle according to the objective function.
Step5: Particles are accelerated to new positions by adding new velocities to their current positions. The new velocity is calculated using the equation (13)
The positions of the particles are updated using (11).
Step6: If the evaluation value of each particle is better than previous , the current value is set to . If the best is better than , this new value is set as . An objective function value at is set as .
Step7: If the number of iterations reaches the maximum than the process is stopped and is the minimum operation cost of the economic/emission dispatch problem. Otherwise, the above process is repeated from step2.
5. Test Systems and Results
In order to show the effectiveness of the WIPSO strategy over the PSO strategy, two test systems have been taken into consideration. The first system consists of three generating units [12] with a load demand of 850 MW. The second system is the IEEE 30-bus, six generator system with a load demand of 2.834 pu on a 100 MVA base.
Case1: Three Generator System For this system,
PSO parameters are:
Maximum iterations = 200, population size = 10, = 0.9, = 0.4, acceleration constants = 2, = 2
WIPSO parameters are [9]:
Maximum iterations = 200, population size = 10, = 1.2, = 0.3, = 1.5, = 2.2, = 1.5, = 2.2
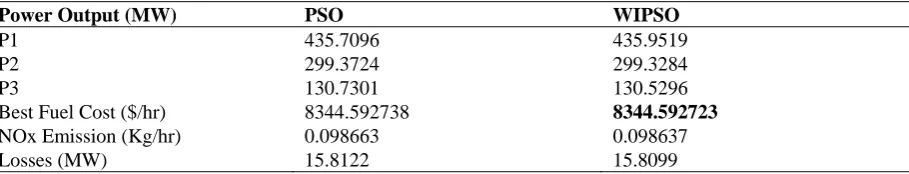
The results for best fuel cost are shown in table 1 and the results for best emission are shown in table 2 ( , are taken zero for this case). Table 3 shows the best compromise solution between the fuel cost and the
emission.
Table 1 - Best fuel cost ( = 850 MW)
Power Output (MW) PSO WIPSO
P1 435.7096 435.9519
P2 299.3724 299.3284
P3 130.7301 130.5296
Best Fuel Cost ($/hr) 8344.592738 8344.592723
NOx Emission (Kg/hr) 0.098663 0.098637
Losses (MW) 15.8122 15.8099
Table 2 - Best emission ( = 850 MW)
Power Output (MW) PSO WIPSO
P1 509.4062 511.4865
P2 249.4290 246.6277
P3 105.8945 106.5713
Fuel Cost ($/hr) 8365.5721 8366.7676
Best NOx Emission (Kg/hr) 0.09592393825 0.09592393197
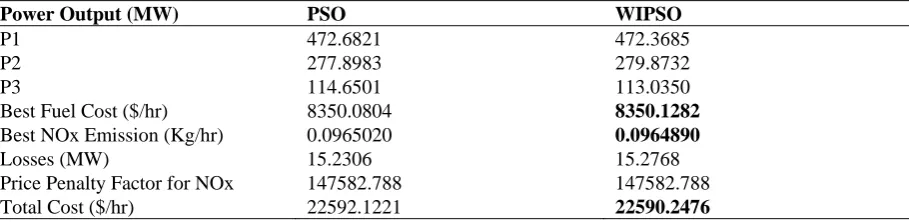
Table 3 - Best compromise solution ( = 850 MW)
Power Output (MW) PSO WIPSO
P1 472.6821 472.3685
P2 277.8983 279.8732
P3 114.6501 113.0350
Best Fuel Cost ($/hr) 8350.0804 8350.1282
Best NOx Emission (Kg/hr) 0.0965020 0.0964890
Losses (MW) 15.2306 15.2768
Price Penalty Factor for NOx 147582.788 147582.788
Total Cost ($/hr) 22592.1221 22590.2476
Case2: Six Generator System For this system,
PSO parameters are:
Maximum iterations = 200, population size = 25, = 0.9, = 0.4, acceleration constants = 2, = 2
WIPSO parameters are [9]:
Maximum iterations = 200, population size = 25, = 1.2, = 0.3, = 1.5, = 2.2, = 1.5, = 2.2
The results for best fuel cost are shown in table 4 and the results for best emission are shown in table 5. Table 6 shows the best compromise solution between the fuel cost and the emission.
Table 4 - Best fuel cost ( = 2.834 pu)
Power Output (pu) PSO WIPSO
P1 0.1175 0.1164
P2 0.3159 0.3180
P3 0.6253 0.6262
P4 0.9559 0.9633
P5 0.4976 0.4763
P6 0.3582 0.3704
Best Cost (pu) 608.9691 608.9513
NOx Emission (pu) 0.2028 0.2029
Losses (pu) 0.0367 0.0369
Table 5 - Best emission ( = 2.834 pu)
Power Output (pu) PSO WIPSO
P1 0.1453 0.4051
P2 0.5924 0.4586
P3 0.8283 0.5081
P4 0.3098 0.5196
P5 0.5713 0.4672
P6 0.4119 0.5097
Best NOx Emission (pu) 0.1868 0.1862
Fuel Cost (pu) 650.1467 636.7158
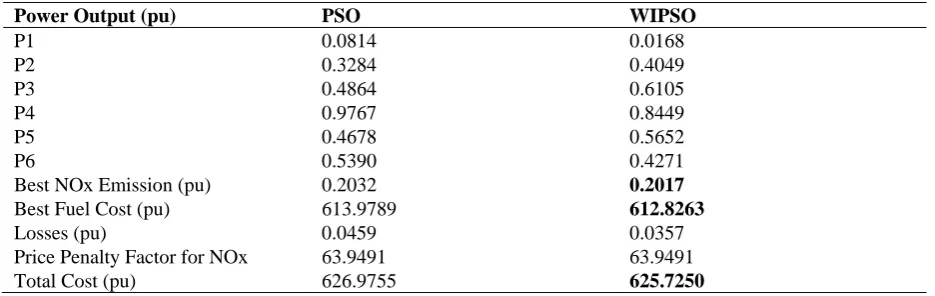
Table 6 - Best compromise solution ( = 2.834 pu)
Power Output (pu) PSO WIPSO
P1 0.0814 0.0168
P2 0.3284 0.4049
P3 0.4864 0.6105
P4 0.9767 0.8449
P5 0.4678 0.5652
P6 0.5390 0.4271
Best NOx Emission (pu) 0.2032 0.2017
Best Fuel Cost (pu) 613.9789 612.8263
Losses (pu) 0.0459 0.0357
Price Penalty Factor for NOx 63.9491 63.9491
Total Cost (pu) 626.9755 625.7250
6. Conclusion
The presented weight improved PSO algorithm has been applied to the CEED problem in this paper. The performance of the WIPSO strategy has been compared to the standard PSO strategy using two different generating systems, one consisting of a three generator system and the other comprising a six generator system. The results obtained show that the proposed WIPSO strategy outperforms the standard PSO strategy in terms of solution quality and avoids premature convergence thereby enhancing the global search capability.
References
[1] Kothari D. P., and J. S. Dhillon (2010), ‘Power System Optimization’, 2nd edition, PHI, New Delhi
[2] Lemont J. W., and E. V. Obessis (1995), ‘Emission dispatch models and algorithms for the 1990s’, IEEE Trans. on Power Systems, vol. 10 (2), pp. 941-947
[3] Gent M. R., and J. W. Lemont (1971), ‘Minimum emission dispatch’, IEEE Trans. on Power Apparatus and Systems, vol. PAS 90, pp. 2650-2660
[4] Zahavi J., and L. Eisenberg (1975), ‘Economic-environmental power dispatch’, IEEE Trans. on Systems, Man and Cybernetics, vol. SMC-5 (5), pp. 485-489
[5] Srikrishna K., and C. Palanichamy (1991), ‘Economic thermal power dispatch with emission constraint’, Journal of the Indian Institute of Engineers (India), vol. 72, pp. 11-18
[6] Kothari, D. P. and K. P. Singh Parmar (2006), ‘A novel approach for eco-friendly and economic power dispatch using MATLAB’, International Conference on Power Electronics, Drives and Energy Systems, PEDES ’06, pp. 1-6
[7] Abido M. (2001), ‘A new multi-objective evolutionary algorithm for environmental/economic power dispatch’, IEEE Power
Engineering Society Summer Meeting, Vancouver, Canada, pp. 1263-1268
[8] Abido M. (2003), ‘Environmental/economic power dispatch using multi-objective evolutionary algorithms, IEEE Trans. on Power Systems, vol. 18 (4), pp. 1529-1537
[9] Vu PhanTu, DinhLuong Le, NgocDieu Vo and Josef Tlusty (2010), ‘A novel weight-improved particle swarm optimization algorithm for optimal power flow and economic load dispatch problems’, 2010 IEEE PES Transmission and Distribution Conference and Exposition, pp. 1-7
[10] Kennedy J. and R. C. Eberhart (1995), ‘Particle swarm optimization’, Proceedings of the1995 IEEE International Conference on Neural Networks, vol. 4, pp. 1942-1948
[11] Gaing, Z. L. (2003), ‘Particle swarm optimization to solve the economic dispatch considering the generator constraints’, IEEE Trans. on Power Systems, vol. 18 (3), pp. 1187-1195
[12] T. F. Ah King Robert and Harry C. S. Rughupooth (2003), ‘Elitist multiobjective evolutionary algorithm for environmental/economic dispatch’, The 2003 Congress on Evolutionary Computation, vol. 2, pp. 1108-1114