Abstract—Road traffic accidents are a major cause of death worldwide. In an attempt to reduce accidents, some research efforts have focused on creating Advanced Driver Assistance Systems (ADAS) able to detect vehicle, driver and environmental conditions and to use this information to identify cues for potential accidents. This paper presents continued work on a novel Non-intrusive Intelligent Driver Assistance and Safety System (Ni-DASS) for assessing driver point of regard within vehicles. It uses an on-board
CCD camera to observe the driver’s face. A template matching
approach is used to compare the driver’s eye-gaze pattern with a set of eye-gesture templates of the driver looking at different focal points within the vehicle. The windscreen is divided into cells and
comparison of the driver’s eye-gaze pattern with templates of a
driver’s eyes looking at each cell is usedto determine the driver’s point of regard on the windscreen. Results indicate that the proposed technique could be useful in situations where low resolution estimates of driver point of regard are adequate. For instance, To allow ADAS systems to alert the driver if he/she has positively failed to observe a hazard.
Keywords—Head rotation, Eye-gestures,Windscreen, Template matching.
I. INTRODUCTION
OAD traffic accidents represent a major cause of fatalities worldwide. A report commissioned by the World Health Organisation [1], states that road accidents cause one million deaths each year and fifty million serious injuries. Road accidents represent the main cause of death for males under the age of 25 within the Organization for Economic Co-operation and Development (OECD) countries [2]. The United Kingdom’s Department for Transport published a report
entitled ‘Reported Road Casualties Great Britain: 2008’[3] which looked at accident causation factors. The findings were that speed was a major contributory factor in road traffic accidents with 14% of accidents linked to exceeding the speed limit or driving too fast for the road conditions. The report also states that this rate rises to 24% when considering only fatal accidents. In the USA, the Department of Transportation published a report,[4], which investigates pre-crash causation factors for light passenger vehicles that took place between2005 to 2007. The report studied 6,950 crashes and states that 22% of the vehicles ran off the edge of the road and 11% of the vehicles failed to maintain proper lane keeping.Recent research investigating the factors contributing to road accidents have suggested that momentary lack of attention featured in as much as 78% of road accidents [5].
Siti Nor HafizahbtMohdZaidis with the Computing, Engineering and Technology Faculty, Staffordshire University, Beaconside, ST18 0AB, United Kingdom (phone: +447-545322452; e-mail: [email protected]).
Mohamed Abdel-Maguid,is with the Computing, Engineering and Technology Faculty,Staffordshire University(e-mail: [email protected]).
Abdel-Hamid Soliman is with the Computing, Engineering and Technology Faculty, Staffordshire University, Beaconside, ST 18 0AB UK, (e-email [email protected]).
Other researchers have claimed that poor attention is the main cause of accidents because factors such as fatigue, alcohol or drug use, distraction and speeding all impair the
driver’s capacity to pay attention to the vehicle and road
conditions (Fletcher and Zelinsky, 2009).
These factors have motivated research efforts that aim to improve driver performance and thus help to reduce accidents. This research has led to the development of Advanced Driver Assistance Systems (ADAS). ADAS systems are on-board computer systems that attempt to reduce the risk of accidents by monitoring the driver, vehicle and environmental conditions and taking some action when a risk is identified. However, there is comparatively little published work that tackles the problem of driver attention with much of the work focusing upon detecting and responding tovehicle and environmental state. Some recent work has attempted to create
ADAS systems able to determine the driver’s level of attention [6]. In order to have reliable and accurate assessment of the
driver’s condition and his/her fitness to drive, a number of
factors need to be considered such as vehicle behaviour
(speed, lane changes, manoeuvresetc), driver’s eye gaze (to determine the driver’s focus of attention), other road users and
road conditions.In the proposed Non-intrusive Intelligent Driver Assistance and Safety System (Ni-DASS), a video of
the driver’s eyes is processed to determine the driver’s point
of regard on the windscreen. The overall aim of this process is to determine whether the driver has seen the hazard. Because
of the ‘look but not see’ phenomenon, it is very difficult to determine if the driver has actually observed a hazard. However, it is often possible to determine if the driver has failed to observe the hazard simply because he/she has been looking at something else. The main contribution of this paper is an extension our earlier introductory work on eye-gesture recognition for mirror observations [7] to point of regard determination on windscreens. In this paper, eye-gesture
templates are matched with the driver’s eye to determine the
driver’s point of regard on the windscreen. Results have
shown that it is possible to use gesture recognition techniques to determine point of regard with sufficient accuracy to be used for hazard awareness.
II.PREVIOUSWORK
Advanced Driver Assistance Systems (ADAS) have been designed to assist the driver within a vehicle and to help avoid traffic accidents by improving driving performance. For this reason, it is necessary to understand the main pre-crash causal and contributing factors.
Factors that contribute to traffic accidents include driver behaviour, driving context and vehicle performance. For instance, police crashes reports have shown that the driver following too closely to the vehicle in front is one of the main causes of rear-end collisions. Studies have shown that as much as 78 per cent of fatal accidents are a result of poor driver observational behavior [5].
Advanced Driver Assistance Systems
R
Siti Nor Hafizah bt Mohd Zaid, Mohamed Abdel Maguid, Abdel Hamid Soliman
[6] suggest that sub-optimal driver attention may be the major causation factor in road accidents as other factors such as speeding, fatigue, drink driving etc all impair the driver’s
ability to pay attention to the vehicle and environment. Driver fatigue is also one of the main causation factors in road traffic accidents. In Great Britain, statistics have shown that 20 per cent of serious accidents on motorways are caused by the driver being drowsy and not fit to drive [8]. For this reason, researchers [9] have developed drowsiness detection systems based upon measurement of the percentage of eye closure so as to detect when the driver is fatigued and help avoid road accidents. Other researchers [10,11]have focused on driver distraction as a main contributing factor in many accidents. This research has found that in-car technology is a factor in causing driver distraction. For instance, if the driver is using a telephone or resetting the route within a satellite guidance system. However, there are other factors that contribute to distraction such as eating, conversing with a passenger etc. Driver distraction is claimed to be a contributing factor in over half of non-vigilance crashes. Researchers [10, 6] have use simulators and test track studies in order to assess the importance of driver distraction in road accidents. Changes to the speed of the vehicle are also a crucial factor that causes car accidents. Researchers have found that people who have been distracted may decrease or increase the pressure on the acceleration pedal. A report has shown that speeding is also an important factor in traffic accidents. Around 430 people are killed in crashes in the United Kingdom in which someone exceeds the speed limit or drives too fast for the road conditions [12].
Based upon the factors described above, ADAS systems have been proposed by researchers as an initiative to avoid road accidents and reduce death. The following sections will look at work related to driver state that affects driver performance.
1) Fatigue/Drowsiness
[9] have used visual information to detect driver drowsiness. The visual cues are; yawn frequency, eye-blinking frequency, eye gaze movement, head movement and facial expressions. To localize the face, this system uses the VJ object detector (this is a machine learning approach for object detection). It uses three important aspects to make an efficient object detector based on the integral image, AdaBoost technique and cascade classifier. They then use the face region of interest to minimise the search area when finding the eyes. The technique used to find the eyes is based on anthropometric properties proposed by [13]. Then the exact position of the eye is searched by incorporating information from grey level pixels. After that the mathematical equation is used to generate the random samples of eyes (elliptic model) which indicate the state of the eye (closed or opened). The classification technique (support Vector Machine) has been used to identify whether they eyes being closed or opened.
Then Gabor filter has been used to extract the features to analyse the eyes by changing the orientation and scale. The percentage of eye closure initially used by [4] is used to
determine the drowsiness and the driver’s face orientation was
determined using mathematical formula based on eye position.
Meanwhile [14] has used sensor approach to determine the
driver’s drowsiness. The adaptive cruise control fuse with
driver vigilance and lane departure warning system
information has been employed to indicate the driver’s
drowsiness. ACC systems use either radar (radio detection and ranging) or LIDAR (light detection and ranging), and the latter is the more precise distance-measuring sensor. Both systems are utilised to measure the speed and distance relative to the vehicle in front and automatically applies deceleration when necessary. They used image processing technique to
access the driver’s alertness by measuring driver’s vigilance
using unobtrusive camera to infer the driver is looking ahead and taking an appropriate action if necessary.
2) Driver Attention/ Vigilance
[15] has implemented facial features and eyelid movement detection to identify poor vigilance to assess driver behavior. A statistically anthropometric face model has been used to find the important features on face. Combination of image processing technique has been employed to make it robust. Kalman filter has been used to robustly detect the facial features point over a sequence of human face images taken from different head pose. The author used technique proposed by [16] to automatically select the face skin pixels on the image. The technique called colour skin histogram that used to take sample from different scenarios. They then choose face skin region manually which is performed on a sequence of learning frames to compute a (normalised) skin colour histogram model in RGB-space. After all they find the probability of pixel value in RGB space is drawn from the predefined skin histogram model.
[17] have used driver’s vigilance based technique by
implementing fuzzy logic to infer inattentiveness of the driver.
The information of the driver’s behaviors like duration and percentage of eye closure, blink and nodding frequency, face positions and fixed gaze is obtained from PERCLOS in order to measure the driver drowsiness. The device is being developed by Seeing Machine which has three drowsiness metrics. They are proportion of time the eyes were closed at least 70%; the time the eyes were closed at least 80% and EYEMEAS (EM) where mean square percentage of eye closure rating measured [18]. All the parameters have been
fused using fuzzy classifier to differentiate level of driver’s
inattentiveness plus to increase the performance of detection.
3) Driver Distraction
Driver distraction may occur during driving period due to driver picking up phone, texting or using entertainment facilities such as music players, PDA devices, mobile phones, etc. There are a few approaches that have been employed to indicate the driver distraction. They are based on visual information like eye gaze, lips detection, head position etc.
[10]used to reveal driver’s distraction using rules based on
gaze, head lane tracking data by fusing them together with support vector machine classification technique. The FaceLab of Seeing Machines has been applied to extract the eye features of the driver. FaceLab is a device to calculate head rotation and analyse eye states (e.g. saccades, eye blinking, eye gaze direction etc.). The gaze direction and head position (output mapping) is being used to determine the driver’s
attention especially when the driver is not looking on the road. Beside the output mapping also assist to indicate when the driver is continuously dividing his attention with something else. Lastly the mapping output is used to generate driver’s
intent to change the lane. A kernel function is used for mapping and the Support Vector Machine algorithm to
classify the driver’s behavior due to better adaptation of momentary changes. The result shows the eye gaze and head rotation achieved a good enough performance to be employed in driver distraction system.
III. EYE-GESTUREANALYSIS FORWINDSCREEN OBSERVATIONS
The proposed system is an extension of the Ni-DASS system outlined in our introductory work on eye-gesture analysis for mirror observations [7] to include general eye-gaze determinations within vehicles. As such, there are two primary contributions: the extension of eye-gesture analysis to include general driver point of regard determinations within vehicles and the extension of eye-gesture analysis to include driver head movements. Eye-gesture templates are captured of the driver looking at each point of regard element and are
compared with the driver’s eyes during driving situations in
order to determine if the driver is looking at any of the point of
regard elements. To determine the driver’s point of regard on
the windscreen, the windscreen is divided into a grid of evenly spaced cells and eye-gesture templates are captured of the driver looking at each cell. The number of cells used is important but it has been found empirically that using four rows of six cells per row is an adequate cell resolution for the template matching.
To deal with movements of the head, three situations must be considered:
Rotations of the head
Forward and backward displacements. Horizontal and vertical displacements. Each of these cases will be addressed below.
A. Head Rotation
When making observations, the driver may rotate her head
to look at a focal point in the vehicle. If the driver’s head is
considered to be at the origin of the coordinate axes and aligned so that the x-axis is horizontal with respect to the head, then rotating about the x-axis represents an up and down movement of the head. If the y-axis runs vertically with respect to the head then rotation about the y-axis represents a left and right turning of the head. Lastly, if the z-axis projects out from the head in a forward direction then rotation about the z-axis represents a left, right tilting motion of the head. During routine road observations, rotations about the x-axis and y-axis are more common as these represent natural head rotations that take place during normal observations. Head tilting rotations about the z-axis are less common. For this reason, the following section will deal with x-axis and y-axis rotations. To do this, it is proposed to capture eye-gesture templates of the driver in different head poses and to select the appropriate template set based upon an estimate of the rotation of the head. To do this, a calibration driver rotates her head to face each of the 24 windscreen cells and a full set of
eye-gesture templates are captured for each head pose. For instance, the calibration driver rotates her head to face a windscreen celland eye-gesture templates are captured of the driver looking at all 24 windscreen cells while keeping her head pose fixed. With 24 focal-points, there will be 24 different sets of eye-gesture templates with each set containing 24 templates.
During normal driving situations, the driver’s head rotation
is estimated using the approach presented by [19] based upon estimating the 3D rotation of the head from the relative positions of facial feature points in the 2D video image of the face. The present work tracks the outer corners of the left and right eye and the outer corners of the mouth. The reader is referred to [19] for a full discussion of the approach. Once the head rotation is estimated, it is then possible to determine the eye-gesture template set to use for point of regard determinations. This is done by comparing the calculated head rotation with the rotation used while capturing the templates and selecting the nearest match.
B. Forward and Backward Displacements
Since the driver’s seat can be adjusted, the distance of the
driver from the point of regard elements can vary and this can impact upon the accuracy of the point of regard determinations. Given a particular eye gaze vector, forward or backward movement of the driver will displace the actual point of regard by (Δx, Δy). The value of the Δx andΔy will
depend upon the change in distance Δd of the drivers head
from the point-of-regard element with respect to the calibration distance dand the viewing angle θ. In Figure 1, the
pink head represents the calibration head position with d being the distance of the pink head from the windscreen. The blue head represents a backward displacement of Δd. The horizontal position x represents the distance of the point of regard from the neutral, forward facing eye-gaze position and
Δx represents the change in the point of regard resulting from the backward displacement of the driver’s head. The eye-gaze viewing angle remains the same in both the pink head position and the blue head position.
Fig. 1 2D representation of a backward displacement of the head (blue) from the calibration head position (pink)
From the trigonometric rule for right-angled triangles, we know that
tan(θ)= x/d (1)
tan(θ)=(x+Δx)/(d+Δd) (2)
Combining these two equations gives us x/d=(x+Δx)/(d+Δd)
and rearranging gives us
Δx=xΔd/d
From the calibration of the templates, Therefore, if we can measureΔd, then we c
determine the driver’s actual point windscreen.Δdcan be determined in a n instance, the value of Δd often depen adjustment relative to the calibration sea also be possible to estimate the change i
camera from the change in scale of
However, experimental results in a Fo shown that if the eye-gesture templates mid-point of the seat adjustments and backward displacements are in the orde direction then the maximum point of regar less half the width and height of the winds windscreen is divided into 4 rows of 6 ce for a given eye-gaze pattern, the max backward seat position will not change the driver is focused.
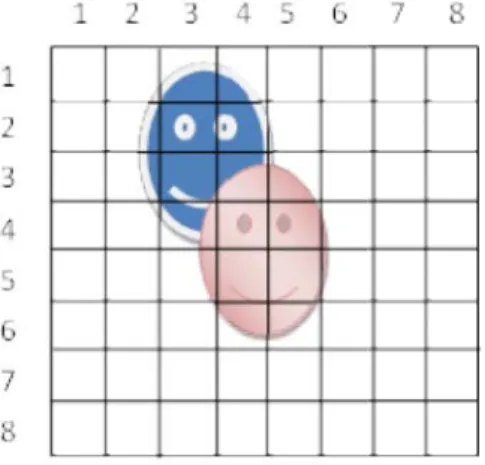
C.Horizontal and Vertical Displacemen
To handle horizontal and vertical displa from the calibration position, it is imagin
head is contained within a 2D mapping g an eye-gesture mapping grid used to dete between eye-gesture templates and t elements within the vehicle as the dri horizontally or vertically. In the diagram, used and two drivers are shown. The pink of the two drivers. Her right eye is located Suppose the pink driver is in the calibrat head is in a neutral, forward facing
templates are created from the pink driv
looks at the centre of the point-of-reg keeping her head stationary. With 24 poin (windscreen cells), there would be 24
gesture templates calibrated for the pin
located in cell(4,5) in the forward facing he
Fig. 2 Eye Gesture Mapping G
(3) (4) es, we know x and d. e can calculateΔxand t of regard on the number of ways. For pends upon the seat eat position. It would e in distance from the
the driver’s head.
Ford Focus car have es are captured at the nd the forward and rder of 10cm in each gard displacements are dscreen cells when the cells. This means that aximum forward or the cell upon which the
ents
placements of the head
ned that the driver’s
grid. Figure 2 shows etermine the mapping the point-of-regard driver shifts position m, a grid of 64 cells is nk driver is the shorter ed in cell(4,5).
ration position and her ng pose. Eye-gesture
ver’s left eye as she
regard element while int-of-regard elements 4 corresponding
eye-nk driver’s left eye
head pose.
g Grid
Provided the pink driver d the pinkdriver’s left eye and
at a particular windscreen ce driver is looking at that wind the case for the blue driver w the left of the pink driver. His 4). A match between the blu gesture template looking at a not indicate that the blue dr windscreen cell due to the fa one cell to the left and two cel
If the driver’s left eye
vertically byΔy from the cali
point of regard on the windsc
Δx and Δy providing the drive
within the XY plane and the The Ni-DASS system will me video image from the on-bo
driver’s face. In order to calc
values, it is necessary to det real-world head displacemen within video. This can be ac
height of the calibration driv dividing by the length of the
within the video.
IV. EV
A. Experiment One
The windscreen of a Ford F cells consisting of 4 rows of image of the car with the wi masking tape.
Fig. 3 Marking ou A CCD camera was placed
and aligned to capture the dri
a Sentient 540TVL IR CCTV spectrum and infra-red camera a sensor size of 1/3 inch. A during the experiment. The ca able to capture the driver’s h
positions. To create the eye-driver was asked to sit in the driver seat position at the mi backward adjustments.
r does not move, a match between
d an eye-gesture template looking cell would indicate that the pink ndscreen cell. However, this is not r who is taller and is positioned to is left eye is located within cell (2, blue driver’s left eye and an eye-t a pareye-ticular windscreen cell need driver is actually looking at that fact that his left eye is displaced cells above the calibration cell.
moves horizontally by Δx and ibration position then the driver’s
screen or mirror will also move by
ers head movement is constrained
he gaze direction has not changed. measureΔx and Δy in pixels in the
board CCD camera observing the
culate the real-world displacement determine the scaling between the ents and the pixel displacements achieved simply by measuring the
ver’s head in real-world units and
calibration driver’s head in pixels
EVALUATION
d Focus car was divided up into 24 of 6 columns. Figure 3 shows an windscreen cells marked out with
out 24 windscreen cells
ced on the centre of the dashboard
iver’s face. The camera used was TV Camera. This is a dual visible era with a variable focal length and A focal length of 4mm was used camera was positioned so as to be
head in the full range of driving
ye-gesture templates, a calibration he normal driving position with the mid-way point of the forward and
The calibration driver was asked to rotate her head to face
each windscreen cell. When the calibration driver’s head was
rotated to face a windscreen cell, eye-gesture templates were
captured of the calibration driver’s left eye looking at eachof the 24 windscreen cells while keeping her head pose fixed.
This process was repeated with the calibration driver’s head
rotated to face each cell. This produced 24 sets of eye-gesture templates with each set having 24 templates. These eye-gesture templates were then cropped to approximately the
same size and show the calibration driver’s left eye with a
small portion of skin surrounding the eye. A video of a test driver was captured repeating the same head pose and eye pose observations used when capturing the templates. The test
driver’s head pose was estimated using the 2D approach proposed by [19]. Once the head rotation about the x-axis (up-down) and y-axis (left-right) was estimated, the nearest matching gesture-template set was used to match with the
driver’s eye.
1) Result of Experiment One
Table I shows the results of the test driver rotating her head to face windscreen cell(1,6) (top right) while looking at windscreen cell(1,1) (top left). As can been seen the highest matching eye-gesture template was for template (1,1). The matching results gradually decrease going from left to right
along the table to reflect the movement of the driver’s pupil as
she scans the top row of windscreen cells and thus increasing the disparity between the templates and the driver’s eye-gaze pattern. The same pattern is observed for subsequent rows with the left most templates obtaining the highest matching result in each case and gradually decreasing. Within each column in Table I, the top row achieves the highest match with subsequent rows being lower to reflect the movements of the eye gaze from the top of the windscreen to the bottom.
TABLE I
TEMPLATEMATCHINGRESULTFORTESTDRIVERHEADROTATEDTOFACE
WINDSCREENCELL(1,6) WHILELOOKINGATWINDSCREENCELL(1,1)
B. Experiment two
The same experimental setup as in Experiment One was followed to divide the windscreen into 24 cells and to capture the eye-gesture templates. If the camera lens is considered to be at the origin of a Cartesian coordinate axis with the positive x-axis pointing to the right of the driver, the positive y-axis pointing up and the positive z-axis pointing out the windscreen
then the calibration driver’s left eye was measured to be at
coordinate (40.6cm, 17.8cm, -91.4cm). The driver’s car seat
was move forward to the maximum extent and the coordinates
of the driver’s left eye measure then the car seat was moved
backward to the maximum extent and the coordinates of the
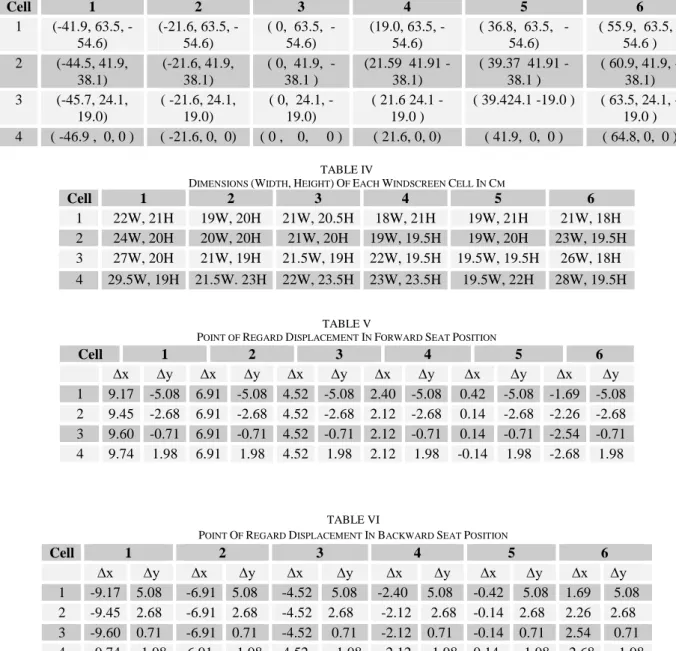
driver’s left eye were recorded once again.Table 2 shows the coordinates of the left eye in the forward, calibration and backward seat positions. The coordinates of the centres of the windscreen cells were recorded and are presented in Table 3 and the dimensions of the windscreen cells are presented in Table IV.
TABLE II
COORDINATESOFTHEDRIVER’SLEFTEYEWHENTHEDRIVER’SSEATIS
MOVEFORWARDANDBACKWARDTOTHEFULLEXTENTANDATTHE
CALIBRATIONPOSITION
Using Equation 4, Δx was calculated for the forward and
backward seat positions where x is the distance between the
centre of each windscreen cell and the driver’s point of regard
in the neutral forward facing position measured along the x-axis, d is the distance of the driver’s eye along the z-axis at the calibration position andΔd is the displacement of the driver’s
left eye along the z-axis with respect to the calibration position at the forward and backward seat positions. An analogous calculation was performed for Δy. Table 5 shows the
calculatedΔx and Δy for the forward seat position and Table 6
shows the calculated Δx and Δy for the backward seat
position.
1) Results of Experiments Two
Table V shows the displacement of the driver’s point of
regard within each cell based upon the forward seat position
with the driver’s head fixed in a forward neutral position.
Examining the values of Δx and Δy shows that the change in the driver’s point of regard never exceeds half the width or
height of the cell. This means that, if the driver focuses her eye-gaze on the centre of a cell, then the driver’s point of
regard in the forward and backward seat position remain in the cell. This suggests that the impact of small forward and backward movements associated with adjustments of the
driver’s seat will have a limited impact upon point of regard
determinations. In the cell(1, 1) (top left windscreen cell) when the driver moves forward toward to the maximum seat position, the point of regard is displaced 9.17cm to the right The coordinates of the point of regard will decrease 5.08cm along the y-axis as the driver moves forward. This means that
the driver’s point of regard will stay within the horizontal and
vertical bounds of the cell. This is true for all 24 cells. Similar results are obtained for backward seat positions presented in Table VI.
CONCLUSION
This paper presents continued work to develop the Ni-DASS system which aims to monitor driver eye-gaze and to
x y Z Forward 40.64cm 17.78cm -81.28cm Calibration 40.64cm 17.78cm -91.44cm Backward 40.64cm 17.78cm -101.6cm Templa te 1 2 3 4 5 6 1 76.1 41 % 71.9 17 % 75.230 % 57.563 % 51.0 02 % 43.656 % 2 73.4 93 % 70.6 51 % 66.186 % 57.580 % 55.4 79 % 54.641 % 3 72.8 68 % 66.0 32 % 61.290 % 64.210 % 58.3 87 % 49.175 % 4 63.1 26 % 61.1 31 % 57.279 % 56.589 % 54.5 33 % 53.272 %
TABLE VI
POINTOFREGARDDISPLACEMENTINBACKWARDSEATPOSITION
TABLE III
COORDINATESOFTHECENTREOFEACHWINDSCREENCELLWITHTHECAMERAATTHEORIGINWITHCOORDINATESINCM
TABLE IV
DIMENSIONS(WIDTH, HEIGHT) OFEACHWINDSCREENCELLINCM
Cell 1 2 3 4 5 6 1 22W, 21H 19W, 20H 21W, 20.5H 18W, 21H 19W, 21H 21W, 18H 2 24W, 20H 20W, 20H 21W, 20H 19W, 19.5H 19W, 20H 23W, 19.5H 3 27W, 20H 21W, 19H 21.5W, 19H 22W, 19.5H 19.5W, 19.5H 26W, 18H 4 29.5W, 19H 21.5W. 23H 22W, 23.5H 23W, 23.5H 19.5W, 22H 28W, 19.5H TABLE V
POINT OFREGARDDISPLACEMENTINFORWARDSEATPOSITION
Cell 1 2 3 4 5 6 1 (41.9, 63.5, -54.6) (21.6, 63.5, -54.6) ( 0, 63.5, -54.6) (19.0, 63.5, -54.6) ( 36.8, 63.5, -54.6) ( 55.9, 63.5, -54.6 ) 2 (-44.5, 41.9, 38.1) (-21.6, 41.9, 38.1) ( 0, 41.9, -38.1 ) (21.59 41.91 -38.1) ( 39.37 41.91 -38.1 ) ( 60.9, 41.9, -38.1) 3 (-45.7, 24.1, 19.0) ( -21.6, 24.1, 19.0) ( 0, 24.1, -19.0) ( 21.6 24.1 -19.0 ) ( 39.424.1 -19.0 ) ( 63.5, 24.1, -19.0 ) 4 ( -46.9 , 0, 0 ) ( -21.6, 0, 0) ( 0 , 0, 0 ) ( 21.6, 0, 0) ( 41.9, 0, 0 ) ( 64.8, 0, 0 ) Cell 1 2 3 4 5 6
Δx Δy Δx Δy Δx Δy Δx Δy Δx Δy Δx Δy
1 9.17 -5.08 6.91 -5.08 4.52 -5.08 2.40 -5.08 0.42 -5.08 -1.69 -5.08 2 9.45 -2.68 6.91 -2.68 4.52 -2.68 2.12 -2.68 0.14 -2.68 -2.26 -2.68 3 9.60 -0.71 6.91 -0.71 4.52 -0.71 2.12 -0.71 0.14 -0.71 -2.54 -0.71
4 9.74 1.98 6.91 1.98 4.52 1.98 2.12 1.98 -0.14 1.98 -2.68 1.98
Cell 1 2 3 4 5 6
Δx Δy Δx Δy Δx Δy Δx Δy Δx Δy Δx Δy
1 -9.17 5.08 -6.91 5.08 -4.52 5.08 -2.40 5.08 -0.42 5.08 1.69 5.08
2 -9.45 2.68 -6.91 2.68 -4.52 2.68 -2.12 2.68 -0.14 2.68 2.26 2.68
3 -9.60 0.71 -6.91 0.71 -4.52 0.71 -2.12 0.71 -0.14 0.71 2.54 0.71
4 -9.74 -1.98 -6.91 -1.98 -4.52 -1.98 -2.12 -1.98 0.14 -1.98 2.68 -1.98
alert the driver in situations where attention is lacking. The work presented here use eye-gesture templates to provide low-resolution point of regard determinations with natural head movements that take place in the vehicle.
The results indicate that the approach might be suitable for point of regard determinations in situation when high accuracy is not required. Such situations would be hazard awareness systems where the ADAS system would alert the driver if he or she is failing to observe a hazard on the road by detecting situations when the driver is positively looking elsewhere.
REFERENCES
[1] WHO, “World Health Report, Technical Report”, World Health
Organisation, http://www.who.int/whr2001/2001/main/en/index.html, 2001.
[2] OECD, “Organisation for Economic Co-operation and Development, Factbook 2006– Economic”, Environment and Social Statistics: Quality
of life. http://www.sourcecd.org, December, 2006.
[3] Department for Transportation, “’Reported Road Casualties Great
Britain 2008-Annual Report”, [Online]. Available
http://webarchive.nationalarchives.gov.uk/20110503151558/http://dft.go v.uk/pgr/statistics/datatablespublications/accidents/casualtiesgbar/rrcgb2 008., 2008.
[4] National Highway Traffic Safety Administration, “National Motor Vehicle Survey Crash Causation: Report to Congress”, www.nhtsa.gov,
pp. 35, July, 2008.
[5] Neale, V. L. “Overview of the 100-Car Naturalistic study and findings”,
Proceedings of the International Conference on Enhanced Safety of Vehicles, 2005.
[6] Fletcher, L. and Zelinsky, A., “Driver Inattention Detection based on
Eye Gaze–Road Event Correlation”, International Journal of Robotics,
pp. 774–801, 2009.
[7] MohdZaid, S.N.H., Mohamed A.M, and Soliman, A.H.,“Towards Eye Gesture Analysis for Driver Assistance System using Template Matching”,Proceeding of the 4th Engineering Conference, Malaysia, 2011.
[8] Jim Horne and Louise Rayner, “Sleep Related Vehicle Accidents,
Laboratory”, Sleep Research,Loughborough University, 2000
[9] Flores, M., J., Armingol, J., M., and Escalera, A.,“Real Time Warning System for Driver Drowsiness Detection Using Visual Information, Journal of Intelligent and Robotic”, vol.59, no.2, 2010.
[10] Kutila, M., Jokela, M., Markkula, G., Rue, R.M.,“Driver Distraction Detection With A Camera Vision System”, IEEE International Conference on Image Processing ICIP, pp.201-204, 2007.
[11] Kircher, K., Ahlstrom, C., Kircher, A., “Comparison of Two Eye Gaze Based Real-Time Driver Distraction Detection Algorithms in A Small–
Scale Field Operational Test”, Proceedings of Fifth International Driving Symposium on Human Factors in Driver Assessment , Training and Vehicle Design, pp.16-23, 2009.
[12] Royal Society for the Prevention of Accident (ROSPA), “What are the most cause of Road Accident”, [Online].Available http://www.rospa.com/faqs/detail.aspx?faq=298. , 2011.
[13] Gejgus P. and Sparka M., “Face Tracking in Color Video Sequences”, Proceedings of the 19th Spring Conference on Computer Graphics, Slovakia,pg. 268-273, 2003.
[14] Cannolly,C.,“Driver Assistance Systems Aim to Halve Traffic
Accidents’’, Journal of Drivers, Transportation safety, Road safety, Motorways, Car, vol. 29, no.1, pg. 13-19, 2009.
[15] Batista, J., “A Drowsiness and Point of Attention Monitoring System for Driver Vigilance”, Proceedings IEEE Intelligent Transportation Systems Conference, pp.702–708, 2007, USA.
[16] Swain,M.J., and Ballard, D.H.,“ColorIndexing’’, International Journal
of Computer Vision, vol. 7, no. 1, pp. 11-32, 1991.
[17] Bergasa, L., M., Nuevo, J., Sotelo, M., A., Barea, R., and Lopez, M., E.,
“Real Time System for Monitoring Driver Vigilance”, IEEE Transactions on Intelligent Transportation Systems, vol. 7, no. 1, pp.63-77, 2006.
[18] Knipling, R., and Rau, P., “PERCLOS : AValid Psycho physiological Measure of Alertness as Assessed by Psychomotor Vigilance”
[Online].Available from : www.fmcsa.dot.gov/documents/tb98-006.pdf, 1994.
[19] Gee, A. H. and Cipolla, R.,”Determining theGaze of Faces in Images”,
Image and Vision Computing, vol.12,no. 10, pp.639–647, 1994.