Tariff Escalation in the Doha Talks--Bringing the Issue to Resolution
41
0
0
Full text
(2) Tariff Escalation in the Doha Talks – Bringing the Issue to Resolution John Wainio and David Vanzetti1 USDA and Australian National University. Abstract Development objectives dictate that the Doha negotiations address tariff escalation. This could increase the production and export of processed goods in developing countries, expand investment and employment, and reduce dependence on primary product exports. Despite its importance, little progress has been made, notwithstanding that a successful conclusion to the negotiations will not be possible without bringing this issue to resolution.. This paper. quantifies tariff escalation within WTO members' tariff schedules and the degree to which a tiered formula could address this problem. Utilizing a detailed partial equilibrium global agricultural trade model we estimate the possible trade and welfare impacts from reducing tariff escalation. JEL subject codes F13, Q17. Key words: tariff escalation, agriculture, trade, tariffs, WTO.. 1. ERS, US Department of Agriculture, Washington, D.C. and Crawford School of Economics and Government, Australian National University. The views expressed are those of the authors, and may not be attributed to the affiliated institutions. Contact: [email protected]..
(3) Introduction Tariff escalation refers to situations where tariffs are higher on processed products than on primary products, thus providing higher effective protection to the domestic processing industry in import markets. Within the WTO’s Doha negotiations, tariff escalation has been identified as a particular form of protection that impedes the efforts of countries to move from primary to value-added production and exports and, particularly in the case of developing countries, it is blamed with hindering economic development. Developing countries have repeatedly stressed the need to reduce their dependence on traditional primary product exports. Twenty five years ago they were responsible for the GATT Ministerial Declaration of 1982 containing the statement that “prompt attention should be given to the problem of escalation of tariffs on products with a view to effective action toward the elimination or reduction of such escalation where it inhibits international trade, taking into account the concerns relating to exports of developing countries.” (Yeats, 1987). The Punta del Este Ministerial Declaration included the statement that, “The negotiations shall aim to reduce or eliminate tariff and nontariff measures, including tariff escalation” (World Bank, 1987). And, while the Doha Ministerial Declaration refers only to tariff escalation in relation to market access for non-agricultural products, the 2004 Agreed Framework of the Doha Development Agenda, committed WTO members to tackling tariff escalation in agriculture through a “formula to be agreed” (WTO, 2004). In the current round, the idea behind applying a subsequent formula if the disparity between the tariff on a primary product and its processed form was not eliminated or sufficiently reduced by the general tariff reduction formula first appeared in a draft modalities text by the then Chairman of the Agriculture Negotiating Group, Stuart Harbinson (WTO, 2003). While the term ‘tariff escalation’ was not used in this text, it did contain a statement directly following language on the general tariff reduction formula that stated, “In applying this formula, where the tariff on a processed product is higher than the tariff for the product in its primary form, the rate of tariff reduction for the processed product shall be equivalent to that for the product in its primary form multiplied, at a minimum, by a factor of [1.3].” The brackets indicate the factor had still to be negotiated. As Sharma (2006) has pointed out, this rather concrete formula proposal seemed to be lost for many years. The December 2005 Hong Kong Ministerial Declaration, the latest official text available on the negotiations, pointed out that although there had been no material.
(4) convergence on the issue of tariff escalation, “there is still full agreement on the need for this to be done, and a genuine recognition of the particular importance of this for commodities exporters.” The fact is that, between the Harbinson draft of 2003 and a 2006 draft modalities paper by Agriculture Negotiating Group Chairman Crawford Falconer (which modified the formula found in the Harbinson proposal), there have been almost no concrete proposals from WTO members on addressing tariff escalation. This was highlighted in a May 2007 paper by Falconer containing a first set of his ideas on where members’ positions might converge (WTO, 2007a). He referred to tariff escalation as an issue that was “scarcely anywhere in serious negotiation terms”, adding that, “I could only conclude that your revealed preferences to this point are that you would expect this to drop by the wayside.” Two months later, however, Falconer drew up a new Draft Modalities for Agriculture in which he maintained that “we cannot close this negotiation nor have a final text without bringing this issue (tariff escalation) to resolution also.” Instead of providing a “one size fits all” formula for addressing tariff escalation, Falconer proposed that a maximum threshold level of [x] percentage points be agreed between primary and processed products (WTO, 2007b). It would then be relatively straightforward to determine what additional cut was needed in the processed product tariff to reduce the tariff wedge between the primary and processed products below the agreed threshold. In January 2008, Falconer distributed a working document on tariff escalation that contained yet another formula for addressing tariff wedges not eliminated or sufficiently reduced after application of the general tariff reduction formula (WTO, 2008). The latest formula is tied to the general tariff reduction formula with processed tariffs in the bottom tier taking the larger tariff cut of the second tier if tariff escalation remains. Similarly, processed tariffs in the second tier would take the tariff cut in the third tier, and so on. Processed tariffs in the top (fourth) tier would either not be subject to larger cuts or would take a cut increased by a factor of [0.3]. There are also a few exceptions that serve to moderate when supplementary cuts would be made. First, where the difference between the processed and primary product tariffs is less than five percentage points, no additional cut would made to the processed product tariff [except in the case of the bottom tier]. Second, no tariff escalation treatment would be made to products declared as Sensitive. Finally, in keeping with a stipulation made in the Draft Possible Modalities for Agriculture (WTO, 2006d), the supplementary formula would only be applied to the extent needed to eliminate the wedge between the processed and primary product, to ensure that it does not result in tariff de-escalation. In this study we attempted to answer three questions. First, to what extent is tariff escalation a problem in agricultural trade?. Second, to what extent will a general tiered tariff-cutting.
(5) formula address tariff escalation in bound and applied tariffs?. Third, to what extent will. reducing tariff escalation benefit exporters of raw materials, particularly developing countries? The first question is addressed by examining bound and applied tariff rates for different stages of production in selected countries as well as the share of imports under each stage. Tariff escalation would be partially addressed through the application of the general tiered tariff cutting formula being considered by members, since this formula cuts higher tariffs by greater amounts. In Draft Modalities for Agriculture (WTO, 2007a), Falconer provided an example of this tiered formula with a range of coefficients. We applied the high and low parameters in his range to the tiered formula to answer question two. Question three is addressed using a detailed partial equilibrium global agricultural trade model that estimates the possible gains to developing countries from reducing tariff escalation. Empirical results from the literature Many studies have produced evidence that tariff escalation is indeed a feature of the postUruguay Round tariff schedules of many countries. Among the first was a study by the WTO (1996), which concluded that, while there was no general pattern of tariff escalation applying to all selected categories and countries concerned, it remained a problem. In the tariff schedules of countries studied (Brazil, Canada, European Union, India, Indonesia, Japan, Malaysia, Poland, Hungary, and the United States) tariff escalation existed in such sectors as textiles and clothing, and leather, rubber, and wood products. This study, however, examined only a limited number of agricultural products and failed to include specific tariffs in its calculations. A study by Lindland for the Food and Agriculture Organisation (1997) focused on pre- and post-Uruguay Round tariffs on agricultural products in the EU, US, and Japan. The study, which covered almost 300 agricultural commodities, was done at various stages of the production chain from raw materials through intermediate products to final consumer goods. Lindland found that more than 80 per cent of nominal tariff wedges between raw materials and processed products would decrease after all Uruguay Round tariff cuts were imposed. However, for over half of the primary/processed pairs examined in these countries tariff escalation would continue to exist. The wedge between primary and process goods would average 16 per cent in the EU (down from 23 per cent in the base years 1986-88), 27 per cent in Japan (from 35 per cent), and 9 per cent in the US (from 12 per cent). Using the FAO’s supply/utilization tables, Lindland also calculated effective protection rates (EPRs) for.
(6) selected products. EPRs measure the protection provided to the value added in a processed product.2 EPRs were estimated to be 44 per cent for wheat flour and 25 per cent for orange juice in the EU; 30 per cent for refined sugar and 12 per cent for roasted coffee in Japan; and 13 per cent for soybean oil and 42 per cent for condensed milk in the US. Lindland also found some EPRs to be negative, with tariffs on primary goods much higher than on processed goods. However, only bound tariffs were taken into account – access to raw materials under applied tariffs, tariff quotas, or preferential tariffs could yield a different outcome. A joint study by UNCTAD/WTO (2000) estimated EPRs for leather shoes and cotton shirts, two major export products of interest to developing countries. Like Lindland’s, their analysis was done on two stages of processing beyond the primary product. They found that effective protection doubled in the US and Canada between the intermediate stage of leather production to the final stage of leather shoes (from 7 to 12 per cent and 15 to 32 per cent, respectively). The increase was even more dramatic in Malaysia, where effective protection increased from 16 to 44 per cent, while the EU demonstrated negative protection, with an EPR of 14 per cent on leather production and only 9 per cent for the shoe industry. The EPRs along the cotton shirt production process were found to be even larger but also negative in more cases. For example, effective protection for the spinning industry peaks at 70 per cent in Malaysia, while the EPR for cotton shirts was less at 58 per cent. Analysing the WTO Trade Policy Reviews for the Quad countries (Canada, EU, Japan, and US), Hoekman, et al. (2001) found that the tariff structure of developed countries showed significant tariff escalation. For example, fully processed manufacturing food products were reported to face tariffs twice as large as products in the first stage of processing in the EU and Japan, with final goods confronting an average MFN tariff of 24 and 65 per cent, respectively. In Canada the ratio was found to be even higher: tariffs on fully-processed food products were 12 times higher than for first stage processed products (the MFN tariff on fully processed was 42 per cent). They also point out that the existence of duty-drawback systems for exporters in these countries and the fact that GSP preferences are more likely to be granted for products. 2. Assume the raw materials used to produce a bar of chocolate account for 60 per cent of the final cost. Thus, the value added on a $1 bar would be 40 cents. Under free trade, domestic production will be competitive with imports up to the point where domestic processing costs equal 40 cents per bar. If the country imposes a 20 per cent duty on chocolate, while the ingredients can all be imported duty free, the cost of a bar of chocolate in the domestic market can now be competitive with imports at $1.20 and the processing industry can now compete as long as costs are equal to or below 60 cents. In this case, the effective protection rate (EPR) to the domestic processing industry is 50 per cent ((6040)/40), even though the nominal duty on chocolate is only 20 per cent..
(7) with low MFN tariffs, reinforces the degree of escalation, as some imports of semi-processed products or raw materials are exempted from duties when used as inputs in export production. In a comprehensive study for the Swedish Board of Agriculture, Jordbruks Verket (2001) found that the tariff schedules of all countries studied provide a degree of protection for certain processing industries. Nominal tariff escalation in some form (positive or negative) was approximately as common as the situation where tariffs were identical for the raw material and processed product. However, even in cases where the tariff on the raw material was higher than on the processed product, the EPR may still have been positive. Based on calculated EPRs, trade in compound products tended to be more liberalized than trade in raw materials or products derived from only one input. Finally, two recent studies have been done by FAO economists. Elamin and Khaira (2004) found tariff escalation to be most pronounced in a number of commodity sectors of interest to developing countries, including meat, sugar, fruit, coffee, cocoa, and hides and skins. They also found that tariff escalation was less pronounced in the actual application of tariffs than countries’ bound schedules would indicate, which helps explain why trade in processed agricultural goods has been growing much faster than trade in primary goods. Applied tariffs in developing countries tend to be much lower than bound tariffs. Nonetheless, Elamin and Khaira also found that the overall share of developing countries in world exports of processed products had declined between the 1980s and 1990s, which underscores why these countries are so committed to addressing this issue in the Doha negotiations. Sharma (2006) quantified, for selected products and countries, changes in tariff escalation following application of tariff-cutting formulas proposed by the G-20, EU, and US. All three formulas reduced tariff escalation considerably, but did not eliminate all primary/processed product tariff wedges. He stressed the important role that the tariff caps in these formulas played in eliminating tariff escalation when imports of processed products are subject to megatariffs. He also considered how the remaining incidences of tariff escalation may be addressed, noting that it will be difficult to agree on the choice of formula as well as on a listing of processed products and their corresponding primary inputs. He concluded that a ‘one size fits all’ formula such as in the 2003 Harbinson text is an arbitrary solution which would eliminate tariff escalation in some primary/processed pairs while leaving large wedges in place in other cases. Instead, negotiators would be wise to agree on a threshold, or de minimus level, within which to contain the size of the tariff wedge between primary and processed products. As well, he proposed all interested WTO members draw up a list of tariff lines on processed products for targeting tariff escalation. From these lists a definitive list.
(8) could be drawn up based on the (100 or so) most common processed product tariff lines found. Nominal tariff escalation in bound and applied tariff schedules The first step to measuring the degree of tariff escalation within WTO member’s tariff schedules is to come up with a list of processed product tariff lines and corresponding primary product inputs. The problem with drawing up such a list is limiting it to a manageable subset of products of most concern to WTO members from the multitude of products that potentially face tariff escalation. From a practical standpoint, one might eliminate products that are made from more than one raw material, as it is not possible to measure tariff escalation in these cases by simply comparing the tariffs on the primary and processed products. Further, one could also limit how far up a processing chain to go, as it is sometimes difficult to link a given processed product to a less-processed or primary product (Delegation of Canada, 2006). In this study, we used an extension of a provisional list of primary products and their processed forms found in Chairman Falconer’s Draft Possible Modalities in Agriculture (2006d).3 This list does not necessarily reflect the products that will be ultimately agreed upon by WTO members and, importantly, it is limited to one stage of processing beyond the primary product (see Appendix table 1 for a list of these primary/processed product pairs). Our bound tariff database contains 130 pairs of primary/processed bound tariffs at the HS6 digit level for 121 WTO members. Because many countries have bound their agricultural tariffs at a more disaggregated level than HS6, there are a total of 34,074 distinct primary/processed bound tariff pairs in our database.4 Applied tariffs were only available for 107 of our 121 countries. Even when available, it was not always possible to match bound and applied rates across all tariffs for each country. As a result, our applied tariff database only contains 30,751 primary/processed applied tariff pairs. As in past studies, nominal tariff escalation is measured by calculating the wedge between the tariff on the processed product and that on the primary product. Tariff escalation was found to exist in 37 per cent of the 34,074 primary/processed bound tariff pairs across all countries studied. Of the remaining 63 per cent of cases, in 47 per cent the bound tariff on the primary good equaled the bound tariff on the processed good while 16 per cent were cases of tariff deescalation, i.e. the bound tariff on the primary good exceeded that on the processed good.. 3. This list is based on one proposed by Canada for the consideration of WTO members (Delegation of Canada, 2006). 4 The raw tariff data is taken from the WTO’s IDB and CTS databases. Ad valorem equivalents for non-ad valorem rates were calculated following the method agreed by WTO members. WTO copyright of this data is gratefully acknowledged..
(9) The results were very different across economic groupings, with bound tariffs in developed countries showing the existence of tariff escalation in 54 per cent of cases versus 34 per cent for developing countries.5 Developed countries also showed a much higher degree of tariff de-escalation, with 37 per cent of processed tariffs being smaller than the associated primary tariff versus 12 per cent in developing countries. Developing country bound tariff schedules are much more likely to be uniform, with 54 per cent of the processed tariffs examined equal to those on the primary product. Over all primary/processed pairs for which our database contained an applied rate tariff escalation was evident in 55 per cent of cases, or considerably above what exists across the bound rates. This difference is explained in the applied rates levied by developing countries, which demonstrated tariff escalation in 55 per cent of cases versus only 37 per cent in their bound schedules. For developed countries, there was little difference in the proportion of cases showing tariff escalation between bound and applied tariffs, as these countries are much more likely to levy duties at bound levels. However, the depth of tariff escalation, as measured by the tariff wedge between the processed product tariff and its associated primary product tariff, is greater for applied tariffs, indicating that when developed countries apply tariffs below the bound rate, larger tariff cuts, or concessions, are usually made on primary product imports. Appendix table 1 compares bound tariff averages and tariff wedges over our 130 primary and processed product pairs for developed and developing countries. Some comments on the data are in order. First, since it is specifically those occasions where tariff escalation exists that interest us, the averages in this table are based only on primary/processed pairs with a positive tariff wedge. Calculating overall averages obscures the depth of tariff escalation, especially in those products where strong tariff de-escalation exists. Second, we aggregated all tariffs to the HS6 digit level before averaging across countries. This can hide tariff peaks especially in countries with a high degree of tariff disaggregation within HS6 categories. On the other hand, some relatively high average tariffs may be the product of a few megatariffs in a product group, even though the remainder of tariffs in that group are small or zero. Despite the potential bias introduced by aggregating tariffs, some broad conclusions can be reached. First, average bound tariffs for both primary and processed products tend to be higher in developed countries than in developing countries. Developed countries also tend to have a higher degree of overall tariff escalation based on the tariff wedges between associated processed and primary products. 5. The developed country grouping is made up of Australia, New Zealand, Canada, EU, Japan, US, Iceland, Norway, and Switzerland. All other countries are in the developing country grouping..
(10) The most pronounced tariff escalation in developed countries occurs on trade in meats, due to some very high over-quota tariffs in Switzerland (beef), Iceland (beef and pork), and the EU (beef) coupled with low tariffs on animal imports. High tariff escalation is also evident for oil meals (high over-quota tariffs in Norway); shelled groundnuts (high over-quota tariffs in Japan, Norway, Iceland, and the U.S.); rolled wheat (Japan and Switzerland); and potato starch (Japan). All of these products had average tariff wedges of over 100 ad valorem percentage points.. Chocolate and cocoa powder imports are also subject to high tariff. escalation and are two of only four product pairs where tariff escalation was found across all developed countries. The other two were on trade of selected processed beef products and soybean oil. Further instances of high tariff escalation within individual countries include various fruit juices in the EU and the US, orange juice in Australia, grape juice in Switzerland, sugar in Japan, and tomato products in New Zealand. While trade in meat cuts was subject to considerable tariff escalation, trade in offal, tongues, and livers tended to face low tariffs and little tariff escalation, as did trade in dried grapes, cocoa butter and paste, and some oilmeals.. Tariff escalation occurred in at least one country for all of the 130. primary/processed pairs we examined. Tariff escalation was most prevalent in the developing world for trade in wheat products (flour, groats and meal, pellets, starch, and gluten), beef, and pork.6 Over forty developing countries showed tariff escalation for these products, with tariff wedges averaging between 30 and 60 percentage points. Other instances of high tariff escalation include trade in oat products, due to high tariffs in Korea and Malaysia, processed potatoes in Malaysia; lamb and mutton in Morocco and Turkey; and vegetable oils in Morocco and India. The lowest incidence of tariff escalation among developing countries tended to be in processed trade of cocoa, coffee, sugar, groundnuts, and potatoes. Among developing countries where the highest frequency of tariff escalation was found were some of the larger or richer countries, such as China, Korea, and Taiwan. Countries with the highest tariff wedges, however, tended to be the poorest developing countries, although the overall average tariff wedge was often based on tariff escalation in only a few primary/product pairs. The conclusion so far is that although by no means universal, tariff escalation is widespread and significant, especially in developed countries.. Developing countries show a much. smaller proportion of tariff escalation in their bound schedules, but their applied tariffs tend to be higher for processed products than primary products, although in most cases the applied 6. Thirty-three developing countries showed no evidence of tariff escalation for these 130 primary/processed pairs. Twenty-one had uniform tariffs across all primary/processed pairs, ranging from Hong Kong and Macao, where all bound tariffs were zero to Lesotho, where all tariffs have been bound at the ceiling rate of 200 per cent. The remaining twelve had some cases of tariff-descalation, but primarily demonstrated tariff parity..
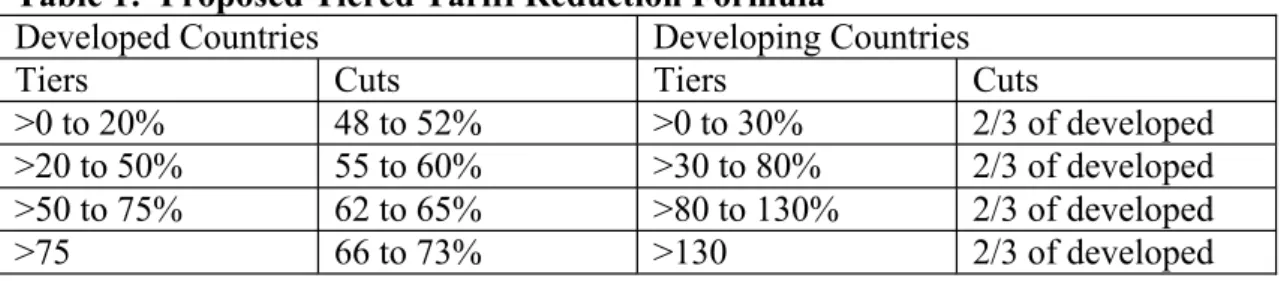
(11) rates are considerably below the bound ones. Because the negotiated tariff reductions apply to bound tariffs, it is instructive to examine the effects of formula cuts on escalation. Impacts of general and supplementary formula cuts on tariff escalation Tariff escalation should be partially addressed through the application of the general tiered tariff cutting formula being considered by members, since this formula cuts higher tariffs by greater amounts. In Draft Modalities for Agriculture (WTO, 2007a), Chairman Falconer provided an example of this tiered formula with a range of coefficients (table 1). We applied the low and high parameters in the range to analyse the extent to which they address existing tariff escalation.. Table 1: Proposed Tiered Tariff Reduction Formula Developed Countries Developing Countries Tiers Cuts Tiers Cuts >0 to 20% 48 to 52% >0 to 30% 2/3 of developed >20 to 50% 55 to 60% >30 to 80% 2/3 of developed >50 to 75% 62 to 65% >80 to 130% 2/3 of developed >75 66 to 73% >130 2/3 of developed In addressing those instances of tariff escalation not eliminated through application of the tiered formula above, the Chairman proposed several approaches, one of which we applied in this analysis. Where tariff escalation is not eliminated, “the bound duty for the processed agriculture product shall be reduced by applying a factor of [1.3] compared to the reduction which would otherwise have been required under the tiered formula or by reducing to the rate applicable to the unprocessed product, whichever is the lesser.” In effect, the depth of cut on processed product tariffs could be increased by up to 30 per cent. So, if a developed country processed product falls into Tier 2 above, and that cut does not eliminate tariff escalation, the cut would instead be increased to 71.5% in the case of our low cut scenario (55% * 1.3) or 78% in the case of our high cut scenario (60% * 1.3). As stipulated by Chairman Falconer, the supplementary formula would only be applied to the extent needed to eliminate the wedge between the processed and primary product, to ensure that it does not result in tariff deescalation. In this analysis of tariff cuts, however, we applied the supplementary cuts in all cases where tariff escalation was still evident after the general cuts; as opposed to the Chairman’s proposal to limit application of the supplemental formula to those cases where the difference between the processed and primary product tariffs remains greater than five percentage points.. We also did not attempt to exempt sensitive products from this. supplementary reduction or subject them to a reduction below that found in the tiered formula, although we do so later..
(12) Appendix table 2 contains the new bound tariff averages after applying both the tiered and supplemental formula cuts. All of the cuts were imposed at the tariff line level with the resulting tariffs again aggregated to the HS6 digit level before averaging across countries. Both of the tiered formulas result in a significant reduction in tariff escalation, particularly in the case of developed countries. Applying the low-end parameters reduces primary tariffs in developed countries on average by 57 per cent and processed tariffs by 73 per cent in cases where tariff escalation exists. For developing countries, the averages drop by 35 per cent for primary products and 38 per cent for processed products. The average tariff wedge across all developed country product pairs drops from 62.7 to 22.1 ad valorem percentage points with low cuts and to 16.9 percentage points with high cuts. For developing countries, the tariff wedge drops from 36.3 percentage points to 20.9 under low cuts and 19.5 under high cuts. The choice of formula, high or low, has little impact on tariff escalation in developing countries. Recall that the tiered formula proposed by Chairman Falconer contains cuts on developing country tariffs which are two-thirds or less those for developed countries (depending on the tier in which the tariff falls). Because developing countries tariffs are cut by so much less, under the high cut scenario the resulting average tariff wedge for developing countries would be about 15 per cent higher than for developed countries, even though it is 40 per cent lower in their base bound tariff schedules. While the tiered cuts deliver sharp decreases in average tariff escalation for most processed products, there still remain high levels of tariff escalation in some individual countries/products. Even under the high cut scenario, tariff wedges in some developed countries remain over 100 percentage points for selected beef and pork products, shelled groundnuts, grape juice, certain grain products, and chocolate; while in developing countries, tariff wedges over 100 points remain in certain grain products, lamb and mutton, and some vegetable oils. Applying a supplemental tariff reduction formula with a coefficient of 1.3 would go a long way toward eliminating most remaining tariff escalation, particularly in the case of the high cut tiered option. Under the low cut option, the supplemental formula would reduce the average tariff wedge across all products to 6.3 percentage points in the case of developed countries and to 13.4 in the case of developing countries.. The high cut. supplemental formula would drop these figures to 1.6 for developed and 8.6 for developing countries.. The conclusion here is that the formula cuts would eliminate much of the tariff escalation found in bound tariff schedules, and the supplemental formula, the 1.3 factor, would eliminate much of the remaining escalation. Significant levels of tariff escalation, defined here as those with a tariff wedge of over 10 percentage points, would be.
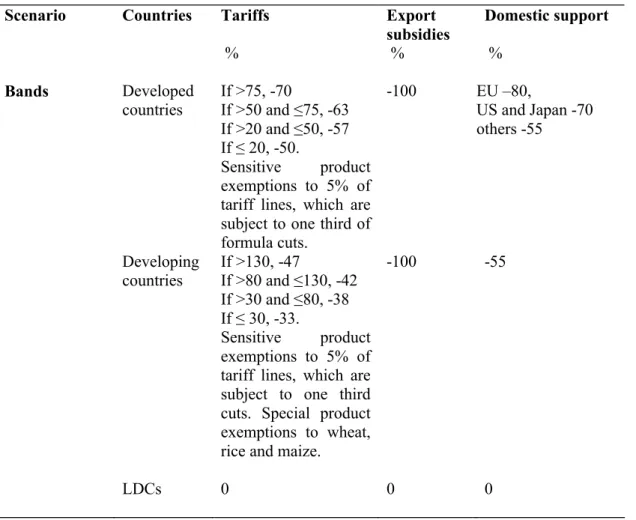
(13) largely eliminated in developed countries. Remaining tariff escalation would be almost exclusively a developing country problem. In developed countries, all but 4 per cent of current primary/processed pairs with tariff escalation would drop below the level of 10 percentage points, while in developing countries, 32 per cent of all significant tariff wedges would remain above that level. It is important to remember, however, that these are estimates on bound not applied tariffs. In the case of developing countries, where tariffs are often levied at rates much below the bound ones, the overall average size of the applied tariff wedge under a low cut scenario would be 13.7 as opposed to 21.1 across the associated bound tariff wedges. Imposing a tariff cap as part of the general tariff reduction formula would also serve to limit tariff escalation, particularly in developed countries, where many processed product imports face megatariffs. A cap of 100 per cent on developed country tariffs would drop the average tariff wedge across all products from 22.1 to 15.2 percentage points in the case of the low cut scenario and from 16.9 to 13.1 under the higher cuts. More important, it would eliminate most tariff wedge peaks. The idea of imposing a cap on tariffs seems to have become lost in the latest draft modalities prepared by Chairman Falconer.. Given the difficulty with negotiating a. supplemental tariff cutting formula to address tariff escalation as well as the potential problem of agreeing on a list of products to target, reinstating the idea of a tariff cap may provide an easier route to at least address the highest levels of tariff escalation. These estimates take no account of trade flows, nor responses by consumers and producers to changes in tariffs. To calculate these effects, and to identify winners and losers, a dedicated trade model is required. A quantitative assessment of tariff escalation We look at two scenarios to assess the scope for a negotiated outcome by varying the tariff on processed products. The standard scenario is similar to one proposed by the G20 group7. It is somewhere between the conservative EU proposal and the more ambitious US offer. The tariff reductions are divided into bands, with the tariff cut depending on the band in which the initial tariff falls. The bands and cuts, shown in table 2, are equivalent to the midpoints found in table 1 for developed countries, but are less ambitious for developing countries; not surprising given that it is the G20’s proposal. To the extent that processed products have higher initial tariffs, the banded cuts automatically address the issue of tariff escalation to some extent. 7. G-20 Proposal on Market Access, 12 October 2005..
(14) Exemptions are made for sensitive and special products, which are identified at the HS6 digit level. Sensitive products are selected as the 5 per cent of tariff lines with the highest tariffs and the cut on these products is one-third that of the general formula. We did not, however, attempt to impose a formula to open tariff quotas for products designated as sensitive. In that respect, our results will underestimate the growth in trade. Special products, which apply only to developing countries, are staple products wheat, rice and maize, and are not subject to tariff cuts. Table 2: The standard scenario Scenario. Countries. Tariffs %. Bands. Developed countries. Export subsidies %. Developing countries. If >75, -70 -100 If >50 and ≤75, -63 If >20 and ≤50, -57 If ≤ 20, -50. Sensitive product exemptions to 5% of tariff lines, which are subject to one third of formula cuts. If >130, -47 -100 If >80 and ≤130, -42 If >30 and ≤80, -38 If ≤ 30, -33. Sensitive product exemptions to 5% of tariff lines, which are subject to one third cuts. Special product exemptions to wheat, rice and maize.. LDCs. 0. 0. Domestic support % EU –80, US and Japan -70 others -55. -55. 0. The second scenario is similar to the first but includes 30 per cent higher tariff cuts on processed products. In other words, the scheduled tariff cuts are multiplied by a factor of 1.3 if the product is considered processed. Thus, for developed countries tariffs in the top band the tariff cut would be increased from 70 to 91 per cent. These additional tariff reductions do not apply to special and sensitive products, which are identified at the HS6 level. And, because our tariffs are already at a highly aggregated level, we imposed the supplementary cut.
(15) on all processed product tariffs. This is different from the stipulation being considered by WTO members to limit the supplementary cut to processed products where tariff escalation is evident (or where the tariff wedge is above 5 percentage points). This could result in slightly higher trade and welfare results. The model To assess the impact of likely WTO agricultural trade policy reform we use ATPSM, a static global agricultural trade model jointly developed by UNCTAD and FAO. The model distinguishes between bound and applied tariffs and includes tariff rate quotas (where the tariff rate depends on whether imports exceed a specified quota), two important features of the post Uruguay Round tariff structure. The model results are driven by changes in policy variables (tariffs, export subsidies and domestic support) which determine changes in domestic prices, consumption and production. This in turn leads to a change in imports and exports, which feed into world prices. The model solves by finding a set of world prices that equate global imports and exports for each commodity. Intersectoral effects are captured through cross-elasticities, but there are no constraints on the use of resources such as land, labour or water. Nor is there account of changes in stocks. Products are assumed to be homogeneous, with consumers and importers indifferent to the source of their products.8 The results indicate the effects of the policy changes assuming a constant base, 2002-2004. There is no account of exogenous growth over the implementation period. The model is welldocumented (Peters and Vanzetti 2004) and is downloadable from the UNCTAD website.9 The data Price and production data are an average of 2002 to 2004 and are compiled from FAO statistics. Elasticities are from FAO's World Food Model. These are based on a trawling of the literature and are not econometrically estimated specifically for the model. Some of the elasticities were modified by the authors to reflect homogeneity, symmetry and other conditions. In-quota tariffs, over-quota tariffs and global quotas, notified to the WTO, are obtained from the AMAD database where available and aggregated to the ATPSM commodity level. Export subsidy data are notified to the WTO and modified by UNCTAD (Peters 2004). Bilateral trade flow data relate to 2004 and are from the United Nations Comtrade database. These are used to allocate global quotas to individual countries. The 8. This differs from the common Armington approach, in which heterogeneous products are differentiated by source. 9 The standard version of ATPSM is downloadable from www.unctad.org/tab..
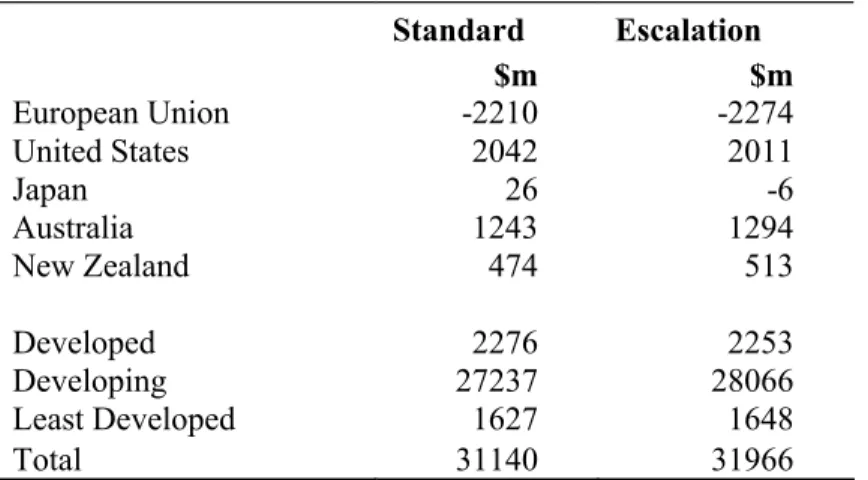
(16) WTO/ITC/UNCTAD World Tariff Profile database is the source of information on applied and bound tariffs, so the data is the same as that used in the tariff analysis of the preceding section. Ad valorem equivalent tariffs are calculated using the Paris Mini-Ministerial method for agricultural products so that the placement in the tiers is correct. Data can be accessed through the WITS software. For this application tariff changes are calculated at the six digit level and aggregated to the 35 sectors using an import-weighting scheme. The present version of the model covers 150 individual countries plus two regions, the European Union, which includes 25 countries, and the Rest of World, which includes those countries, mostly small island economies, not covered explicitly. Developing countries include Republic of Korea, and Taiwan, Province of China. A third group is the 50 least developed countries. There are 35 commodities in the ATPSM data set, including meat, dairy products, cereals, sugar, edible oils, vegetables, fruits, beverages, tobacco and cotton (see Appendix 3). This includes many tropical commodities of interest to developing countries, although many of these have relatively little trade by comparison with some of the temperate products. The results Increasing tariff cuts to address escalation appears to have a relatively minimal impact on trade and welfare. Exports and imports are presented in this section, along with a measure of welfare, which is a summary of producer, consumer and tax-payer impacts. We also look at producer surplus and identify some of the individual commodities that are driving the results. Exports The results presented in table 3 indicate that the greater ambition of the Escalation scenario does not have a significant impact on total agricultural exports. However, for processed products, such as refined sugar, or products that are primarily traded in processed form, such as beef and pigmeat (ATPSM also includes the meat equivalent of live exports for these products) the increases are greater. Refined sugar exports increase an additional 11 per cent in the Escalation scenario, while beef and pigmeat exports increase an additional 14 and 12 per cent, respectively. Tomatoes and citrus also make a sizable contribution, although it is beyond the scope of our model to disaggregate how much of this trade is in the processed forms of these products. Developing countries, who as a group are the major beneficiaries of increased demand for exports, increase their exports by a further $829 million. Least developed countries, who do.
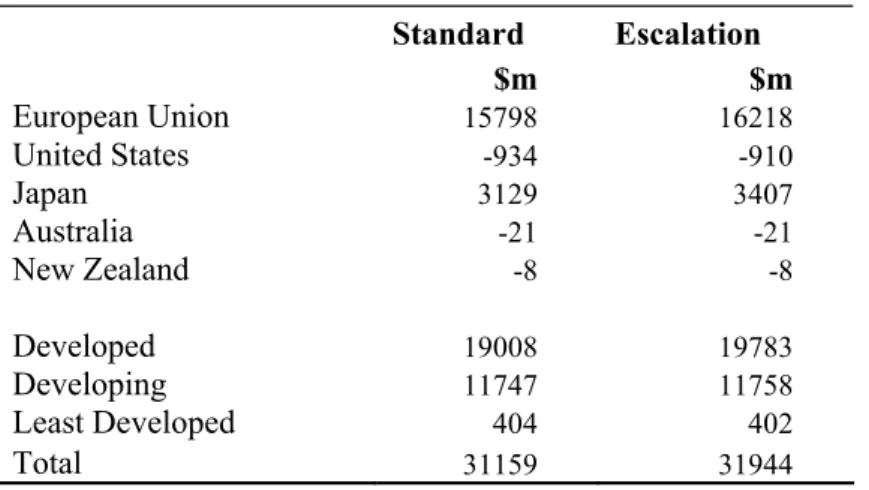
(17) not reduce tariffs in either scenario, also gain marginally. There is a marginal decline of $23 million in developed country exports under the Escalation scenario compared with the Standard scenario. The major contributors to this are the European Union (-$65 million), Japan (-$32 million) and the United States (-$31 million). Australia ($52 million) and New Zealand ($39 million) are the major beneficiaries among developed countries which is consistent with their position that tariff escalation should be addressed in the Doha negotiations. As for developing countries, there are increases in exports of livestock products, but there is a decrease in exports of maize, principally from the United States. Table 3 Change in exports relative to base. European Union United States Japan Australia New Zealand. Standard $m -2210 2042 26 1243 474. Escalation $m -2274 2011 -6 1294 513. Developed Developing Least Developed Total. 2276 27237 1627 31140. 2253 28066 1648 31966. Source: ATPSM simulations.. Imports Agricultural trade liberalisation leads to a large increase in exports from developing to developed countries. Under the standard scenario developed country imports increase by $19.0 billion (table 4), and developing country exports increase by $27.2 billion (table 3). The more ambitious scenario reflecting supplementary cuts increases imports into developed countries, to $19.8 billion. Most of the additional imports are attributed to the European Union (an additional $420 million, mainly sugar, citrus, sheepmeat and pigmeat) but there is also a sizeable contribution from Japan ($278 million, mainly pigmeat and beef). The additional tariff cuts under the Escalation scenario have little impact on developing country imports. Developing country import growth is minimal under the standard scenario because most developing countries are not making significant cuts in applied tariffs, reflecting the gap between bound and applied tariffs. Least developed country imports rise less under the Escalation scenario because of a slightly greater rise in world prices..
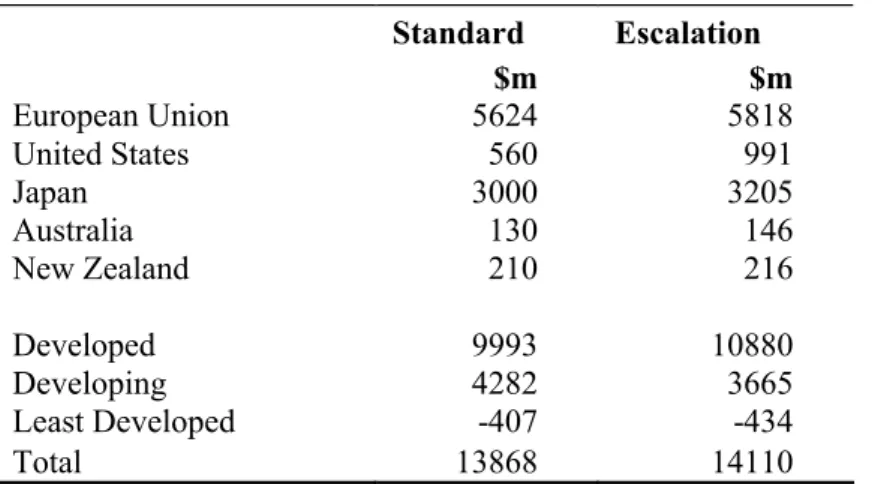
(18) Table 4 Change in imports relative to base Standard $m. Escalation $m. European Union United States Japan Australia New Zealand. 15798 -934 3129 -21 -8. 16218 -910 3407 -21 -8. Developed Developing Least Developed Total. 19008 11747 404 31159. 19783 11758 402 31944. Source: ATPSM simulations. Welfare Static annual welfare gains are shown in table 5. Welfare includes government revenues and expenditures (subsidies) and gains or losses (surpluses) to producers and consumers. It also includes quota rents received by exporters. These rents are eroded when importing countries reduce their MFN tariffs. The rents are effectively transferred to consumers in the importing country. Welfare is a superior measure to export growth in assessing various proposals because it takes into account the costs of producing additional exports. The first observation is that the bulk of the gains, $10 billion, go to developed countries, in spite of the round being focused on development. This is not only because it is the developed countries that provide the bulk of the protection but also because it is these countries that are making the bulk of the cuts. Developing countries have high agricultural bound tariffs, but relatively low trade flows. Developing countries may become worse off for three reasons: (i) rising world prices of imports; (ii) elimination of export subsidies; and (iii) erosion of quota rents received on preferential exports. Among the developing countries, the major winners in terms of welfare are South Korea (maize and oilseeds), India (wheat), Morocco (sheepmeat), Ukraine (wheat) and Mexico (maize). The major losers are temperate product (wheat and sugar) importers Algeria, Taiwan, Saudi Arabia, Indonesia and China. The European Union and Japan gain, in welfare terms, from the further liberalisation under the Escalation scenario from the allocative efficiency gains associated with the reduction in tariffs. The United States, Australia and New Zealand gains from improved market access for temperate products. For the United States the $431 million benefits come from increased exports of maize. For Australia the more modest $16 million gains are in milk concentrates, beef, and sheepmeat. New Zealand gains $7 million, are in the same products, but this gains.
(19) are reduced by losses of $11 million in quota rents. New Zealand has preferential access on exports of these products to the European Union. Table 5 Change in welfare relative to base. European Union United States Japan Australia New Zealand. Standard $m 5624 560 3000 130 210. Escalation $m 5818 991 3205 146 216. Developed Developing Least Developed Total. 9993 4282 -407 13868. 10880 3665 -434 14110. Source: ATPSM simulations. Producer surplus Tariffs are primarily imposed to protect producers, at the expense of consumers, so it is instructive to see how they might suffer when tariffs are reduced. Producer surplus is a measure of producer returns minus costs. Table 6 shows that producers lose globally but some countries gain. The lowly protected producers in Australia and New Zealand gain from higher world prices. Producers in developing countries as a group also gain as the higher world prices raise domestic prices. The benefits of additional liberalisation under the Escalation scenario are minimal. Table 6 Change in producer surplus relative to base. European Union United States Japan Australia New Zealand. Standard $m -29968 -2927 -9715 777 372. Escalation $m -30616 -2769 -9998 819 394. Developed Developing Least Developed Total. -43735 15981 1697 -26057. -44638 16893 1722 -26023. Source: ATPSM simulations.
(20) Conclusions and Implications Some countries at the ongoing WTO negotiations have pressed for additional tariff reductions on processed goods to encourage the development of processing industries in developing countries. Our analysis shows that tariff escalation is indeed a feature in many countries’ bound tariff schedule, particularly in developed countries. It is also a feature when applied rates are examined as countries tend to apply lower rates on primary products than processed products. The tiered general formula cuts being considered in the WTO negotiations would reduce much of the tariff escalation found in countries’ bound tariff schedules.. A. supplemental formula in the form of increasing cuts to processed product tariffs by up to 30 percent (the 1.3 factor), would eliminate much of the remaining escalation. Adding a tariff cap might address the remaining megatariff wedges between primary and processed products, although this depends on the list of products countries shelter from full cuts under the sensitive and special product allowances. Under the assumptions used here, the empirical analysis suggests that the supplemental cuts, if implemented, would have a relatively minor effect on overall global trade and welfare. However, for some processed products where significant tariff escalation remains after imposing the general tariff reduction formula, the supplementary reduction does result in appreciable gains. This is particularly the case for refined sugar, beef, and pigmeat. The gains are limited, however, since many of the products that would benefit from the supplemental cuts have been excluded under the exemptions for sensitive and special products. These exemptions are likely to apply to products with high tariffs, and the products with high tariffs tend to the more processed, such as beef and cheese. There are two limitations of the analysis that should be noted. First, it is not clear which products countries will choose to exempt under the sensitive and special product provisions. The method here is to select sensitive products according to the size of the tariff and special products based on their importance as basic foodstuffs. However, this choice itself has implications for tariff escalation. If a processed product is selected, the supplemental formula is not applied, so nothing is done to address tariff escalation. If a primary product is chosen, as is the case for the basic foodstuffs (wheat, corn and rice), but the processed versions of these products are not also precluded from tariff cuts, then tariff de-escalation could result. Errors in selection could slightly change the overall results but may have more significant impacts on the gains and losses for particular exporters, including Australia and New Zealand..
(21) A further limitation is the coverage of processed products in the ATPSM model. The model was designed to analyse developing country exports, and these products tend to be the less processed products. This feature underestimates the difference between the two scenarios. It also serves to illustrate how difficult it is for negotiators to weigh the costs of negotiating a supplementary formula with all of its parameters and caveats with the benefits that these supplemental cuts will bring. Few models have the ability to measure these benefits and none does a particularly thorough job, as the level of disaggregation this would require goes well beyond the available resources needed. Two other considerations bear mentioning. First, it is important to consider that the model’s elasticities reflect the difficulties that many low-income countries face in capturing the benefits of more open markets. An important part of the Doha Development Agenda is an agreement that WTO members will help these countries overcome their trade-related institutional, human resource and supply capacity constraints. If successful, the combination of trade liberalisation and trade facilitation would be expected to result in larger gains to developing countries than those found in this study. Second, the welfare results are very much a product of the special and differential treatment given to the least developed and developing countries in the form of no or limited tariff cuts. Because most developing countries are not making significant cuts in applied tariffs, reflecting the large gap between their bound and applied tariffs, the ability of these countries to achieve the welfare gains that would result from their own liberalisation is limited..
(22) References Anderson, Kym, Will Martin and Dominique van der Mensbrugghe (2006), "Market and Welfare Implications of Doha Reform Scenarios", in Agricultural Trade Reform and the Doha Development agenda, ed. Kym Anderson and William J. Martin, World Bank 2006, Washington, D.C. ATPSM www.unctad.org/tab. Ben Hammouda, H., Karingi, S.N., Oulmane, N. And Sadni Jallab, M. (2007), "Sensitive Products in Trade Negotiations: The devils are in the number", African Trade Policy Center, UNECA, Addis Ababa. de Gorter, Harry, Ingco, Melinda. and Ignacio, L. (2004b), ‘Domestic Support: Economics and policy instruments’. In Ingco, Melinda. and Nash, John. (eds) Agriculture and the WTO: Creating a Trading System for Development, World Bank, Washington D.C. Delegation of Canada (2006), “Proposed Approach for Addressing Tariff Escalation”, JOB(06)/166, WTO, Geneva, 2 June. Elamin, Nasredin and Hansdeep Khaira (2004), “Tariff Escalation in Agricultural Commodity Markets”, in Commodity Market Review 2003-04, FAO, Rome. FAOSTAT http://faostat.fao.org/default.aspx. Hoekman, Bernard, Francis Ng, and Marcelo Olarreaga (2001), Eliminating Excessive Tariffs on Exports of Least Developed Countries, Policy Research Working Paper 2604, The World Bank, Washington, DC, May. FAOSTAT http://faostat.fao.org/default.aspx. Jean, Sebastian., David Laborde and Will Martin (2006), "Consequences of Alternative Formulas for Agricultural Tariff Cut", in Agricultural Trade Reform and the Doha Development agenda, ed. Kym Anderson and William J. Martin, World Bank 2006, Washington, D.C. Jordbruks Verket (2001), Tariff Escalation for Agricultural and Fishery Products, Swedish Board for Agriculture, Report 2001:12. Lindland, Jostein (1997), The Impact of the Uruguay Round on Tariff Escalation in Agricultural Products, Commodities and Trade Division, ESCP Research paper No. 3, FAO, Rome. Lindland, Jostein (1998), “The impact of the Uruguay Round on tariff escalation in agricultural products”, Food Policy, 2(6): 487-500. OECD (1996), Tariff escalation and the environment, OECD/GD(96) 171, Paris. Peters, Ralf. (2006), ‘Roadblock to Reform: The Persistence of Agricultural Export Subsidies’. UNCTAD, Geneva..
(23) Polaski, Sandra. (2006), "Winners and Losers, Impact of the Doha round on developing countries", Carnegie Endowment for International Peace, Washington, D.C. Sharma, Ramesh (2006), The Doha Round Agricultural Tariff Cutting Formulae and Tariff Escalation, Commodities and Trade Division, FAO, Rome, January. UNCTAD (2003), Back to basics: market access issues in the Doha Agenda, UNCTAD/DITC/TAB/Misc.9, UNCTAD, Geneva. UNCTAD/WTO (2000), The Post-Uruguay Round Tariff Environment for Developing Country Exports: Tariff Peaks and Tariff Escalation, TD/B/COM.1/Rev.1, UNCTAD, Geneva, 28 January. UNCTAD TRAINS database http://www.unctad.org/trains/index.htm. Vanzetti, David and Ralf Peters (2004), User Manual and Handbook on Agricultural Trade Policy Simulation Model, UNCTAD, Geneva. WITS www.wits.worldbank.org.. World Bank (1987), The Uruguay Round: A Handbook on the Multilateral Trade Negotiations,Finger, J. Michael and Andrzej Olechowski (editors), World Bank, Washington, DC. WTO (1996), ‘Doha Ministerial Declaration’ (WT/MIN(01)/DEC/1), Geneva, 20 November. WTO (2003), ‘Negotiations on Agriculture: First Draft of Modalities for the Further Commitments’ (WT/MIN(01)/DEC/1), Geneva, 18 March. WTO (2004), ‘Annex A: Framework for Establishing Modalities in Agriculture’ in Doha Work Programme (WT/L/579), Geneva, 2 August. WTO (2005), ‘Hong Kong Ministerial Declaration’ (WT/MIN(05)/DEC), Geneva, 18 December. WTO (2006a), ‘Chair's Reference Paper, Sensitive Products’ Committee on Agriculture, Special Session, Geneva, 11 May. WTO (2006b), ‘Applied Tariff Simulations – Agriculture Summary of Results’ Committee on Agriculture, Special Session, (JOB(06)/152), Geneva, 22 May. WTO (2006c), ‘Negotiations on Agriculture: Revised Consolidated Reference Paper on Possible Modalities on Market Access’, Committee on Agriculture, Special Session, Geneva, 9 June. WTO (2006d), ‘Draft possible modalities on agriculture’ Committee on Agriculture Special Session, (JOB(06)/199), Geneva, 22 June 2006, revised 12 July and released as (TN/AG/W/3). WTO (2007a), ‘Draft modalities for agriculture’ ( JOB(07)/128), Geneva, 17 July. WTO (2007b), ‘Revised draft modalities for agriculture’, ( TN/AG/W/4 and Corr.1) Geneva, 1 August..
(24) WTO (2008), ‘Tariff Escalation’ (Working Document No. 11), Geneva, 4 January. Yeats, Alexander (1987), “The escalation of tariff barriers,” in Finger, J. Michael and Andrzej Olechowski (editors), The Uruguay Round: A Handbook on the Multilateral Trade Negotiations, World Bank, Washington, DC..
(25) Appendix Table 1: Bound tariff averages and wedges, Developed Countries. Primary Products. Bound Tariff Average. Fresh or chilled carcasses. 112.4. 42.2. Fresh or chilled cuts, bone in. 138.4. 63.1. Fresh or chilled cuts, boneless. 168.1. 52.3 44.2. Frozen carcasses. 122.2. 114.1. Frozen cuts, bone in. 163.9. 49.8. 116.6. Frozen cuts, boneless. 266.0. 149.5. 75.3. Fresh or chilled edible offal. 188.2. 112.8. 76.3. Frozen edible tongues. 135.5. 59.2. 99.8. Frozen edible livers. 407.8. 308.0. 94.3. Frozen edible offal, other. 400.4. 306.0. 45.8. Beef, salted, in brine, dried or smoked. 76.3. 30.5. 83.2. Prepared or preserved beef or offal. 129.0. 45.7. 72.6. Fresh or chilled lamb carcasses. 107.8. 35.2. 76.5. Fresh or chilled sheep carcasses. 127.7. 51.2. 67.4. Fresh or chilled cuts, bone in. 98.3. 30.9. 67.4. Fresh or chilled cuts, boneless. 97.7. 30.3. 72.6. Frozen lamb carcasses. 121.3. 48.7. 76.5. Frozen sheep carcasses. 131.3. 54.8. 74.9. Frozen cuts, bone in. 135.7. 60.8. 76.5. Frozen cuts, boneless. 132.5. 55.9. 90.1. Fresh or chilled carcasses. 168.2. 78.0. 72.1. Fresh or chilled hams, shoulders and cuts, bone in. 163.2. 91.1. 71.9. Fresh or chilled cuts, other, bone in. 123.2. 51.3. 90.1. Frozen carcasses. 187.0. 96.9. Frozen hams, shoulders and cuts, boneless. 242.2. 121.7. 120.6 72.1 Live pure-bred swine, < 50 kg. Frozen cuts, other, boneless. 130.1. 58.0. 178.9. Fresh or chilled edible offal. 358.5. 179.6. 172.0. Frozen edible livers. 234.9. 62.9. 176.3. Frozen edible offal, other Hams, shoulders and cuts, salted, in brine, dried or smoked, bone in Bellies "streaky" and cuts, salted, in brine, dried or smoked. 432.7. 256.5. 125.7. 65.9. 190.7. 87.9. 60.0. Other cuts, salted, in brine, dried or smoked. 111.8. 51.8. 51.1. Hams and cuts, prepared or preserved. 97.7. 46.6. 90.1. Shoulders and cuts, prepared or preserved Other meat and offal, incl. mixtures, prepared or preserved. 169.2. 79.1. 162.3. 71.9. Fresh or chilled carcasses. 168.2. 59.5. 86.9. Fresh or chilled hams, shoulders and cuts, bone in. 163.2. 76.3. 73.3. Fresh or chilled cuts, other, bone in. 123.5. 50.2. 59.8 102.8. 90.4 108.6. Live pure-bred swine, >= 50 kg. Tariff Wedge. 75.4 78.0. Live sheep. Bound Tariff Average. 70.2 115.8. Live bovine animals. Processed Products. 108.6. Frozen carcasses. 187.0. 78.4. 86.9. Frozen hams, shoulders and cuts, boneless. 190.7. 103.8. 73.5. Frozen cuts, other, boneless. 130.4. 56.9. 230.4. Fresh or chilled edible offal. 358.5. 128.1. 172.0. Frozen edible livers. 234.9. 62.9. 209.2. Frozen edible offal, other. 432.7. 223.6.
(26) Primary Products. Bound Tariff Average. 71.3. Other cuts, salted, in brine, dried or smoked. 112.3. 41.0. 58.4. Hams and cuts, prepared or preserved. 103.9. 45.5. 58.4. Shoulders and cuts, prepared or preserved Other meat and offal, incl. mixtures, prepared or preserved. 129.3. 71.0. Fresh grapes Fresh or dried oranges. Fresh or chilled potatoes. Fresh or chilled tomatoes. 126.0. 54.2. 141.7. 70.4. 135.7. 77.3. Dried apples. 36.4. 35.5. Apple juice. 73.1. 50.9. 4.1. Grapefruit juice. 19.9. 15.8. 0.2. Dried grapes. 2.2. 2.1. 13.9. Grape juice. 82.2. 68.3. 5.7. Frozen orange juice. 23.5. 17.9. 6.1. 16.6. 0.8 22.2. Fresh/dried grapefruit. Tariff Wedge. 71.3. 58.4 Fresh apples. Bound Tariff Average. Hams, shoulders and cuts, salted, in brine, dried or smoked, bone in Bellies "streaky" and cuts, salted, in brine, dried or smoked. 71.7 Live pure-bred swine, >= 50 kg, Cont’d. Processed Products. Orange juice, unfrozen. 22.6. 17.5. Frozen potatoes. 26.5. 9.0. 42.2. Flakes, granules and pellets. 71.7. 29.5. 27.7. Potato starch. 132.7. 105.0. 37.3. Frozen potatoes, prepared or preserved. 65.8. 28.5. 14.2. Tomatoes, prepared or preserved, whole or in pieces. 49.2. 35.1. 11.7. Tomatoes, prepared or preserved, ex whole or in pieces. 39.1. 27.4. Tomato juice. 15.4. 13.5. 11.7. Tomato ketchup and sauces. 42.6. 30.9. 0.0. Cocoa paste, excl. defatted. 8.3. 8.3. 0.0. Cocoa paste, wholly or partly defatted. 9.1. 9.1. 0.0. Cocoa butter, fat and oil. 4.1. 4.1. 0.0. Cocoa powder, unsweetened. 8.3. 8.3. 0.1. Cocoa powder, sweetened. 20.0. 19.9. 0.1. 97.7. 97.6. 23.5. 23.4. 0.1. Chocolate and foods with cocoa, > 2 kg Chocolate and foods with cocoa, blocks, <= 2 kg (excl. filled) Chocolate and foods with cocoa, in containers of <= 2 kg. 65.7. 65.6. Coffee, excl. decaffeinated. 0.0. Roasted coffee, excl. decaffeinated. 1.7. Coffee extracts, essences, and concentrates. Decaffeinated coffee. 1.4. Roasted, decaffeinated coffee. 3.0 8.0. Cocoa beans. 1.9. 0.1. Raw beet sugar. Raw cane sugar. Barley. 44.1. 6.4. 6.4. 15.8. 14.1. 6.6. 5.2. Coffee extracts, essences, and concentrates. 15.8. 12.8. Refined cane or beet sugar. 69.5. 61.4. 113.4. 69.3. Cane or beet sugar, other. 3.8. Chewing gum, whether or not sugar coated. 14.2. 10.4. 4.8. Sugar confectionery not containing cocoa. 21.3. 16.5. 22.7. Refined cane or beet sugar. 90.0. 67.2. 60.1. Cane or beet sugar, other. 118.0. 57.9. 3.8. Chewing gum, whether or not sugar coated. 12.5. 8.7. 2.4. Sugar confectionery not containing cocoa. 20.0. 17.6. 71.9. Groats and meal of barley. 134.1. 62.1. 97.9. Pellets of barley. 179.3. 81.3. 67.7. Rolled or flaked grains of barley. 117.0. 49.3. 68.2. Hulled, pearled, sliced, kibbled barley. 142.8. 74.6. 81.4. Malt (excl. roasted). 107.7. 26.3. 84.5. Roasted malt. 104.0. 19.5.
(27) Primary Products. Oats. Durum wheat. Wheat and meslin. Bound Tariff Average. Groundnuts in shell, excl. roasted. Palm nuts and kernels. Rapeseed. Safflowerseed. Soybeans. Sunflowerseed. Bound Tariff Average. Tariff Wedge. 44.3. Groats and meal of oats. 111.3. 67.0. 50.5. Pellets of oats. 120.6. 70.1. 44.8. Rolled or flaked grains of oats. 100.3. 55.5. 46.8. Hulled, pearled, sliced, kibbled oats. 102.5. 55.7. 108.6. Wheat or meslin flour. 167.2. 58.7. 102.2. 80.3. Groats and meal of wheat. 182.4. 91.0. Wheat pellets. 165.0. 74.0. 77.7. Rolled or flaked grains of wheat. 226.8. 149.0. 96.1. Wheat starch. 142.8. 46.6. 1.4. Wheat gluten. 33.8. 32.3. 79.7. Wheat or meslin flour. 142.9. 63.2. 93.0. Groats and meal of wheat. 166.3. 73.2. 88.1. Wheat pellets. 147.3. 59.2. 79.2. Rolled or flaked grains of wheat. 198.5. 119.2. 89.8. Wheat starch. 140.9. 51.1. 3.1. Wheat gluten. 28.4. 25.2. 170.6. 125.9 37.4. 44.7 Cottonseed. Processed Products. Cottonseed meal. 0.2. Crude cottonseed oil. 37.6. 0.6. Cottonseed oil, excl. crude. 31.6. 31.1. 68.4. Shelled ground-nuts, excl. roasted. 275.4. 207.0. 42.1. Groundnut meal. 146.1. 104.1. 5.0. Crude groundnut oil. 46.1. 41.1. 5.2. Groundnut oil, excl. crude. 46.0. 40.8. 11.7. Groundnuts, prepared or preserved. 51.1. 39.3. 33.5. Palm kernel meal. 128.3. 94.8. 19.6. Crude palm oil. 79.2. 59.5. 27.2. Palm oil, excl. crude. 69.9. 42.6. 41.2. Rapeseed meal. 146.1. 105.0. 11.6. Crude rape, colza or mustard oil. 51.7. 40.1. 12.2. Rape, colza or mustard oil, excl. crude. 55.6. 43.4. 37.4. Safflowerseed meal. 117.2. 79.8. 9.3. Crude safflower oil. 44.0. 34.7. 9.1. Safflower oil, excl. crude. 49.0. 39.8. 15.7. Soybean flour and meal. 75.7. 60.0. 12.1. Crude soybean oil, whether or not degummed. 51.6. 39.6. 11.1. Soybean oil, excl. crude. 52.3. 41.2. 36.1. Sunflowerseed meal. 117.2. 81.1. 10.6. Crude sunflowerseed oil. 45.7. 35.1. 11.3. Sunflower oil, excl. crude. 50.6. 39.2.
(28) Appendix Table 1, cont’d: Bound tariff averages and tariff wedges, Developing Countries. Primary Products. Live bovine animals. Live sheep. Live pure-bred swine, < 50 kg. Bound Tariff Average. Bound Tariff Average. Tariff Wedge. 33.7. Fresh or chilled carcasses. 65.5. 31.9. 33.6. Fresh or chilled cuts, bone in. 65.3. 31.8. 32.3. Fresh or chilled cuts, boneless. 72.1. 39.8. 32.1. Frozen carcasses. 62.4. 30.3. 32.0. Frozen cuts, bone in. 62.2. 30.2. 31.1. Frozen cuts, boneless. 69.3. 38.3. 29.9. Fresh or chilled edible offal. 59.7. 29.8. 24.4. Frozen edible tongues. 54.1. 29.7. 27.1. Frozen edible livers. 55.6. 28.6. 21.4. Frozen edible offal, other. 50.5. 29.1. 31.6. Beef, salted, in brine, dried or smoked. 61.6. 29.9. 30.8. Prepared or preserved beef or offal. 59.6. 28.8. 19.8. Fresh or chilled lamb carcasses. 64.8. 45.0. 19.8. Fresh or chilled sheep carcasses. 64.0. 44.2. 19.8. Fresh or chilled cuts, bone in. 61.7. 41.9. 19.8. Fresh or chilled cuts, boneless. 62.0. 42.1. 19.8. Frozen lamb carcasses. 65.0. 45.2. 20.2. Frozen sheep carcasses. 65.6. 45.5. 20.2. Frozen cuts, bone in. 62.0. 41.9. 19.8. Frozen cuts, boneless. 62.1. 42.3. 32.2. Fresh or chilled carcasses. 76.4. 44.2. 31.0. Fresh or chilled hams, shoulders and cuts, bone in. 76.3. 45.2. 31.3. Fresh or chilled cuts, other, bone in. 74.7. 43.4. 32.3. Frozen carcasses. 77.2. 44.9. 31.0. Frozen hams, shoulders and cuts, boneless. 74.8. 43.8. 32.3. Frozen cuts, other, boneless. 76.5. 44.2. 21.6. Fresh or chilled edible offal. 67.3. 45.6. 24.3. Frozen edible livers. 63.8. 39.6. 24.0. 62.2. 38.3. 76.3. 45.2. 32.2. Frozen edible offal, other Hams, shoulders and cuts, salted, in brine, dried or smoked, bone in Bellies "streaky" and cuts, salted, in brine, dried or smoked. 72.4. 40.2. 29.5. Other cuts, salted, in brine, dried or smoked. 68.9. 39.4. 34.3. Hams and cuts, prepared or preserved. 73.3. 39.0. 35.5. Shoulders and cuts, prepared or preserved Other meat and offal, incl. mixtures, prepared or preserved. 70.0. 34.5. 72.9. 35.7. Fresh or chilled carcasses. 76.2. 42.3. 86.9. Fresh or chilled hams, shoulders and cuts, bone in. 75.1. 42.3. 73.3. Fresh or chilled cuts, other, bone in. 74.5. 41.5. Frozen carcasses. 76.0. 42.4. 86.9. Frozen hams, shoulders and cuts, boneless. 74.8. 42.5. 73.5. Frozen cuts, other, boneless. 76.5. 43.0. 230.4. Fresh or chilled edible offal. 68.4. 45.9. 172.0. Frozen edible livers. 64.7. 39.2. 209.2. Frozen edible offal, other. 63.0. 38.0. 31.0. 37.2 108.6. Live pure-bred swine, >= 50 kg. Processed Products. 108.6.
(29) Primary Products. Bound Tariff Average. Processed Products. Bound Tariff Average. Tariff Wedge. 33.7. Hams, shoulders and cuts, salted, in brine, dried or smoked, bone in Bellies "streaky" and cuts, salted, in brine, dried or smoked. 31.0. Other cuts, salted, in brine, dried or smoked. 68.7. 37.7. 35.8. Hams and cuts, prepared or preserved. 73.2. 37.4. 36.9. 69.7. 32.8. 38.6. Shoulders and cuts, prepared or preserved Other meat and offal, incl. mixtures, prepared or preserved. 72.7. 34.1. 17.0. Dried apples. 41.6. 24.6. 22.1. Apple juice. 52.4. 30.3. 26.5. Grapefruit juice. 53.0. 26.5. 18.1. Dried grapes. 46.7. 28.6. 25.1. Grape juice. 61.5. 36.4. 29.9. Frozen orange juice. 60.1. 30.3. 26.2. Orange juice, unfrozen. 54.2. 28.0. 41.0. Frozen potatoes. 66.3. 25.2. 30.5. Flakes, granules and pellets. 86.6. 56.0. 46.4. Potato starch. 85.0. 38.6. 20.8. Frozen potatoes, prepared or preserved. 64.1. 43.3. 31.6. Tomatoes, prepared or preserved, whole or in pieces. 56.6. 25.1. 31.5. Tomatoes, prepared or preserved, ex whole or in pieces. 57.7. 26.2. 33.3. Tomato juice. 61.1. 27.7. 33.6. Tomato ketchup and sauces. 47.9. 14.4. 16.7. Cocoa paste, excl. defatted. 34.5. 17.8. 15.8. Cocoa paste, wholly or partly defatted. 37.3. 21.5. 17.7. Cocoa butter, fat and oil. 28.1. 10.4. 23.8. Cocoa powder, unsweetened. 38.7. 14.9. 20.8. Cocoa powder, sweetened. 43.0. 22.2. 20.8. 42.3. 21.6. 51.3. 24.7. 26.0. Chocolate and foods with cocoa, > 2 kg Chocolate and foods with cocoa, blocks, <= 2 kg (excl. filled) Chocolate and foods with cocoa, in containers of <= 2 kg. 56.8. 30.8. Coffee, excl. decaffeinated. 43.3. Roasted coffee, excl. decaffeinated. 66.6. 23.3. 25.0. Coffee extracts, essences, and concentrates. 50.9. 25.9. Decaffeinated coffee. 38.0. Roasted, decaffeinated coffee. 58.2. 20.2. 20.2. Coffee extracts, essences, and concentrates. 43.8. 23.6. Refined cane or beet sugar. 30.9. 23.4. Cane or beet sugar, other. 47.9. 29.1. 9.2. Chewing gum, whether or not sugar coated. 51.5. 42.3. 9.4. Sugar confectionery not containing cocoa. 46.2. 36.8. 10.8. Refined cane or beet sugar. 26.1. 15.3. 18.9. 33.1 Live pure-bred swine, >= 50 kg, Cont’d. Fresh apples Fresh/dried grapefruit Fresh grapes Fresh or dried oranges. Fresh or chilled potatoes. Fresh or chilled tomatoes. Cocoa beans. 26.6. 7.5 Raw beet sugar. Raw cane sugar. Barley. 18.8. 76.3. 43.2. 72.3. 38.6. Cane or beet sugar, other. 37.9. 18.9. 9.5. Chewing gum, whether or not sugar coated. 39.8. 30.3. 9.6. Sugar confectionery not containing cocoa. 37.2. 27.6. 37.2. Groats and meal of barley. 79.3. 42.1. 26.2. Pellets of barley. 52.7. 26.6. 22.1. Rolled or flaked grains of barley. 47.2. 25.1. 22.7. Hulled, pearled, sliced, kibbled barley. 50.4. 27.6. 24.6. Malt (excl. roasted). 47.7. 23.0. 24.5. Roasted malt. 48.0. 23.5.
(30) Primary Products. Oats. Durum wheat. Wheat and meslin. Cottonseed. Groundnuts in shell, excl. roasted. Palm nuts and kernels. Rapeseed. Safflowerseed. Soybeans. Sunflowerseed. Bound Tariff Average. Processed Products. Bound Tariff Average. Tariff Wedge. 24.4. Groats and meal of oats. 73.3. 48.8. 33.5. Pellets of oats. 85.4. 51.9. 23.4. Rolled or flaked grains of oats. 79.7. 56.3. 21.8. Hulled, pearled, sliced, kibbled oats. 68.5. 46.7. 31.8. Wheat or meslin flour. 76.4. 44.7. 24.0. Groats and meal of wheat. 76.3. 52.3. 23.0. Wheat pellets. 73.2. 50.1. 20.6. Rolled or flaked grains of wheat. 82.4. 61.8. 20.3. Wheat starch. 62.1. 41.8. 17.5. Wheat gluten. 57.7. 40.3. 32.9. Wheat or meslin flour. 73.9. 40.9. 25.3. Groats and meal of wheat. 72.9. 47.7. 24.6. Wheat pellets. 71.6. 47.1. 22.2. Rolled or flaked grains of wheat. 80.2. 58.0. 21.5. Wheat starch. 60.2. 38.7. 20.0. Wheat gluten. 59.3. 39.3. 21.7. Cottonseed meal. 53.5. 31.8. 46.2. Crude cottonseed oil. 95.9. 49.6. 44.9. Cottonseed oil, excl. crude. 94.6. 49.7. 23.8. Shelled ground-nuts, excl. roasted. 41.5. 17.7. 58.3. Groundnut meal. 105.4. 47.1. 52.0. Crude groundnut oil. 93.1. 41.1. 52.0. Groundnut oil, excl. crude. 94.1. 42.0. 26.6. Groundnuts, prepared or preserved. 62.1. 35.5. 18.0. Palm kernel meal. 45.9. 27.9. 40.8. Crude palm oil. 90.5. 49.8. 40.0. Palm oil, excl. crude. 88.8. 48.8. 19.4. Rapeseed meal. 48.1. 28.7. 35.6. Crude rape, colza or mustard oil. 72.9. 37.2. 32.9. Rape, colza or mustard oil, excl. crude. 68.4. 35.5. 20.5. Safflowerseed meal. 47.6. 27.1. 41.9. Crude safflower oil. 82.1. 40.2. 39.5. Safflower oil, excl. crude. 80.7. 41.3. 18.2. Soybean flour and meal. 58.3. 40.1. 29.6. Crude soybean oil, whether or not degummed. 69.5. 39.9. 28.8. Soybean oil, excl. crude. 66.5. 37.8. 23.7. Sunflowerseed meal. 55.5. 31.9. 43.7. Crude sunflowerseed oil. 89.2. 45.5. 40.9. Sunflower oil, excl. crude. 86.8. 45.9.
(31) Appendix Table 2: Tariff averages and wedges after imposing the low and high option tariff cuts, Developed Countries. Primary Products Live bovine animals. Live sheep. Live pure-bred swine, < 50 kg. Tariff averages Low High Cut Cut 24.0 19.0 25.8 20.3 39.5 31.3 26.7 21.1 38.9 30.8 39.8 31.5 25.8 20.3 26.0 20.6 33.9 26.9 32.2 25.5 15.6 12.4 28.4 22.5 25.1 19.6 26.3 20.7 23.4 18.2 23.4 18.2 25.1 19.6 26.3 20.7 25.8 20.2 26.3 20.7. Processed Products Fresh or chilled carcasses Fresh or chilled cuts, bone in Fresh or chilled cuts, boneless Frozen carcasses Frozen cuts, bone in Frozen cuts, boneless Fresh or chilled edible offal Frozen edible tongues Frozen edible livers Frozen edible offal, other Beef, salted, in brine, dried or smoked Prepared or preserved beef or offal Fresh or chilled lamb carcasses Fresh or chilled sheep carcasses Fresh or chilled cuts, bone in Fresh or chilled cuts, boneless Frozen lamb carcasses Frozen sheep carcasses Frozen cuts, bone in Frozen cuts, boneless. Low Cut 39.9 48.7 58.6 43.2 57.1 91.9 65.4 47.6 139.8 137.3 27.7 44.9 37.2 43.6 34.2 33.8 41.9 44.8 46.4 45.1. Tariff averages High Low Cut Cut + 30.3 28.5 37.4 30.2 45.4 43.4 33.0 31.2 44.3 42.7 71.8 47.3 50.8 37.2 36.6 29.2 110.1 67.4 108.1 64.1 20.6 20.1 34.8 30.9 29.1 26.3 34.5 27.3 26.5 25.0 26.4 24.8 32.8 26.6 35.5 27.6 36.7 26.9 35.8 27.3. 58.3 56.8 42.9 65.2 83.3 45.3 122.5 81.0 147.1. 45.4 44.1 33.3 50.5 65.4 35.1 96.8 63.4 116.8. 43.5. Tariff wedges High Low Cut Cut + 11.4 4.5 17.0 4.4 14.1 3.8 11.9 4.5 13.5 3.8 40.4 7.5 30.5 11.4 16.0 3.2 83.1 33.5 82.6 31.8 8.2 4.5 12.4 2.5 9.5 1.2 13.8 1.1 8.3 1.6 8.2 1.4 13.2 1.5 14.8 1.3 16.4 1.1 15.1 1.1. High Cut + 19.8 21.2 31.9 21.9 31.5 32.2 21.5 21.0 32.1 31.1 13.2 22.8 19.9 21.0 18.6 18.6 20.0 21.1 20.6 21.0. Bound 42.2 63.1 52.3 44.2 49.8 149.5 112.8 59.2 308.0 306.0 30.5 45.7 35.2 51.2 30.9 30.3 48.7 54.8 60.8 55.9. Low Cut 15.8 22.9 19.1 16.5 18.2 52.1 39.6 21.7 105.9 105.0 12.1 16.5 12.1 17.3 10.8 10.4 16.8 18.5 20.6 18.8. High Cut + 0.8 0.8 0.7 0.8 0.7 0.7 1.2 0.4 5.2 5.7 0.8 0.4 0.3 0.3 0.4 0.4 0.4 0.4 0.3 0.3. 38.4 32.5 29.3 41.6 48.7 29.7 72.1 60.9 82.6. 26.3 21.5 20.4 27.2 34.6 20.7 51.8 46.8 55.1. 78.0 91.1 51.3 96.9 121.7 58.0 179.6 62.9 256.5. 27.0 31.6 17.9 33.8 41.8 20.2 61.3 22.5 86.4. 21.1 24.6 13.9 26.2 32.8 15.7 48.5 17.0 69.2. 7.1 7.4 4.3 10.2 7.2 4.6 10.9 2.4 21.9. 2.0 2.0 1.0 2.9 2.1 1.2 3.5 0.3 7.5. 34.0. 27.6. 18.2. 65.9. 22.8. 17.8. 6.8. 2.1. 31.4 25.1 25.0 31.4 41.5 25.1 61.2 58.5 60.7. 24.3 19.5 19.4 24.3 32.6 19.5 48.3 46.4 47.6. 20.8. 16.1. 35.3. 27.8. Fresh or chilled carcasses Fresh or chilled hams, shoulders and cuts, bone in Fresh or chilled cuts, other, bone in Frozen carcasses Frozen hams, shoulders and cuts, boneless Frozen cuts, other, boneless Fresh or chilled edible offal Frozen edible livers Frozen edible offal, other Hams, shoulders and cuts, salted, in brine, dried or smoked, bone in Bellies "streaky" and cuts, salted, in brine, dried or smoked. 65.5. 51.5. 42.7. 30.1. 87.9. 30.2. 23.8. 7.5. 2.3. 20.9. 16.2. Other cuts, salted, in brine, dried or smoked. 38.7. 30.2. 25.6. 17.6. 51.8. 17.9. 14.0. 4.7. 1.4. 17.7. 13.8. Hams and cuts, prepared or preserved. 34.7. 26.4. 22.7. 14.9. 46.6. 17.0. 12.6. 4.9. 1.1.
(32) Live pure-bred swine, >= 50 kg, Cont’d. Fresh apples Fresh/dried grapefruit Fresh grapes Fresh or dried oranges Fresh or chilled potatoes. Fresh or chilled tomatoes. 30.9. 24.3. 58.6. 45.7. 35.4. 25.4. 79.1. 27.6. 21.4. 4.5. 1.1. 24.4. Shoulders and cuts, prepared or preserved Other meat and offal, incl. mixtures, prepared or preserved. 31.1. 56.5. 43.8. 36.2. 25.6. 71.9. 25.4. 19.4. 5.1. 1.2. 37.6. 29.3. Fresh or chilled carcasses. 58.3. 45.4. 41.7. 30.4. 59.5. 20.8. 16.1. 4.1. 1.1. 30.1. 23.5. Fresh or chilled hams, shoulders and cuts, bone in. 56.8. 44.1. 34.3. 24.6. 76.3. 26.7. 20.6. 4.2. 1.1. 25.5. 19.8. Fresh or chilled cuts, other, bone in. 43.0. 33.4. 29.4. 20.8. 50.2. 17.5. 13.6. 3.9. 1.0. 37.6. 29.3. Frozen carcasses. 65.2. 50.5. 43.3. 30.9. 78.4. 27.6. 21.2. 5.8. 1.5. 30.1. 23.5. Frozen hams, shoulders and cuts, boneless. 65.9. 51.5. 34.9. 24.8. 103.8. 35.9. 28.0. 4.9. 1.3. 25.6. 19.8. Frozen cuts, other, boneless. 45.4. 35.2. 30.0. 21.0. 56.9. 19.8. 15.4. 4.3. 1.2. 78.5. 62.2. Fresh or chilled edible offal. 122.5. 96.8. 84.6. 64.0. 128.1. 43.9. 34.6. 6.0. 1.8. 58.5. 46.4. Frozen edible livers. 71.5. 56.5. 24.7. 19.4. 24.6 24.5 20.2 20.2. 19.3 19.2 15.8 15.8. 20.2 0.4 8.6. 15.8 0.2 6.0. Frozen edible offal, other Hams, shoulders and cuts, salted, in brine, dried or smoked, bone in Bellies "streaky" and cuts, salted, in brine, dried or smoked Other cuts, salted, in brine, dried or smoked Hams and cuts, prepared or preserved Shoulders and cuts, prepared or preserved Other meat and offal, incl. mixtures, prepared or preserved Dried apples Apple juice. 2.1 0.1 6.1. 1.1 0.1 3.8. 2.8 3.0. 1.5 1.6. 6.5 14.8 10.0 13.2. 4.7 11.4 7.5 10.1. 5.3. 3.8. 81.0. 63.4. 60.9. 46.8. 62.9. 22.5. 17.0. 2.4. 0.3. 147.1. 116.8. 82.6. 60.2. 223.6. 75.6. 60.4. 11.1. 3.8. 43.6. 34.0. 28.6. 20.5. 54.2. 18.9. 14.7. 3.9. 1.1. 49.0 38.9 36.7 45.1. 38.3 30.3 28.1 34.9. 29.4 27.5 24.0 24.0. 20.7 20.0 16.6 16.7. 70.4 41.0 45.5 71.0. 24.4 14.4 16.6 24.9. 19.0 11.1 12.3 19.2. 4.9 3.0 3.8 3.9. 1.5 0.8 0.8 0.9. 47.6 13.3 26.8. 36.7 9.8 19.7. 24.8 6.4 14.9. 16.8 2.0 7.7. 77.3 35.5 50.9. 27.4 12.8 18.2. 20.9 9.6 13.7. 4.6 5.9 6.3. 1.1 1.7 1.7. Grapefruit juice Dried grapes Grape juice. 8.9 1.2 29.9. 5.4 0.6 22.2. 5.7 0.8 15.3. 1.6 0.1 6.0. 15.8 2.1 68.3. 6.8 1.1 23.8. 4.3 0.5 18.4. 3.6 0.8 9.2. 0.5 0.0 2.3. Frozen orange juice Orange juice, unfrozen. 10.7 9.9. 6.4 6.1. 7.2 6.5. 2.1 2.0. 17.9 16.6. 7.9 7.0. 4.8 4.5. 4.3 3.5. 0.5 0.4. Frozen potatoes Flakes, granules and pellets Potato starch Frozen potatoes, prepared or preserved. 10.6 26.1 46.6 23.7. 7.2 19.4 35.8 17.8. 8.3 17.4 20.7 15.2. 4.8 11.5 9.5 10.1. 9.0 29.5 105.0 28.5. 4.1 11.3 36.5 10.5. 2.4 8.0 28.4 7.7. 1.7 2.5 10.7 2.0. 0.1 0.1 2.0 0.1. Tomatoes, prepared or preserved, whole or in pieces. 18.4. 13.3. 10.3. 4.8. 35.1. 13.1. 9.5. 5.0. 1.0. 32.
Figure
+2
Related documents
European Community is still deeply involved in a number of these sectors.. Investments aimed at increasing. the productivity of labour in these sectors only
To evaluate the effect of a small sample size and ignoring measure- ment error, we derive finite sample properties of the OLS estimator with noise using the Edgeworth expansion,
Comparatively, results shown in table 3.1 and 3.2 on compaction test parameters indicated increased values of maximum dry density (MDD) and optimum moisture
The key findings on cataract surgery practice pattern among eye surgeons working at MOH hospitals from 2002 to 2011 were the conversion of surgical technique from ECCE to
Artificial neural networks in bankruptcy prediction: General framework and cross-validation analysis
Table 1 gives the results for the eect of hidden nodes on overall classi®cation performance for both training and small test sets across ®ve sub- samples.. In general, as expected,
ADELSYSTEM bouwt uiterst doordachte voedingen en omvormers voor de industriële markt, waarbij alle types geschikt zijn voor
However, upon reviewing his claim, CommInsure’s Claims team discovered that his medical records actually reflected that Angelo had also suffered a heart attack (as defined in his
Conventional culture tubes were used in a modification of the spin-amplified adsorption procedure for recovery of herpes simplex virus (HSV) from clinical specimens.. Cytopathic
