Asset/Liability Management
Benchmark Study*
Analysis of a PwC Banking Survey 2006
00 Highlights ... 9
01 General information ... 1
02 ALM and ALCO structures ... 15
0 Policies and responsibilities ... 21
04 Methodologies ... 1
05 Limits framework ... 9
06 Hedging decisions ... 4
07 Transfer prices ... 47
08 Reporting structure ... 51
09 Systems and operational controls ... 55
10 Impact of IFRS ... 61
5
The financial services industry faces many new challenges: shareholders continuously ask for better performance and transparency, regulators enforce new and complex regulations, senior managers put pressure on staff to be more efficient, and with mergers and acquisitions expected to increase in the forthcoming years, this too brings challenge and opportunity. In this changing environment, asset and liability managers need to understand the drivers of their business in the future and to organise themselves accordingly. New regulations such as Basel II and complex accounting standards (e.g. IAS 2/9, IFRS 7) impact ALM organisations, processes and systems. Banks need to identify the impact and develop appropriate new solutions.
As a leading partner of the financial services industry, PricewaterhouseCoopers has taken the initiative to conduct this survey, as we believe that the time has come for banks to benchmark their current ALM organisations and practices.
An overview of ALM in Europe
The objective of this survey was to provide the industry with an overview of ALM organisation and practices at European banks. The results of the survey are intended to assist financial institutions by providing peer benchmarks of industry practices. This allows the identification of areas for improvement and will help asset and liability managers to prepare for the future.
60 European banks participated
The survey was carried out in the summer of 2006 in parallel with a survey of Asian and Australian banks. In Europe, 60 banks based in 14 countries took part.
Scope of survey
The survey was designed to cover both qualitative and quantitative aspects of ALM approaches which are currently in place. This report has been organised around the ALM-related subject matter areas that were the basis of the survey questionnaire, covering:
ALM and Asset and Liability Management Committee (ALCO) structures Policies, objectives and responsibilities
Methodologies Limits framework Hedging decisions Funds transfer pricing Reporting
Systems and Controls
Impact of new accounting standards (IFRS) Basel II. ■ ■ ■ ■ ■ ■ ■ ■ ■ ■
6
Survey methodology
Each section of this report includes an analysis of the survey results and a discussion of the underlying issues. Tables and charts are presented to help the reader quickly ascertain the main findings and issues associated with each topic and to assist in the benchmarking of the respective institution’s practices.
In order to display the results of the ALM study effectively, PricewaterhouseCoopers designed a survey methodology that strived to achieve an appropriate balance between:
Promoting maximum participation among institutions by using data templates that required firms to report their actual practices;
Ensuring soundness, integrity and comparability of the survey to display results based on the actual data reported by participants; and
Protecting confidentiality of participating institution’s responses while providing maximum insight into the detailed parameters needed for analysing ALM.
The methodology used was a web-based questionnaire.
Survey confidentiality
The survey results are distributed on a no-name basis. Each institution’s individual results have been kept strictly confidential and peer responses have been presented in a way that will not allow an identification of any specific institution based on its submitted data. The results are based solely on survey responses as provided by each participant to PricewaterhouseCoopers. We have not subjected the data contained herein to audit, review or compilation procedures or any other testing to validate the accuracy or reasonableness of the data provided by the participating organisations.
A word of thanks
We acknowledge that the highly detailed nature of the survey questionnaire required a considerable amount of effort on the part of each participating institution to provide commensurately detailed and meaningful responses. We would like to extend our thanks to those institutions for participating in this study, which we consider to be ground-breaking for the breath and depth of its qualitative and quantitative coverage of ALM topics across business segments.
We trust that you will find the survey results insightful and hope that they serve as a catalyst for discussion and action within your financial institution.
If you have any comment or question regarding this PricewaterhouseCoopers survey, or would like to request additional copies, please contact:
Rami Feghali Partner
+ 1 56 57 71 27
e-mail: [email protected]
or the contact person for your territory as listed on page 71.
■
■
■
We thank Didier Michoud, for his helpful comments and valuable contribution to this study
9
Highlights
Executive summary
60 European banks from 14 countries covering 18 large institutions and 42 smaller institutions participated in the survey. The survey
examined in detail all the dimensions of an ALM framework (from organisation, policy and methodology to systems and controls) as well as related regulatory and accounting issues (IFRS, Basel II).
This survey provides unique factual information on every piece of an ALM framework in a very large panel of banks and we refer the reader to the main body of this document.
When analysing the results, we identified 4 key areas on the current state of ALM in Europe. These are as follows:
1. The basic components of an ALM framework such as ALCO, ALM policies, basic measurement methodologies and system functionalities are in place for most institutions. European markets are mature and banks have been used to managing ALM risks for a long time. It is therefore not surprising to see that appropriate frameworks have generally been implemented.
2. We think that there are still opportunities to improve the ALM framework and achieve revenue growth. We believe in particular that the most considerable improvement potential is in the measurement of risks. The ongoing efforts of leading institutions in continuously enhancing dynamic risk modelling solutions can truly help in the generation of a sustainable increase in net interest income.
. Looking at the results of the survey we found that there are still, in many banks, gaps against the Basel Committee
requirements. The Basel Committee issued the ‘Principles for the Management and Supervision of Interest Rate Risk’ in July 2004 to support the Pillar 2 approach on interest rate risk of Basel II. These principles
form the basis of a sound framework for the management of interest rate risk. Gaps were identified at the level of methodologies, governance and policies, controls and review of internal audit, as well as reporting. 4. When analysing the results of this survey, it
became clear that the size of the institution has a significant influence on the practices in ALM. Generally, large banks are better organised, use more sophisticated
methodologies and IT systems, and allocate relatively more resources to ALM. A key area of differentiation is methodologies; principally the large banks have developed and implemented models for embedded prepayment options, funds transfer pricing, dynamic simulations and stress testing. Consequently these banks have a better assessment of both their risks and their opportunities. Institutions with such advanced solutions have a clear competitive advantage and are in a better position to enhance the return on their business. We present hereafter some interesting findings of each section of the survey.
ALM and ALCO structures
Virtually all banks have a dedicated ALM function led by an ALCO. ALM generally fits into the finance, treasury or risk management functions. The ubiquitous nature of the ALM activity results in a wide variety of diverse organisational models, as confirmed by the survey.
ALCO in large banks are generally more focused on ‘core’ ALM risks (including inflation risk, interest rate risk of insurance businesses…) than smaller banks, which tend to analyse other types of risks as well (credit risk, operational risk etc.).
Smaller banks are also more position-taking oriented than larger banks, and often the treasury has an important role in managing the ALM position. Interestingly, as many as 70% of medium and small banks stated that their ALM units are organised as profit centres. Only 28% of large banks have adopted this approach for their ALM unit.
10
Policies and responsibilities
Many banks are currently working on enhancing compliance with the
recommendations of the Basel Committee. When analysing the results of the survey, we identified potential for improvements, for example in the following areas:
Further promotion of the involvement of the board of directors and senior management Advancement of ALM policies to cover additional risk factors (e.g. inflation, credit risk) and additional processes (e.g. new products approval, stress testing). ALM units are assigned multiple
responsibilities that could also be held by other units such as the risk management unit (e.g. measurement and reporting on risk) or the treasury unit. We believe that it is important to define clearly the respective responsibilities of the different parties acting in ALM to avoid duplication of tasks and to ensure both independence and completeness of the tasks and controls.
Methodology
Participants reported that there is still a greater focus on classical re-pricing gap methodologies compared to more sophisticated simulation techniques. In many instances, there is still room to enhance existing measurement methodologies with regards to basis risk, embedded optionalities, use of probabilistic models and other
aspects.
Similarly, validation and assessments of the limits of risk models have been developed which enable ALM models to be assessed for effectiveness in different market
circumstances. Banks, however, report that there is still scope for improvement in back testing and stress testing. This is particularly relevant for the stress testing of the main assumptions made for the models. The survey outlines that most large banks dedicate proportionally more resources to develop their ALM capabilities than smaller institutions.
■
■
We also noted that statistical measures related to value at risk or economic capital are increasingly popular among financial institutions for ALM purposes.
Limits
Nearly all banks have limits in place for the management of interest rate risk and liquidity risk. Surprisingly, only 72% of medium and small banks claim that their limits cover all entities with material liquidity risks (versus 94% of large banks).
A number of methods are used to measure interest rate risk. However, only a small set of calculated indicators have attributed limits and the choice of these indicators differs greatly from bank to bank. Limits are generally set on static indicators.
Hedging
The survey showed that governance around limit breaches and other trigger points is well developed. The banks have established processes with appropriate formal actions being taken should these events occur. Non-linear financial instruments such as caps, floors and swaptions are used more often for hedging by large banks than by medium and smaller institutions. Furthermore, inflation-linked instruments become
increasingly popular as hedging instruments among the leading banks.
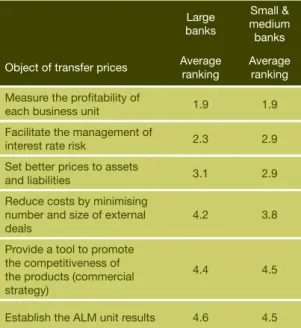
Funds transfer pricing (FTP)
FTP frameworks are in place in nearly all institutions. The solutions allow the pricing of the major components of risk, but
interestingly some key price components are not always present. For instance prepayment risk is taken into account by half of the large banks and only 26% of small and medium banks.
A majority of the large banks use the ‘matched fund’ method to price their products, i.e. a differentiated transfer rate is assigned to each source and use of funds at the time of origination. Most medium and small banks tend to use simpler methods for
11
pricing and measuring their profitability which are often based on a standardised transfer rate for all products and maturities.
Reporting
We observed considerable potential for enhancing liquidity and interest rate risk reporting in areas such as:
type of measures reported;
distribution of the reports in particular to the board and senior management; and
independence of the unit that prepares the reports from the position-taking function. Typically the liquidity and interest risk reporting can be augmented to address the key information that would enable the board and senior management to understand fully the nature of the interest risk exposure and how the ALM framework performs. For instance, only 44% of the large banks and 27% of the smaller banks report their back-testing results, and no bank reports key assumptions used in measurement methodologies.
IT and control
In the European market, one system, Bancware from Sungard, is used by a significant fraction of the banks participating in the survey (24% of the large banks and 16% of the smaller banks). Other relatively popular systems are QRM and IPS-Sendero. The rest of the ALM systems landscape is highly fragmented. Notably, 24% of large banks and 20% of smaller banks have developed their own internal system to cover at least part of their needs.
Basic modelling capabilities are supported by the vast majority of systems used in the industry. It is worth mentioning that the challenges reported by medium and small banks in their development of measurement methodologies are mirrored in the capabilities of their systems (no treatment of embedded options, no dynamic simulations, etc.). Many respondents report that they are aware of the missing functionalities of their current systems and plan to upgrade these in the near future.
■ ■
■
A significant portion of respondents (21% of large banks and 1% of smaller banks) do not validate their data with the accounting figures.
18% of large banks and 25% of medium and small banks report that they do not have procedures for regular examination of the ALM activity by internal audit. Survey participants also reported that there is still effort required to ensure that all dimensions of ALM recommended by the Basel Committee are subject to internal auditing.
IFRS
The survey shows that the impact of IAS 9 on the hedging strategies is significant. 46% of the large banks and 6% of the medium and small banks report that IAS 9 caused them to change their hedging strategies. The implementation of IAS 9 has proved to be challenging and resource consuming and is still not satisfactorily completed at the level of Information Technology.
Basel II
At the time of the survey, compliance with the principles of the Basel Committee documents has been assessed by all large banks and 69% of medium and small banks. A relatively low number of European banks expect significant impacts from the Basel II requirements on interest rate risk management. This result is somewhat contradictory with many of the findings of the survey. It may be explained by the fact that interest risk in the banking book is part of Pillar 2 of the Basel reform, and that many banks have so far focused on implementing Pillar 1 and have just started to work on Pillar 2.
The survey shows that 94% of the large banks calculate economic capital for interest rate risk while 51% of the medium and small banks are doing so. A negligible number of banks calculate economic capital on liquidity risks.
1
General information
This survey was conducted in the summer of 2006 in Europe, Asia and Australia. This report presents the results for European banks. Separate reports present the results of the other regions.
60 European banks based in 14 countries participated in the survey1 (see Figure 1.1).
Often, ALM organisation and practices depend on the size of the banks.
In order to facilitate comparison and the analysis of the results we divided the participating banks into two groups: a group of medium and small banks (hereafter ‘m/s banks’) and a group of large banks. European large banks are those that are included in Europe’s TOP25 by capitalisation or Tier 1 Capital. The 60 European banks split into 18 large European banks and 42 m/s European banks.
Figure 1.1 – Country of origin of the participating banks 'ERM ANY 3WITZ ERLAN D !USTR IA
3PAIN4URKEY&RANCE )TA LY ,UXE MBO URG 0OLAN D 5+ "ELGI UM 3WED EN $ENM ARK .ETH ERLAN DS
As expected, a majority of large banks (89%) view themselves as being active in international markets, while only 6% of the m/s banks do so.
Most of the banks offer a variety of services, Figure 1.2 giving an overview of the activities of the participating banks. Large banks are generally active in a large range of services while m/s banks are generally more specialised.
Figure 1.2. – Type of services provided by the participating banks (the category ‘Other’ includes, among others, custody services, public finance, leasing & factoring, acting as a central bank) ,ARGEBANKS 3MALLMEDIUMBANKS 2ETAILBANKING #ORPORATEBANKING 0RIVATEBANKING !SSETMANAGEMENT )NVESTMENTBANKING 0RIVATEEQUITY 3ECURITIESSERVICES 2EALESTATE )NSURANCE /THER
1 For reasons of confidentiality we do not break down the banks into large and m/s banks by nation of origin.
15
ALM and ALCO
structures
This section describes the way ALM is organised in the surveyed institutions: organisational structure, composition of the ALM unit and the ALCO, level of centralisation of ALM. ALM can potentially have objectives and responsibilities that could fit in finance functions, treasury functions or the risk management function. This hybrid nature can materialise in a variety of different organisations.
General organisation of ALM
All European large banks and nearly all (95%) m/s banks declare that they have a ‘structure’ that is in charge of Asset/Liability Management. The majority of the banks see this structure as different from the risk management structure (72% of large banks and 7% of m/s banks).
The level of centralisation of the ALM
structure is strongly dependent on the size of the bank.
At 50% of large banks these structures are decentralised while the proportion is only 12% for m/s banks (Figure 2.1). The explanation of this result may be that m/s banks tend to operate in local/regional markets and the need for decentralisation is less important than for large banks. The local specificities of Asset/Liability Management and the need to have a structure that is adapted to the local market conditions may also explain why the level of decentralisation is so important for large banks.
Figure 2.1 – Distribution of centralised and decentralised ALM structure among the participating banks ,ARGEBANKS 3MALL MEDIUMBANKS #ENTRALISED $ECENTRALISED
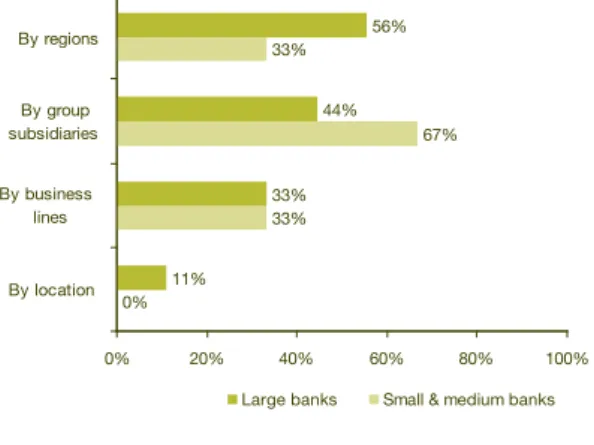
Figure 2.2 shows that when the organisations are decentralised, large banks are principally organised by territory (56% with an
organisation by region) while m/s banks tend to follow the legal units (67% with an organisation by subsidiaries).
Figure 2.2 –Types of ALM structure at banks that opted for a decentralised organisation
"YREGIONS "YGROUP SUBSIDIARIES "YBUSINESS LINES "YLOCATION ,ARGEBANKS 3MALLMEDIUMBANKS
Asset/Liability Committee (ALCO)
All banks but one within each group reported to have implemented an ALCO. A very large majority of banks consider that the missions, objectives and responsibilities of the ALCO are well defined.
When a decentralised ALM structure is in place, the approach adopted on the decentralisation at large banks shows a clear difference compared to the m/s banks (Figure 2.). 92% of large banks have both a global ALCO and decentralised ALCOs which led us to deduct that there is an appropriate governance both at the local level and at the global level. The remaining 8% have only decentralised ALCO.
Figure 2. – Types of ALCO organisations at banks with decentralised ALM structure
,ARGEBANKS 3MALL MEDIUMBANKS
16
The situation is radically different at m/s banks where only 44% have both decentralised and global ALCOs and 44% have only a unique global ALCO, presumably because m/s banks have few operations outside their main local market.
The typical composition of the ALCO is also dependent on the size of the bank (see Figures 2.4 & 2.5). While CFOs and CEOs are actively participating in ALCOs in the majority of both large and m/s banks, we can see that the head of risk management of large banks seems to have a bigger influence than in the m/s banks.
Figure 2.4 – Members of large banks’ global ALCOs $ECIDINGMEMBER #ONSULTINGMEMBER #&/ (EADOFRISKMANAGEMENT #%/ (EADOFRETAILBANKING (EADOF!,-(EADOFCORPORATEBANKING (EADOFTREASURY (EADOFCAPITALMARKET (EADOF3-%BANKING #// (EADOFMANAGACCOUNTING (EADOFSALESCOMDEVEL (EADOFTAX /THER
Conversely the head of treasury of the large banks is less often present than in the m/s banks. Another significant observation is the stronger participation of the heads of retail banking and corporate banking at the large banks.
Figure 2.5 – Members of small & medium banks’ global ALCOs
$ECIDINGMEMBER #ONSULTINGMEMBER #&/ #%/ (EADOFTREASURY (EADOF!,-(EADOFRISKMANAGEMENT (EADOFCORPORATEBANKING #// (EADOFCAPITALMARKET (EADOFRETAILBANKING (EADOFMANAGACCOUNTING (EADOFSALESCOMDEVEL (EADOF3-%BANKING (EADOFTAX /THER
While the ALCO at m/s banks is still more focused on an almost purely treasury view of ALM, the ALCOs of large banks tend to analyse all the business implications of ALM as well as all the perspectives on ALM (and the equally important risk management perspective). Among the significant number of ‘other participants’ to the ALCOs, we found the heads of research or economists (18% of large banks and 5% of m/s banks), the heads of various other market departments (18% of large banks) and finally board members (15% of m/s banks).
The typical frequency of the global ALCO meetings is monthly. The m/s banks tend to have more frequent meetings (Figure 2.6), perhaps because ALCOs follow more closely the trading-related issues (see Figure 2.7). The frequency of the decentralised meetings is similar.
Figure 2.6 – Frequencies of the global ALCOs meetings ,ARGEBANKS 3MALLMEDIUMBANKS %VERYWEEK %VERYNDWEEK %VERYMONTH %VERYQUARTER /THER
17
The average duration of the global meeting is around two hours at all banks. Not surprisingly the weekly and bi-monthly meetings are shorter (around 1.5 hours), whereas quarterly meetings are slightly longer than two hours.
The risks that are analysed by the vast majority of ALCOs in both large and m/s banks are the liquidity and the interest rate risks in the banking book (Figure 2.7). However, ALCOs at large banks show a stronger specialisation on typical ALM risks, while ALCOs in m/s banks also analyse other types of risks and are less comprehensive on ALM risks. Most ALCOs at large banks analyse FX risk (88%), while the proportion is only 6% for m/s banks.
5% of ALCOs in large banks analyse the ALM risk of the insurance businesses (to be compared with the 44% of the large banks which report to have insurance businesses), while the proportion of m/s banks which do so is only 7%, which is low considering that 21% proportion of m/s banks do have an insurance business. The ‘other’ ALM-related risks that are followed up by large banks’ ALCO are the risk of pension obligation (18%) and capital management (12%).
Figure 2.7 – Risks analysed by ALCOs
,ARGEBANKS 3MALLMEDIUMBANKS ,IQUIDITYRISK )NTERESTRATERISKIN THEBANKINGBOOK &8RISK !,-RISKSOF INSURANCEBUSINESSES )NFLATIONRISK 4RADEDMARKETRISK #REDITRISK #OUNTERPARTYRISKON TRADINGACTIVITIES /PERATIONAL2ISK /THER
The ALCOs at m/s banks also analyse risks that are outside the traditional ALM scope: a significant proportion of m/s banks ALCOs analyse credit risk (29%) and counterparty risk on trading activities (20%) and even operational risk (cited by 12% of the m/s banks in the ‘other’ category). The ALCOs of m/s banks tend to act more like an
enterprise-wide risk-management committee, where all material risks are analysed in the presence of senior management. More importantly, 59% of m/s banks’ ALCOs analyse the traded market risk, while the proportion is only 18% for large banks. This can have the same explanation as above but it can also be a consequence of organisations where, operationally, market risk in the banking book and market risk in the trading book are not clearly separated because of the small size of traded market books.
ALM unit
All of the large banks and 81% of the m/s banks have a specific unit dedicated to Asset & Liability Management.
The vast majority of banks (on average 95%) think that that the mission, objectives and activities of the ALM unit are well defined. There are, however, clear differences between m/s and large banks in terms of organisation. At large banks, the dominant business model is to locate the ALM unit in the ‘finance’ function (55% of respondents), while it is only the case for 14% of m/s banks (Figure 2.8). Conversely, in m/s banks the ALM unit is located within the market activities for 2% of respondents, while the proportion is only 6% in large banks. Interestingly, a significant proportion locates the ALM unit in the risk management division: 17% for large banks and 24% for m/s banks.
Figure 2.8 shows, however, that there is a wide variety of organisational structures which can be found equally frequently, with perhaps the exception of the localisation of ALM within Finance at some large banks. This choice of organisation in large banks seems to show that ALM is viewed more like a support function, with important financial impacts (capital management, transfer pricing etc.) than a position-taking/keeping function, which is still the organisation met in a number of m/s banks.
18
Figure 2.8 – Reporting line of the ALM unit
11% 16% 6% 32% 11% 14% ,ARGEBANKS 3MALL MEDIUMBANKS
3ENIORMANAGEMENT &INANCEFUNCTION -ARKETACTIVITIES 2ISKMANAGEMENTUNIT /THERLOCATIONS
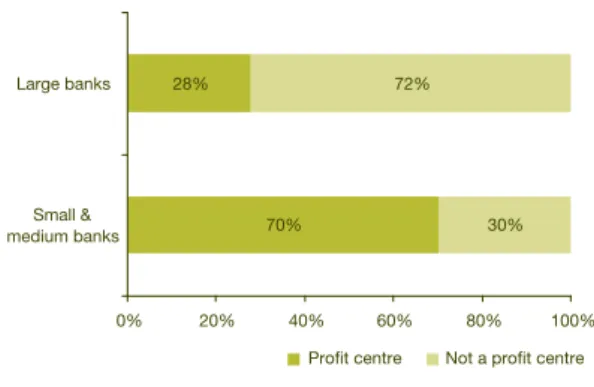
The previous analysis is corroborated by the results shown in Figure 2.9, which show a clear difference in the two groups’ perspective on ALM: the ALM unit is
considered as a profit centre for 28% of large banks, while the proportion for m/s banks is 70%!
Figure 2.9 – Distribution of banks seeing their ALM units as profit centres
,ARGEBANKS 3MALL MEDIUMBANKS 0ROFITCENTRE .OTAPROFITCENTRE
We can also see in Figure 2.10 that % of large banks and 47% of m/s banks of the ALM units have direct market access.
Figure 2.10 – Proportion of ALM units having a direct access to the markets
3MALL MEDIUMBANKS ,ARGEBANKS $IRECTACCESS TOMARKETS .ODIRECTACCESS TOMARKETS
If ALM units don’t have a direct market access they usually use the trading functions (e.g. by internal deals).
The median of the total staff number is 25 at large institutions and 5 at m/s banks. The headcount reported by some large banks was much higher, probably because the definition of the ALM unit in those banks extends to support functions (middle office, back office) and market/treasury activities.
Figure 2.11 – Representation of the various roles within ALM units
,ARGEBANKS 3MALLMEDIUMBANKS -ANAGEMENT !NALYST -ETHODOLOGY &/OPERATORS 3YSTEMS /THER
The typical composition of the ALM unit in m/s banks is one individual for each function except the analyst function, where the typical headcount is between two and three. Large banks have much larger units, with twice as many staff working on methodology and an absolute size of this function which is much bigger (Figure 2.11). The size and composition of the ALM units in large banks enables them to concentrate their efforts and means on improving and refining their capabilities.
21
Policies and
responsibilities
The previous section showed that many radically different organisations may be adopted for ALM. In this context and due to the hybrid nature of ALM which has already been mentioned, it is important that clear policies and responsibilities are set up. The importance of clear policies and responsibilities has been stressed by the Basel Committee. This section describes the policies and the responsibilities of the different parties acting in ALM.
General
The Basel Committee considers that clearly defined interest rate risk2 and liquidity risk
policies and procedures are essential. Nearly all the banks surveyed reported that they have defined policies for the management of balance sheet risks (around 90% for both groups).
TheALM policies generally cover the main expected points as shown in Figure .1. Figure .1 – Topics covered by the ALM policies (in the ‘Other’ category were quoted the manual for staff having a direct access to the markets and the FAS1 hedging policy).
,ARGEBANKS 3MALLMEDIUMBANKS /RGANISATIONALMODEL ,IMITSETTINGANDCONTROLS -ETHODOLOGYFORTHE MEASUREMENTOFRISKS -ANAGEMENTOFTHE !,-POLICIES 2EPORTINGSTRUCTURE )NVESTMENTAND HEDGINGSTRATEGIES .EWPRODUCTAPPROVAL 3YSTEMSANDTOOLS /THER
There are, however, some noteworthy highlights and potential gaps with the Basel Committee requirements:
The organisational model is covered by significantly fewer m/s banks than large banks. This is perhaps caused by the simpler structures at some m/s banks which do not need to be documented in detail.
Stress-testing requirements are only covered by policies at 67% of large banks and 59% of m/s banks. The relatively low numbers show potential gaps from the Basel Committee principles on interest rate risks. Stress-testing is particularly relevant in ALM, where the risk measurement relies significantly on judgemental assumptions. The number of new products approval policies is unexpectedly low as well. About one third of the banks don’t include them in their policy, although it is explicitly required by the Basel Committee principles (principle 5). The increasing sophistication of commercial financial products and hedging instruments, and the potential significant impact of new activities on the interest rate risk or the liquidity of the bank make such policies an incontrovertible requirement. Policies on systems and tools are present only at a small number of banks: 56% of large banks and 2% of m/s banks. Most of these policies include sections on system selections and implementation. Sections on system maintenance are even less frequent. The main responsibilities in relation to the ALM policies are mostly held by the ALCOs and the board (Table .1 & Table .2). The involvement of the board can however be increased, as the Basel Committee expects the board of directors to approve strategies and policies regarding interest rate risk management as well as authorities and responsibilities4. As such,
one might expect a higher percentage on the several ‘approval’ responsibilities. The board should also ensure that senior management takes steps to enforce policies and strategies. The identification of ineffectiveness in policies has quite a low percentage in general: only 6% for the board, and around 50% for the ALM unit and the RM unit.
■
■
■
■
2 Principles for the
Management and Supervision of Interest Rate Risk, Basel Committee, 2004 (“BASEL IRR”), principle 4, . Sound Practices for
Managing Liquidity in Banking Organisations, Basel Committee, 2000 (“BASEL LR”), principle . 4 BASEL IRR, Cp. 27.
22
Table .1 – Distribution of responsibilities related to ALM at large banks
Large banks Board managementSenior Finance ALCO ALM unit unitRM Other unit oneNo
Approval of ALM policies 67% 9% 22% 67% % 22% 0% 0%
Approval of the main proposed
changes in policies 50% 9% 22% 78% % 28% 0% 0%
Approval of exceptions to policies 9% 9% 17% 50% 22% % 0% 0% Approval of responsabilities 50% 50% 22% 56% 11% 6% 0% 0% Approval of delegation
of authorisations 9% 44% 6% 28% 11% 6% 0% 0%
Identification of ineffectiveness
in policies 6% 28% 17% 17% 9% 44% 11% 0%
Compliance with policies 0% 11% 22% 17% 56% 50% 22% 0% Control of the implementation of
the policies 0% 17% 17% 11% 9% 61% % 0%
Table .2 – Distribution of responsibilities related to ALM at small & medium banks
Small & medium banks Board managementSenior Finance ALCO ALM unit unitRM Other unit oneNo
Approval of ALM policies 71% 29% 2% 57% 10% 10% 0% 0% Approval of the main proposed
changes in policies 69% 26% 2% 55% 10% 12% 0% 0%
Approval of exceptions to policies 48% 21% 5% 62% 10% 14% 0% 0% Approval of responsabilities 52% % 5% 57% 12% 5% 0% 0% Approval of delegation
of authorisations 40% 21% 2% 48% 12% 5% 0% 5%
Identification of ineffectiveness
in policies 7% 14% 5% % 48% 52% 7% 2%
Compliance with policies 12% 19% 7% 6% 1% 52% 19% 0% Control of the implementation of
the policies 17% 21% 5% % 26% 64% 17% 0%
One would also expect senior management to have a greater role in that respect (28% in large banks and 14% in m/s banks) in line with Basel Committee requirements that senior management ensures that appropriate policies and procedures are established5.
In the ‘control-orientated ‘responsibilities there are quite similar results for the ALM unit and the RM unit. In comparing large and
m/s banks it can be noted that the board delegated more of its tasks to the ALCO in large banks. Large banks’ financial units and the risk management function are also significantly more integrated in decisions regarding ALM policies.
2
As expected the main risks covered by the ALM policy are liquidity and interest rate risk in the banking book (Figure .2). The ALM risks in insurance businesses are covered by only 17% of large banks, while the
percentage of ALCOs that follows these risks is much higher (29%) (see Figure 2.7). The same observation holds for inflation risks in m/s banks, which shows that ALM policies still need to be updated to include all types of ALM risk. In line with previous results, the percentage of traded market risk in m/s banks is high compared to large banks. And finally, confirming the increased specialisation and sophistication of ALM in large banks, a significant proportion of large banks include capital measures as risk covered by the ALM policies in the ‘Other’ category.
Figure .2 – Risks covered by the ALM policies ,ARGEBANKS 3MALLMEDIUMBANKS ,IQUIDITYRISK )NTERESTRATERISK ONTHEBANKINGBOOK &8RISK )NFLATIONRISK #REDITRISK !,-RISKOFINSURANCE BUSINESSES 4RADEDMARKETRISK /PERATIONALRISK #OUNTERPARTYRISK ONTRADINGACTIVITIES /THER
Responsibilities
The responsibility for definition of the strategies and general guidance for investments is generally held at a senior level in the organisation (Figure .). All large banks and 9% of the m/s banks allocate this responsibility to one of the three senior authorities: the ALCO, the board of directors or the senior management. The treasury and the ALM unit are also active in establishing this guidance (around 40%).
Figure . – Departments in charge of stating the strategies and general guidance for investments ,ARGEBANKS 3MALLMEDIUMBANKS !,#/ 4REASURY "OARD !,-UNIT 3ENIORMANAGEMENT &INANCE 2ISKMANAGEMENT /THER
Checking the compliance of the effective investments and the approved strategy is principally done by a posteriori checks of risk of investments made (94% of large banks; and 87% of m/s banks) and a posteriori checks on volume invested (large 56%; m/s 58%). An analysis of minutes of the treasury committee by the entity in charge of defining strategies and general decisions is done by 1% of the large banks and only 5% of the m/s banks.
The responsibility for hedging decisions is allocated in quite a similar way to that for investments (Figure .4). The board and the senior management are, however, generally less involved than in investment decisions and the risk management department has more influence. As for investment, often several units are involved in the decision process.
Figure .4 – Departments in charge of stating the strategies and general guidance for hedging ,ARGEBANKS 3MALLMEDIUMBANKS !,#/ !,-UNIT 4REASURY 2ISKMANAGEMENT &INANCE 3ENIORMANAGEMENT "OARD /THER
24
We asked the banks whether the responsibilities listed in Figure .5 were relevant to the board and to the senior management (Figure .6). These responsibilities are required by the Basel Committee, and we see that there are still some gaps that could be closed by redefining the role of the board of Directors and senior management.
Figure .5 – Responsibilities of the board of Directors ,ARGEBANKS 3MALLMEDIUMBANKS !PPROVALANDREEVALUATIONOFTHE STRATEGIESANDPOLICIESOFBALANCE SHEETRISKMANAGEMENT 3ETTINGOFINTERESTRATEANDLIQUIDITY RISKAPPETITE %NSURINGTHEPROVISIONOFCLEAR GUIDANCEREGARDINGTHEACCEPTABLE LEVELOFBALANCESHEETRISK 0ERIODICALANALYSISOFTHEINFORMATION TOEVALUATETHEMANAGEMENTPROCESS OFTHEBALANCESHEETRISK !PPROVALOFMAINCHANGESANDNEW PROPOSALSREGARDINGBALANCESHEET RISKMANAGEMENT %NCOURAGINGDISCUSSIONSINTHE ORGANISATIONREGARDINGTHELEVELAND MANAGEMENTOFBALANCESHEETRISK /THER
Figure .5 shows that boards could take a more active role in ALM, particularly in reviewing and assessing the effectiveness of the ALM process itself, by reviewing the process, approving the main changes and encouraging discussions on ALM within the organisation.
Figure .6 – Responsibilities of senior management ,ARGEBANKS 3MALLMEDIUMBANKS !SSESSMENTOFTHE ADEQUACYOF!,-LIMITS 0ERIODICALEVALUATIONSUPERVISION ANDREVIEWOFTHE!,-POLICIESAND PROCEDURES !SSESSMENTOFRESOURCES DEDICATEDTO!,--AINTAININGANDEVALUATING INTERNALCONTROLS -AINTAININGANDEVALUATING STANDARDSFORVALUINGPOSITIONS ANDMEASURINGPERFORMANCES 0ERIODICALANALYSISOFTHEIMPACT OFMARKETCHANGESONBALANCESHEET RISKS 2ECOGNITIONANDREEVALUATIONOF THEKEYASSUMPTIONSWITHINTHE MEASUREMENTSYSTEM !SSESSMENTOFTHEACTUAL PROCESSESFORREVIEWINGTHE!,-POLICIES /THER
Senior management could also take a more active role: the recognition and assessment of the ALM measurement key assumptions is an area where the involvement of senior management and ALCO is required (see Table .). The balance sheet positions are often heavily dependent on assumptions (maturity of non-maturating product, prepayment etc.). These assumptions are often taken as facts by senior management and small changes may radically modify the risk exposure of the bank. Recognition and reassessment of these assumptions should be included in senior management tasks.
25
Table . – Description of the responsibilities attributed to the ALCOs
ALCO’s responsability banksLarge banksM/S
Supervision of the entity’s liquidity
risk 100% 85%
Decision on the general strategies on interest rate and liquidity risk
management 94% 8%
Definition of policies, limits and authorisation on liquidity risk management
89% 7% Supervision of the entity’s interest risk 8% 9% Review and analysis of the legal and
regulatory changes that can have an impact on ALM
78% 68% Review of the diversity, the cost and
the structure of financing sources 78% 61% Review and evaluation of the results
of stress testing 78% 6%
Decision on new financing and
securitisation structures 72% 56% Design or approval of the financing
strategy 72% 6%
Decision on the investment strategy 72% 71% Definition of policies, limits and
authorisation on interest rate risk management
72% 6% Review and monitoring of the needs
of capital by each business unit 67% 9% Review of the implementation and
the execution of the risk tranfer price policies
67% 6% Validation of main modeling
assumptions 67% 51%
Decision on systems used for balance
sheet risk management 17% 7% On average the ALCOs at large banks have more responsibilities (on average 11.1 tasks) than the m/s banks’ ALCOs (on average 9.8 tasks). The coverage of the above responsibilities is also larger in large banks than in m/s banks (Table .). Refinancing decisions and reviews of capital needs are topics that are less present at ALCOs of m/s banks, whereas capital management is a topic that is addressed more and more frequently within the ALM framework of large banks. The validation of the main modelling assumptions is still done by a relatively low percentage of ALCOs, as well as decisions on systems, despite the importance of systems in the overall efficiency of ALM.
As for ALCOs, ALM units at large banks have more responsibilities (Table .4). The identification, measurement, monitoring and reporting of interest risks and hedging strategy execution is done by 50% of m/s banks while the percentage is much higher for large banks.
Table .4 – Description of the responsibilities attributed to the ALM units
ALM unit’s responsability banksLarge banksM/S
General hedging strategy proposal 8% 86% Identification, measurement,
monitoring, and reporting of medium/
long-term liquidity risk 8% 67% Transfer price setting 78% 75% Identification measurement,
monitoring, and reporting of interest rate risk
78% 50% Identification measurement,
monitoring, and reporting of
shot-term liquidity risk 78% 58% Setting of Liquidity Contingency Plan 78% 67% Hedging strategy execution 72% 50% Identification measurement,
monitoring, and reporting of foreign exchange risk
72% 72%
Debt issuance 67% 42%
Investment strategy execution 61% %
Capital issuance 61% 6%
Defining optimal capital and debt
structure 56% 61%
General investment strategy proposal 50% 75% Securitisation issuance 50% 1% Active portfolio management % 5% If policies and procedures are always defined by the central ALM unit, the involvement of the central unit in the actual ALM management of the subsidiaries varies and shows that there is some room for improvement in the optimization of ALM at a group-wide level. For instance, only half of the central ALM units of m/s banks give instructions to subsidiaries to reduce liquidity risk if this risk is significant (Figure .7).
26
Figure .7 – Responsibilities of the holding/ central entity towards subsidiaries’ ALM function ,ARGEBANKS 3MALLMEDIUMBANKS $EFINETHEGROUPPOLICIESAND PROCEDURESINRELATIONWITH!,-!GGREGATETHESUBSIDIARIESgEXPOSURES ANDREPORTTHEMTOSENIORMANAGEMENT 'IVEINSTRUCTIONTOTHESUBSIDIARYTO REDUCELIQUIDITYRISKIFTHISRISKIS SIGNIFICANT 'IVEINSTRUCTIONTOTHESUBSIDIARYTO REDUCEINTERESTRATEEXPOSUREIFTHIS EXPOSUREISSIGNIFICANT )MPLEMENTMAINTAINTHEGROUP!,-SYSTEM $ECIDEONTHESUBSIDIARIESgGENERAL STRATEGYOFINTERESTRATEAND LIQUIDITYRISKMANAGEMENT !UDITTHESUBSIDIARIESg!,-FUNCTION $ECIDEONTHESUBSIDIARIESgGENERAL INVESTMENTSTRATEGY /THER
Banks should have risk measurement,
monitoring and control functions which are sufficiently independent from position-taking functions. The ALM function can potentially combine these two types of functions; however, banks generally state that the ALM risk is controlled by an independent unit even if this percentage is only at 66% for m/s banks (Figure .8).
Figure .8 – Distribution of banks presenting a ALM risk-measuring & controlling unit independent from the position taking
,ARGEBANKS 3MALL MEDIUMBANKS )NDEPENDENT .OTINDEPENDENT
The two following results provide a more complete picture on this issue. The
responsibility for risk controlling is located in the risk management function for a majority of banks. We can highlight, however, that 25% of large banks have this risk control function as an internal unit of the ALM unit (Figure .9).
Figure .9 – Units responsible for controlling the risks generated by the ALM unit
2ISKMANAGEMENTUNIT )NTERNALDEPARTMENT WITHINTHE!,-UNIT &INANCE -ANAGEMENTACCOUNTING 4REASURY /THER ,ARGEBANKS 3MALLMEDIUMBANKS /THER )NTEXTAUDIT #ONTROLLINGUNIT "USINESSUNITCONTROLLINGMARKET RISKCONTROLLING
The location of the responsibility for the performance and risk reporting is, however, less clear, with an equal involvement of ALM units and risk management units at large banks and a clear pre-eminence of the risk management unit in m/s banks (Figure .10). Looking ahead, we see that the risk
management unit is more and more involved in controlling the ALM risk, and one aspect of this control is certainly to develop an independent risk and performance reporting on ALM risks.
Figure .10 – Units responsible for measuring and reporting the performance & risks of ALM
,ARGEBANKS 3MALLMEDIUMBANKS !,-UNIT 2ISKMANAGEMENT -ANAGEMENT ACCOUNTING &INANCE 4REASURY /THER /THER -IDDLEOFFICEMULTIPLE 0RODUCTCONTROL "USINESSUNITCONTROLLING MARKETRISKCONTROLLING
27
Table .5 – Distribution of responsibilities amongst departments operationally active in ALM6:
Large banks/Small & medium banks ALM unit RM unit Treasury Others No one
Analysis on market tendencies and
evolutions 50% 48% 17% 10% 28% 40% 28% 14% 0% 5%
Back testing of measurement
methodologies 44% 17% 56% 67% 6% 5% 11% 0% 11% 10%
Control of the implementation of the strategies of hedging and investment of ALM
44% 1% 44% 55% 17% 10% 28% 12% 11% 12% Control of the limits 44% 14% 72% 81% 11% 5% 11% 12% 0% 0% Design of the techniques needed to
test the hedge effectiveness % 24% 22% % 17% 10% 44% 24% 11% 14% Execution of hedging decisions 56% 52% 6% 2% 50% 6% 6% 7% 0% 2% Funding of the group’s subsidiaries 50% 29% 0% 2% 61% 8% 0% 10% 6% 21% Liquidity and interest risk measurement 50% 8% 67% 64% 11% 10% 11% 2% 0% 0% Liquidity and interest risk stress testing 56% 4% 72% 71% 9% 5% 6% 5% 0% 2% Regulatory reporting preparation 28% 21% 28% 62% 11% 5% 72% 29% 6% 5% Reporting preparation to ALCO 61% 60% % 52% 22% 19% 0% 5% 0% 2%
Securitisation 22% 21% 0% 5% 17% 29% 9% 14% 22% 19%
Validation and control of the integrity of
the systems data 28% 4% 44% 40% 6% 5% 61% 29% 0% 2%
Validation of hedge effectiveness
testing developed for IAS 9 28% 19% 11% 29% 11% 12% 61% 1% 17% 21% Validation of interest rate risk
management methodologies 9% 40% 67% 67% 6% 5% 22% 17% 0% 0% Validation of liquidity risk management
methodologies 50% 6% 61% 60% 28% 19% 11% 14% 0% 2%
Validation of the methodologies and
assumptions used by the ALM unit 44% 8% 67% 67% 17% 7% 11% 19% 0% 0% Validation of the methodologies
developed for transfer prices 50% 29% % 6% % 24% % % 6% 2% Table .5 shows that the ALM units often have
similar responsibilities to another unit: the control and measurement type of function can be done by the risk management unit, while the position-taking function is shared with treasury. In this environment, it is important to state clearly the respective responsibilities of the different units to avoid duplication of task and ensure both independence and completeness of the task and controls. The category ‘others’ consists essentially of the accounting department or the financial controlling department. Securitisation is often done by a specialised unit.
Liquidity contingency funding plan
(LCFP)
Most banks have a formal LCFP which covers policies and procedures to use as a blueprint in the event that the bank is unable to fund some or all of its activities in a timely manner and at a reasonable cost. The Basel Committee recommends the definition of a LCFP7. 28% of m/s banks have not, however,
defined such a plan (Figure .11).
6 Multiple answers were possible so the sums of the percentages exceed 100%. 7 BASEL LR, Principle 9.
28
Figure .11 – Degree of implementation of a liquidity contingency funding plan (LCFP)
,#&0INPLACE .O,#&0INPLACE ,ARGEBANKS 3MALL MEDIUMBANKS
Banks can define different levels of severity to describe a liquidity crisis. The typical number of levels is three for both m/s banks and large banks – large banks tend, however, to use more levels than m/s banks8 (Figure .12).
Figure .12 – The number of levels in LCFP.
,ARGEBANKS 3MALLMEDIUMBANKS LEVEL LEVELS LEVELS LEVELS LEVELS LEVELS
Figure .1 – Components of the LCFP
,ARGEBANKS 3MALLMEDIUMBANKS #OMMITTEEWITH DEFINEDROLE ANDRESPONSIBILITIES )NVOLVEMENTOFSENIOR MANAGEMENT -ECHANISMTO IDENTIFYACRISIS SPECIFICORSYSTEMIC 0ROCESSOFCOORDINATION INTIMEOFCRISIS !LTERNATIVEWAYSOF FINANCING %XTERNAL COMMUNICATIONPLAN "ALANCESHEETACTIONS )NTERNAL COMMUNICATION PLAN ,OGISTICALAND ADMINISTRATIVE SPECIFICPLAN /THER
Most of the topics listed in Figure .1 are detailed in ‘Sound Practices for Managing Liquidity’ by the Basel Committee. While large banks are in compliance with the majority of the contents, m/s banks still need to improve their procedures, in particular in the definition of a committee9 with the power
to take decisions in time of crisis and the definition of an external communication plan.
8 The number of severity levels is not specified by the Basel Committee.
1
Methodologies
This section explores the extent and the sophistication of the modelling approaches used within Asset Liability frameworks.
Size matters
The results of the present survey tend to show that the size of the banking group has a strong influence on the level at which the risks of the balance sheet are measured. Almost all large banks measure these risks at the consolidated level, as well as at decentralised level for a large proportion of them. For smaller banks, a decentralised measure is more frequent, mainly at the legal entity level. It is somewhat contradictory to the results of question 2.1, which tend to show that the ALM structure is rather centralised for m/s banks, and equally distributed in large groups.
Figure 4.1 – Levels at which the balance sheet risk is measured
,ARGEBANKS 3MALLMEDIUMBANKS !TACONSOLIDATED LEVEL !TALEGALENTITY LEVEL "YBUSINESSLINE "YCOUNTRYTERRITORY /THER
Most of the large banks measure their risk on a bi-weekly or monthly basis at the consolidated level. This frequency increases strongly at the business level (Figure 4.2). The focus of the business lines on their core business facilitates a close follow-up of the risks by the relevant management. A very similar tendency is visible with m/s banks. The degree of sophistication of the tools used depends strongly on the size of the entity as well. All banks analyse their liquidity and interest rate risks with several methods, but a significant portion of the participants do not use dynamic simulations at all and rely solely on standard static models (Figure 4.).
Figure 4.2 – The frequency of the balance sheet risk measure at large banks
!TA CONSOLIDATED LEVEL !TALEGAL ENTITYLEVEL "YBUSINESS LINE "YCOUNTRY TERRITORY
$AILY 7EEKLY -ONTHLY /THER
Figure 4. – Frequency of dynamic simulations 7% ,ARGE BANKS 3MALL MEDIUM BANKS
$AILY 7EEKLY -ONTHLY 1UARTERLY /THER .OSIMULATION
The factors modelled in dynamic simulations are not uniform among the participating banks, but do not depend on the bank’s size. If all institutions running simulations do consider market interest rates as risk factors, only two thirds of them account for the time evolution of balance sheet volumes, and less than a half account for FX scenarios. Only a very small number of banks use the customers’ default probability in their calculations.
Liquidity risk measures
The dominating methodology for the static measure of liquidity risk is the liquidity gap (Figure 4.4). The structural liquidity ratio and the counterparty concentration analysis are the two ratios that are the most commonly used at banks for the measurement of liquidity risk (Figure 4.5).
2
Figure 4.4 – Static methods to measure liquidity risk ,ARGEBANKS 3MALLMEDIUMBANKS ,IQUIDITYGAP .ETLIQUIDITY POSITION )NTERBANK CONCENTRATIO ANALYSIS )MPACT OFHIGHER REFINANCINGCOSTS /THER
Figure 4.5 – Ratios used as indicators of liquidity risk ,ARGEBANKS 3MALLMEDIUMBANKS 3TRUCTURAL LIQUIDITYRATIO #ONCENTRATION ANALYSIS 3URVIVALHORIZON ,IQUIDITYGENERATION CAPACITYRATIO $EPOSITVERSUS BORROWINGRATIOS )LLIQUIDASSETVERSUS DEPOSITRATIOS /THER
90% of large banks and 75% of smaller institutions try to capture their liquidity risk with dynamic simulations. These simulations rely essentially on predefined scenarios based on historical or specific events, and the majority of banks account for the impact of these events on the new production. Only a limited number of banks (1% of small banks and up to 1% of the largest ones) use probabilistic models.
Interest rate risk measures
To manage the interest rate risk of the balance sheet of a bank, the two measures an asset liability manager traditionally looks at are the net interest income (NII) and the economic value of capital (EVC) and their respective sensitivities to movements of the yield curves.
Interestingly, although both measures are used at almost all large institutions, a significant proportion of smaller entities
seem to concentrate more effort only on the assessment of the net interest income than on the longer-term view given by the economic value of capital (Figure 4.6). Figure 4.6 – Indicators on which interest rate risk is calculated ,ARGEBANKS 3MALLMEDIUMBANKS .ETINTERESTINCOME %CONOMICVALUEOF CAPITAL .ONINTERESTINCOME INCLUDINGFEES
Only a very small number of banks (less than 10%) try to analyse the impact of movements of interest rates on the non-interest rate incomes, such as fees.
There exists a broad agreement on the
methods used to measure the impact of interest rates movements on the bank (Figure 4.7). Figure 4.7 – Methods to measure interest rate risk ,ARGEBANKS 3MALLMEDIUMBANKS 2EPRICINGGAPS 3ENSITIVITYOF%6# 3CENARIOSANALYSIS 3TRESSTESTING $YNAMICGAP 6A2OF%6# 6ARIABLERATEGAPS %ARNINGAT2ISK /THER
Repricing gaps, the sensitivity of the
economic value of capital, scenario analysis and stress tests are the most widespread methods among all banks.
The set of curve movements used in stress tests is also quite standard. Almost all banks use parallel shifts in both directions, trying to capture the effect of the non linearities embedded in the financial products in the balance sheet and off-balance sheet. 80% of the large banks and only 50% of the smaller
institutions also use stress testing with flattening or steepening scenarios. VaR of EVC, mainly based on historical simulations or on parametric models, is also used by more than half of the participating banks.
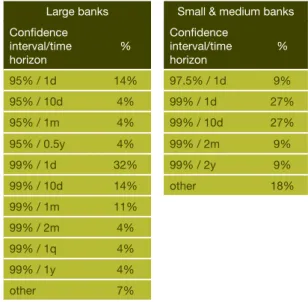
It is quite interesting to note that there is no unique choice of the confidence interval and the time horizon among both large and smaller banks: confidence intervals are set between 95% and 99%, and holding periods range from one day to two years (see Table 4.1). Nevertheless about half of the participating banks consider a 99% confidence interval with short-term horizon (up to 10 days) consistent with the estimated time frame to implement corrective actions in case of an adverse event.
More sophisticated methods such as Earning-at-Risk (EaR) are less popular, although quite powerful. The cost of the implementation of the required technology and a delicate parametrisation of the models may prevent a wider use.
Table 4.1 – Choices of time horizon and confidence intervals for EVC-VaR calculations
Large banks Small & medium banks Confidence interval/time horizon % Confidence interval/time horizon % 95% / 1d 14% 97.5% / 1d 9% 95% / 10d 4% 99% / 1d 27% 95% / 1m 4% 99% / 10d 27% 95% / 0.5y 4% 99% / 2m 9% 99% / 1d 2% 99% / 2y 9% 99% / 10d 14% other 18% 99% / 1m 11% 99% / 2m 4% 99% / 1q 4% 99% / 1y 4% other 7%
A few large financial groups (2% of them) also report having internal tools allowing the integration of interest rate risks generated by their banking and insurance businesses.
Models of non-maturing
instruments
With respect to the modelling of the non-maturing deposits, the distribution of the methods in use is similar among large and smaller institutions (Figure 4.8). About two thirds of the respondents use statistical methods or estimations of the maturity, and the remaining group uses the method of the replicating portfolio.
Figure 4.8 – Models for non-maturing deposits ,ARGEBANKS 3MALL MEDIUMBANKS
-AXMATURITY 3TATISTICALANALYSIS %STIMATEDMATURITY 2EPLICATINGPORTFOLIO /THER
.OTE!TLARGEBANKSTHEESTIMATEDMATURITYISINMOSTCASESOFYEARS ANDRANGESFROMYEARTOYEARSFORTHEOTHERINSTITUTIONS
This clear division has probably both a regulatory and a local business environment explanation: in many countries deposits are not remunerated. A statistical analysis of core and volatile volumes of deposits is then meaningful. In other countries (for example, Switzerland and Germany), deposits may be remunerated and most of the effort has been concentrated on the construction of replication portfolios to model the time evolution of the interest rate paid to the customers. The latter approach is then similar to the one adopted for products with administered rates (see below).
Figure 4.9 – Models for equity
,ARGEBANKS 3MALL MEDIUMBANKS
-AXMATURITY 3TATISTICALANALYSIS %STIMATEDMATURITY 2EPLICATINGPORTFOLIO /THER
4
Modelling the equity is a more judgemental question and there is an obvious lack of agreement on the way to achieve it (Figure 4.9). Statistical methods are rather seldom used and institutions seem to rely on their own view or experience. The maturities reported are in all cases longer than a year, and many respondents tend to consider equity as an almost permanent funding resource bearing no interest rate risk. Another approach adopted by an increasing number of banks is the benchmarking of the progression of the economic value of equity against the performance of bond index of fixed maturity, typically 5 or 10 years.
Products with prepayment options
Embedded prepayment options represent a permanent challenge to asset liability managers because customers do not adopt fully rational behaviour. One has then to infer the driving forces that will influence the customers’ reactions and use them in a consistent framework. The technical means and data available are key to this task and will strongly influence the sophistication of the models the institutions will adopt.
Figure 4.10 – Elements of prepayment modelling ,ARGEBANKS 3MALLMEDIUMBANKS #ONTRACTUALMATURITY 3TATISTICAL PREPAYMENTRATES *UDGEMENTALESTIMATED PREPAYMENTRATES #HARACTERISTICSOFTHEPRODUCT DURATIONCONTRACTUALRATEx )NTERESTRATELEVELS 2ATESINDEPENDENTFROM INTERESTRATELEVELS STATISTICPREPAYMENT /THER
Figure 4.10 shows that the approach adopted at large banks differs strongly from the one at smaller banks which tend to adopt a pragmatic trade-off. At large institutions, the models are more developed and integrate essential variables such as the impact of the level of market rates and the observed statistical prepayment frequencies. The contractual maturity of the contract is rarely considered as an important element in the
estimation of the effective maturity.
Products with administered rates
Similar to deposits, products with administered rates, be it by regulatory decision or purely internally to the banks, play a central role in the management of the liquidity and interest rate risks of the balance sheet. A lot of effort has then been concentrated on a realistic modelling of these financial instruments.
Replication models are the most widely used tools. Originally based only on past market rates, a number of banks have now improved these models by integrating the impact of volume fluctuations (Figure 4.11).
Figure 4.11 – Models for products with administered rates ,ARGEBANKS 3MALLMEDIUMBANKS 2EPLICATIONMODELUSING MARKETRATESONLY 2EPLICATIONMODELUSINGMARKET RATESANDBALANCEVARIATIONS 2EPLICATIONMODELUSINGMARKET RATESANDECONOMICINDICATORS 2EPLICATIONMODELUSINGMARKETRATES BALANCEVARIATIONSANDECONOMICINDICATORS 3TOCHASTICMODELFORTHERATE INTEGRATINGIMPLICITCAPANDFLOOR /THER
Interestingly enough, if more than 80% of banks using replication portfolios base their models on past market data, a significant portion of institutions (0% of small banks, 50% of large banks) claim to determine their optimal portfolios on simulated future values of market rates as well.
Stress testing
Apart from being the new regulatory hot topic in risk management10, stress scenarios are
a very efficient way of testing the limits of resistance of the balance sheet to adverse movements on the markets, and 90% of the European banks stress test their interest rate risk in order to measure the potential losses if these extreme scenarios occur. But surprisingly enough, 25% of large banks do not stress test their liquidity risk. This proportion goes up to 70% for small and medium banks.
10 Basel Committee on Banking Supervision, International Convergence on Capital Measurement and Capital Standards, A revised Framework – Comprehensive Version, June 2006.
5
The common methodologies that most European banks use to perform stress testing are stress testing using specific scenarios, with worst-case scenario analysis and historical scenarios being the most popularly used (Figures 4.12 & 4.1).
Figure 4.12 – Most commonly used stress scenarios ,ARGEBANKS 3MALLMEDIUMBANKS 3TRESSTESTINGONTHE MAINASSUMPTIONS 3TRESSTESTINGUSING SCENARIOSBASEDON ECONOMICANALYSIS 3TRESSTESTINGUSING HISTORICALSCENARIOS 3TRESSTESTINGUSING SPECIFICSCENARIOS
Figure 4.1 – Specific scenario used
,ARGEBANKS 3MALLMEDIUMBANKS 7ORSTCASE ANALYSIS "USINESS EXPECTATIONS ANALYSIS 3TRESSTESTRISK FACTORS
Meaningful economic scenarios are very relevant for this kind of testing and consequently are widely used: historical extreme scenarios as well as scenarios based on fundamental economic analysis are rather popular among large banks (60% of them use these scenarios).
Questioning the limits of the main assumptions of the models is also very relevant for the stress testing exercise, but only half of the respondents report such tests.
Back testing and internal validation
Back testing the interest rate and liquidity risks calculations for a balance sheet is far more difficult in a trading environment than in market risk management. But it is certainly a valuable exercise in order to improve the quality of the asset liability management. Accordingly two thirds of the responding banks do back test
interest rate risk and only 20% of banks try to back test their liquidity risk.
One third of the banks doing back testing do a very close follow-up of their risk measure on a daily basis (see Figure 4.14). Then another third of the sample back test their interest rate risk on a monthly basis, probably at the same frequency as their internal reporting. The other banks undertake back testing on a wide range of frequencies.
Figure 4.14 – Frequency of interest rate risk back testing ,ARGEBANKS 3MALLMEDIUMBANKS $AILY 7EEKLY -ONTHLY 1UARTERLY 3EMIANNUALLY !NNUALLY /THER
Liquidity risk back testing is more delicate, and as one could expect, only a very limited number of banks, be they large or small, undertake these kinds of tests: about 25% of respondents report such a test, carried out principally on a monthly basis.
The back testing of the assumptions made in internal models for non-maturing deposits, loan prepayment and administered rates-based products is also an important aspect of permanent validation of the risk management tools. 60% of the large European banks claim to review these assumptions, on an annual basis for a majority of them. This number drops to 5% at smaller institutions and it clearly shows that this sophisticated and time-consuming task needs levels of staffing which might not be available for all banks.
Banks’ view on their ALM models
Tables 4.2 & 4. below summarise the view that the banks participating in the survey have on their internal liquidity and interest rate risks measurement methodologies. All banks share the view that their ALM models capture well enough the main risks in their positions. Nevertheless topics such as
6
Table 4.2 – Large banks’ view on their internal ALM system capabilities
In banks’ view, their internal ALM model Totally Enough Partially No
Captures the main risks related to asset, liabilities and off balance sheet
positions 71% 29% 0% 0%
Is well documented, including the tests performed to confirm the main
assumptions 5% 5% 12% 0%
Is integrally part of the daily monitoring of risk management 5% 20% 20% 7%
Captures the optionality risk 6% 59% 5% 0%
Capture changes in the shape of the yield curve 8% 8% 19% 6%
Captures basis risk 19% 44% 19% 19%
Captures the clients’ solvency risk 0% 7% 7% 86%
Takes into account IAS9 1% 25% 6% 8%
Is regularly reviewed by internal or external audit or any independent
department 50% 8% 6% 6%
Does not constitute a black box 5% 40% 7% 0%
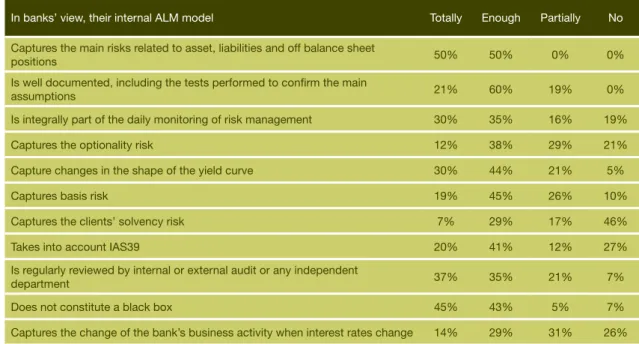
Captures the change of the bank’s business activity when interest rates change 19% 50% 25% 6% Table 4. – Small & medium banks’ view on their internal ALM system capabilities
In banks’ view, their internal ALM model Totally Enough Partially No
Captures the main risks related to asset, liabilities and off balance sheet
positions 50% 50% 0% 0%
Is well documented, including the tests performed to confirm the main
assumptions 21% 60% 19% 0%
Is integrally part of the daily monitoring of risk management 0% 5% 16% 19%
Captures the optionality risk 12% 8% 29% 21%
Capture changes in the shape of the yield curve 0% 44% 21% 5%
Captures basis risk 19% 45% 26% 10%
Captures the clients’ solvency risk 7% 29% 17% 46%
Takes into account IAS9 20% 41% 12% 27%
Is regularly reviewed by internal or external audit or any independent
department 7% 5% 21% 7%
Does not constitute a black box 45% 4% 5% 7%
Captures the change of the bank’s business activity when interest rates change 14% 29% 1% 26% embedded optionalities, basis risk and clients’
solvency (credit risk) remain at the top of the to-do list for a number of large and small banks.
Having a robust enough tool allowing
modelling of the changes in business caused by changing market conditions is also still to be achieved by a proportion of the responding institutions.
Finally, another general concern is the accounting impacts of some transactions applying the new IAS 9 accounting standard.
9
Limits framework
In the present chapter are gathered the results regarding the limits and frameworks for liquidity and interest rate risk indicators adopted by the participating banks.
Liquidity risk
Only a very few banks do not have a liquidity risk limit framework in place (Figure 5.1). 94% of large banks report that they have ensured that this framework covers all entities within the group with material liquidity risk. This is not yet the case for all the small banks: only 72% of them report that the limits framework covers all material liquidity risks.
These frameworks constitute a real management tool, and a large majority of banks with such a framework monitor these limits on a monthly basis as a minimum, and two thirds monitor these limits every week at least (Figure 5.2).
Figure 5.1 – Liquidity limits frameworks in place ,ARGEBANKS 3MALL MEDIUMBANKS ,IQUIDITYLIMITSINPLACE .OLIQUIDITYLIMITSINPLACE
Figure 5.2 – Frequency of liquidity limit monitoring 63% 40% ,ARGEBANKS 3MALL MEDIUMBANKS
$AILY 7EEKLY -ONTHLY .OPROC /THER
As seen in Chapter 4, liquidity gaps, net liquid positions and structural liquidity ratio analysis are the most common methods used to measure liquidity risk and quite often have limits attributed (Figure 5.).
Figure 5. – Liquidity risk indicators for which a limit exists ,ARGEBANKS 3MALLMEDIUMBANKS ,IQUIDITYGAP .ETLIQUIDITY POSITIONS ,IQUIDITYRATIO 3URVIVALHORIZON /THER
Interest rate risk
The general application of interest rate risk limits frameworks is clearly a consequence of the spreading of risk management best practice as well as the standardisation of the regulatory requirements across Europe. Interestingly enough, while all banks report having a methodology in place to measure liquidity and interest rate risks, a couple of m/s-sized banks do not have internal limits attributed to the risk measures (Figure 5.4). All large banks report that their framework covers all entities within the group with material interest rate risk but only 82% of medium and small banks.
Figure 5.4 – Interest rate risk limits framework in place ,ARGEBANKS 3MALL MEDIUMBANKS )22LIMITSINPLACE .O)22LIMITSINPLACE