Key Findings
HCE Team
Country: Vietnam
Site: Quang Nam province disaster studied: Floods in November, 2007.
Map of Vietnam
Map of Quang Nam
Summary
Statistics
Health Impacts:
1. In the villages where floods occur frequently, there is higher, not statistically significant impact of flood 2007 on health infections children in Quang Nam, as local people may have evolved immune system to adapt to the changes over the time ( Chi-Square test with P-Value > 0.05).
Figure 1: Health infectious Children in one month after floods
2. Local people live in extremely flooded villages were injured with statistically significant higher than of those live in less flooded villages, particularly of bone fracture, cut and animal bite (Chi-Square test: P-value , 0.05)
Figure 2: Types of injuries due to flood 2007
7.1 6.8 1.2 2 .4 5.9 6.3 1.5 2 .1 0 2 4 6 8 Skin in f ec tious A c ute Res piratory Diarrohea Fev er ov er 38 degree c entrigrade
T ype s of in fe ctiou s ch il dre n
(p er ce n t) Flooded v illages Les s -f looded v illages 2 2 8 22 1 0 1 8 5 1 5 0 6 0 6 0 0 5 1 0 1 5 2 0 2 5( Pe r c e n t) F lo o d e d
Key Findings
HCE TEAM Country: Vietnam
Site: Quang Nam province disaster studied: Floods in November, 2007.
Map of Vietnam
Map of Quang Nam
Summary
Statistics
3. There is a statistically significant differences in the reasons of injuries between/within flooded villages and less flooded villages (Chi-square test with F-Value = 42.22 and Sig. = 0.000 < 0.05 (alpha).
Figure 3: Reasons to injuries between/within flooded villages and less flooded ones
Social Impacts:
1. It is evidently that 2007 floods caused severely impacts on main and secondary occupations of local people as the local livelihood largely embedded in natural resources-based practices.
Figure 4: Floods and severe impacts on main&secondary occupation
3 1 6 8 1 1 7 1 3 1 2 1 6 0 0 6 0 2 7 0 5 1 0 1 5 2 0 2 5 3 0 Fall Drw onin g Hit / pun ctur ed b y ob ject Fire /bur n Vio lenc e Ani mal bite s Got som ethi ng fa llen upon R e as o n o f in jurie s P e rc en t F loo d e d villa ge L e s s -flo o d e d villa ge s 14 13 6 6 19 18 29 19 37 26 44 34 28 38 19 35 1 5 2 6 0% 20% 40% 60% 80% 100% A ffec ted to s ec o nd a ry -o cc up a tio n in les s flo o de d v illa ge s A ffec ted to s ec o nd a ry oc cu p atio n in flo o de d v illa g es A ffec te d ma in -o cc u pa tion in les s floo d ed v illag es A ffec te d ma in o cc up a tion in flo o d ed v illag es
Key Findings
HCE TEAM Country: Vietnam
Site: Quang Nam province disaster studied: Floods in November, 2007.
Map of Vietnam
Map of Quang Nam
Summary
Statistics
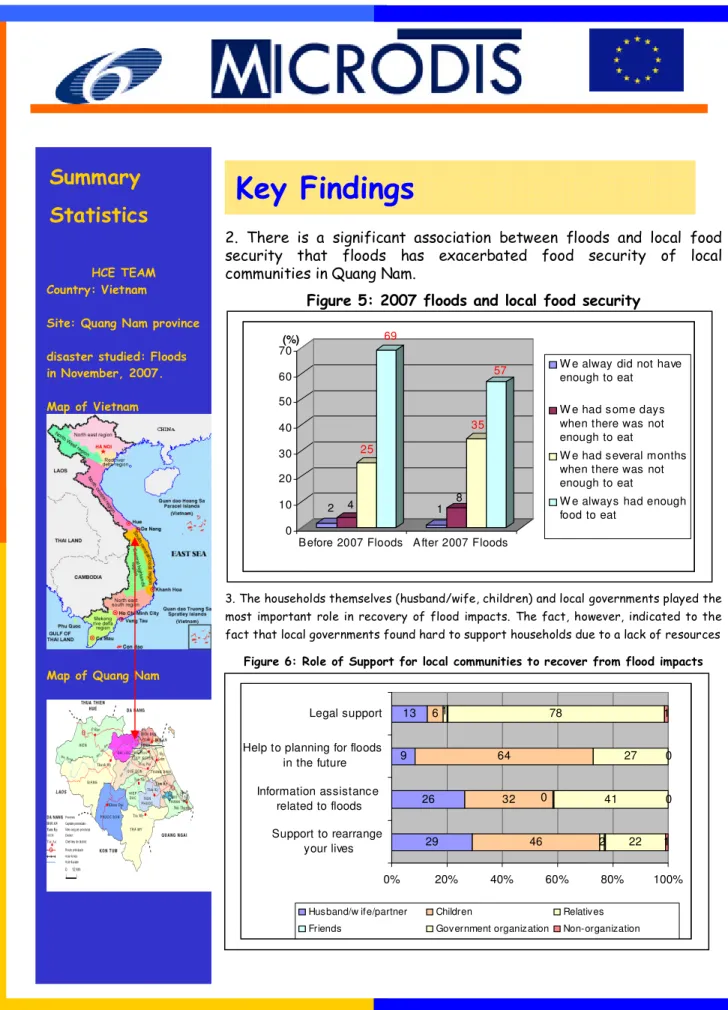
2. There is a significant association between floods and local food security that floods has exacerbated food security of local communities in Quang Nam.
Figure 5: 2007 floods and local food security
3. The households themselves (husband/wife, children) and local governments played the most important role in recovery of flood impacts. The fact, however, indicated to the fact that local governments found hard to support households due to a lack of resources
Figure 6: Role of Support for local communities to recover from flood impacts
2 4 25 69 1 8 35 57 0 10 20 30 40 50 60 70(%)
B efore 2007 Floods A fter 2007 Floods
W e alway did not have enough to eat W e had s ome days when there was not enough to eat
W e had s everal months when there was not enough to eat
W e always had enough food to eat 29 26 9 13 46 32 64 6 21 22 41 27 78 1 0 0 1 1 0 0% 20% 40% 60% 80% 100% Support to rearrange your lives Information assistance related to floods Help to planning for floods
in the future Legal support
Husband/w ife/partner Children Relatives
Key Findings
HCE TEAM Country: Vietnam
Site: Quang Nam province disaster studied: Floods in November, 2007.
Map of Vietnam
Map of Quang Nam
Summary
Statistics
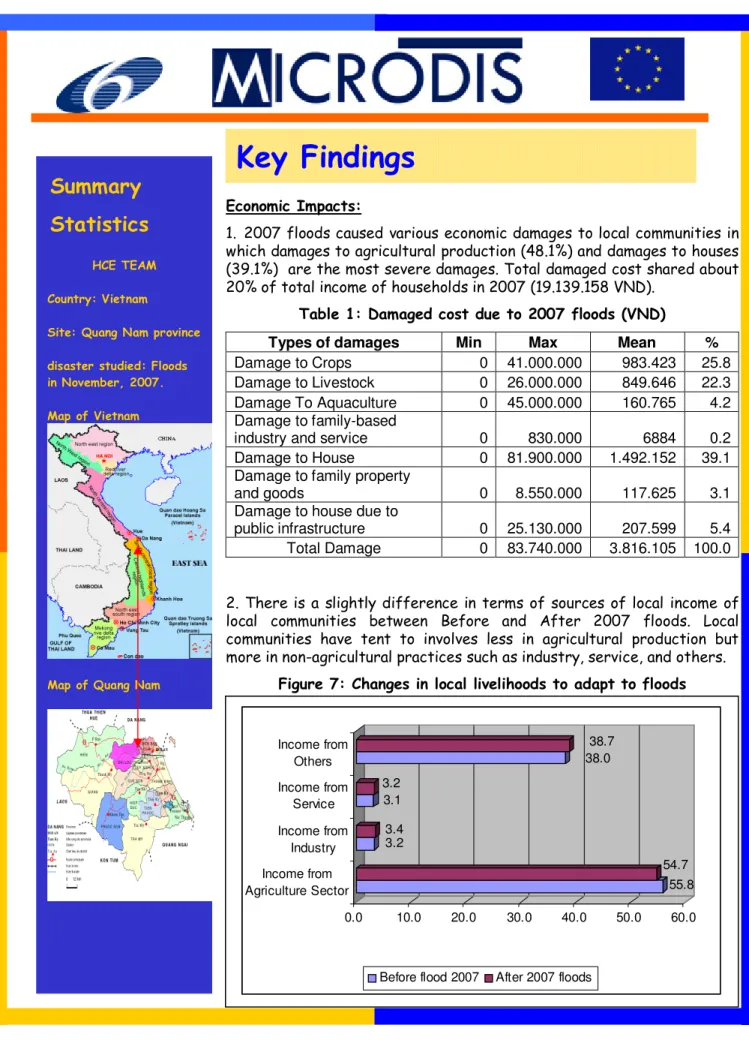
Economic Impacts: 1. 2007 floods caused various economic damages to local communities in
which damages to agricultural production (48.1%) and damages to houses (39.1%) are the most severe damages. Total damaged cost shared about 20% of total income of households in 2007 (19.139.158 VND).
Table 1: Damaged cost due to 2007 floods (VND)
Types of damages Min Max Mean %
Damage to Crops 0 41.000.000 983.423 25.8
Damage to Livestock 0 26.000.000 849.646 22.3
Damage To Aquaculture 0 45.000.000 160.765 4.2 Damage to family-based
industry and service 0 830.000 6884 0.2
Damage to House 0 81.900.000 1.492.152 39.1
Damage to family property
and goods 0 8.550.000 117.625 3.1
Damage to house due to
public infrastructure 0 25.130.000 207.599 5.4 Total Damage 0 83.740.000 3.816.105 100.0
2. There is a slightly difference in terms of sources of local income of local communities between Before and After 2007 floods. Local communities have tent to involves less in agricultural production but more in non-agricultural practices such as industry, service, and others.
Figure 7: Changes in local livelihoods to adapt to floods
55.8 54.7 3.2 3.4 3.1 3.2 38.0 38.7 0.0 10.0 20.0 30.0 40.0 50.0 60.0 Income from Agriculture Sector Income from Industry Income from Service Income from Others
Key Findings
HCE TEAM Country: Vietnam
Site: Quang Nam province disaster studied: Floods in November, 2007.
Map of Vietnam
Map of Quang Nam
Summary
Statistics
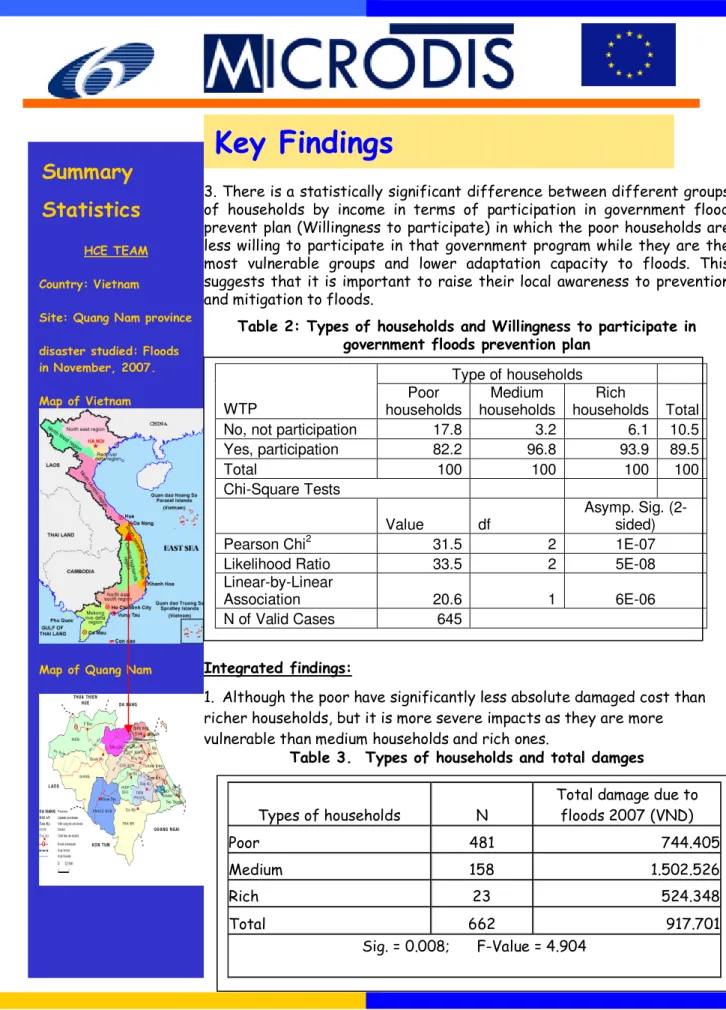
3. There is a statistically significant difference between different groups of households by income in terms of participation in government flood prevent plan (Willingness to participate) in which the poor households are less willing to participate in that government program while they are the most vulnerable groups and lower adaptation capacity to floods. This suggests that it is important to raise their local awareness to prevention and mitigation to floods.
Table 2: Types of households and Willingness to participate in government floods prevention plan
Integrated findings:
1. Although the poor have significantly less absolute damaged cost than richer households, but it is more severe impacts as they are more vulnerable than medium households and rich ones.
Table 3. Types of households and total damges
Type of households WTP Poor households Medium households Rich households Total
No, not participation 17.8 3.2 6.1 10.5
Yes, participation 82.2 96.8 93.9 89.5 Total 100 100 100 100 Chi-Square Tests Value df Asymp. Sig. (2-sided)
Pearson Chi2 31.5 2 1E-07
Likelihood Ratio 33.5 2 5E-08
Linear-by-Linear
Association 20.6 1 6E-06
N of Valid Cases 645
Types of households N
Total damage due to floods 2007 (VND) Poor 481 744.405 Medium 158 1.502.526 Rich 23 524.348 Total 662 917.701 Sig. = 0.008; F-Value = 4.904
Key Findings
HCE Team
Country: Vietnam
Site: Quang Nam province disaster studied: Floods in November, 2007.
Map of Vietnam
Map of Quang Nam
Summary
Statistics
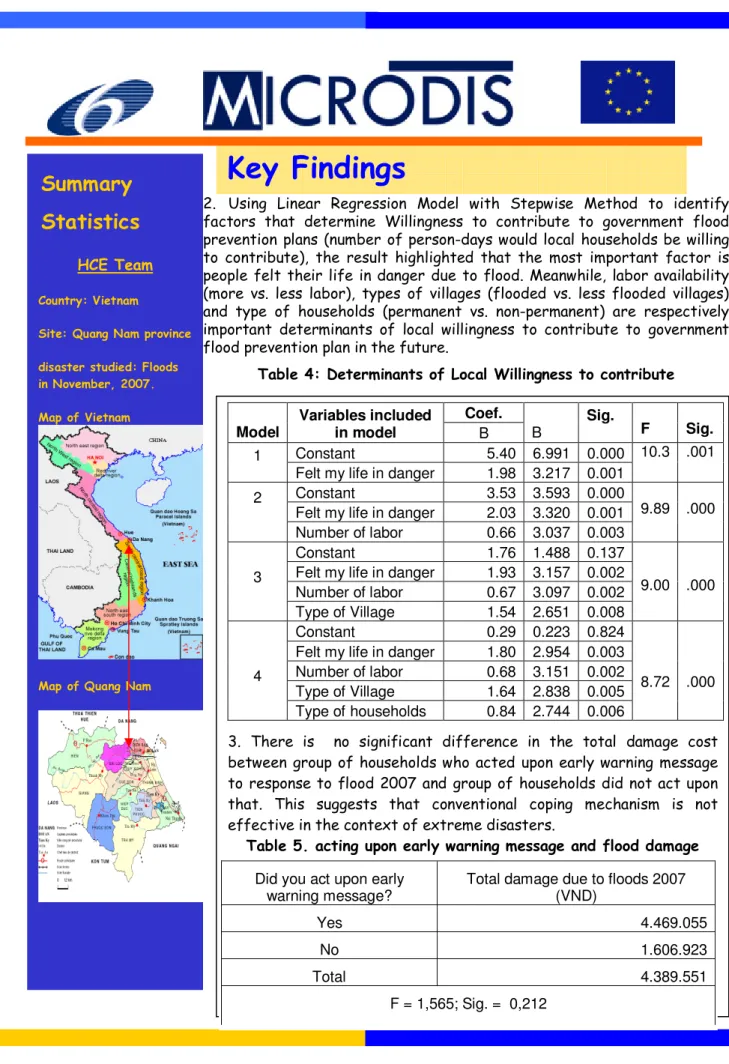
2.factors that determine Willingness to contribute to government flood Using Linear Regression Model with Stepwise Method to identify prevention plans (number of person-days would local households be willing to contribute), the result highlighted that the most important factor is people felt their life in danger due to flood. Meanwhile, labor availability (more vs. less labor), types of villages (flooded vs. less flooded villages) and type of households (permanent vs. non-permanent) are respectively important determinants of local willingness to contribute to government flood prevention plan in the future.
Table 4: Determinants of Local Willingness to contribute
Coef. Model Variables included in model B B Sig. F Sig. Constant 5.40 6.991 0.000 1
Felt my life in danger 1.98 3.217 0.001
10.3 .001
Constant 3.53 3.593 0.000
Felt my life in danger 2.03 3.320 0.001 2
Number of labor 0.66 3.037 0.003
9.89 .000
Constant 1.76 1.488 0.137
Felt my life in danger 1.93 3.157 0.002 Number of labor 0.67 3.097 0.002 3
Type of Village 1.54 2.651 0.008
9.00 .000
Constant 0.29 0.223 0.824
Felt my life in danger 1.80 2.954 0.003 Number of labor 0.68 3.151 0.002 Type of Village 1.64 2.838 0.005 4
Type of households 0.84 2.744 0.006
8.72 .000
3. There is no significant difference in the total damage cost between group of households who acted upon early warning message to response to flood 2007 and group of households did not act upon that. This suggests that conventional coping mechanism is not effective in the context of extreme disasters.
Table 5. acting upon early warning message and flood damage
Did you act upon early warning message?
Total damage due to floods 2007 (VND)
Yes 4.469.055
No 1.606.923
Total 4.389.551