© 2011. Chittu.V,N.Sumathi.This is a research/review paper, distributed under the terms of the Creative Commons Attribution-Noncommercial 3.0 Unported License http://creativecommons.org/licenses/by-nc/3.0/), permitting all non-commercial use, distribution, and reproduction in any medium, provided the original work is properly cited.
Global Journal of Computer Science and Technology
Volume 11 Issue 2 Version 1.0 February 2011Type: Double Blind Peer Reviewed International Research Journal Publisher: Global Journals Inc. (USA)
Online ISSN: 0975-4172 & Print ISSN: 0975-4350
A Modified Genetic Algorithm Initializing K-Means Clustering
By Chittu.V,N.Sumathi
Coimbatore, Tamil Nadu,India
Abstracts
-
In this paper, a new clustering algorithm is proposed called Modified Genetic
Algorithm Initializing KM (MGAIK). MGAIK is inspired by the Genetic Algorithm as an initialization
method for K-means clustering but features several improvement over GAIK. The experiment
indicates that, while K-Means algorithm converges to local minima and in its initialization step
where it is normally done randomly, both MGAIK and GAIK always converge to global optimum
eventually but MGAIK, a natural way to speed up GA processes is to evaluate the individuals in
parallel rather than sequentially.Simple genetic algorithm (GA) involves only one initial population
with fixed genetic operational parameters selected in advance. This paper presents a modified
genetic algorithm (MGA) with multiple subpopulations and dynamic parameters. To show the
effectiveness and efficiency of the algorithms, a comparative study was done among K-means,
GAIK and MGAIK.
Keywords :
Clustering, Genetic Algorithms, K-means, Global optimization, Subpopulation,
Dynamic Parameters.
Classification:
GJCST H.3.3
A Modified Genetic Algorithm Initializing K-Means Clustering
A Modified Genetic Algorithm Initializing
K-Means Clustering
Chittu.V1, N.Sumathi2
Abstract: In this paper, a new clustering algorithm is proposed called Modified Genetic Algorithm Initializing KM (MGAIK). MGAIK is inspired by the Genetic Algorithm as an initialization method for K-means clustering but features several improvement over GAIK. The experiment indicates that, while K-Means algorithm converges to local minima and in its initialization step where it is normally done randomly, both MGAIK and GAIK always converge to global optimum eventually but MGAIK, a natural way to speed up GA processes is to evaluate the individuals in parallel rather than sequentially.Simple genetic algorithm (GA) involves only one initial population with fixed genetic operational parameters selected in advance. This paper presents a modified genetic algorithm (MGA) with multiple subpopulations and dynamic parameters. To show the effectiveness and efficiency of the algorithms, a comparative study was done among K-means, GAIK and MGAIK.
Keywords:Clustering, Genetic Algorithms, K-means, Global optimization, Subpopulation, Dynamic Parameters.
lustering is similar to classification except that the groups are not predefined, but rather defined by the data alone [8]. Clustering is alternatively referred to as unsupervised learning or segmentation. It can be thought of as partitioning or segmenting the data into groups that might or might not be disjointed. The clustering is usually accomplished by determining the similarity among the data on predefined attributes. The most similar data are grouped into clusters.K-means is considered one of the major algorithms widely used in clustering. KM is used to converge to local minima and its result is based on the initialization process, which randomly generates the initial clustering [11]. In other words different runs of KM on the same input data might produce different results.
Genetic Algorithms (GAs) are adaptive heuristic search algorithms based on the evolutionary ideas of natural selection and genetics. As such they represent an intelligent exploitation of a random search used to solve optimization problems. Although randomized, GAs are
About1:Asst.Prof, Department of Computer Science, SNR Sons
college(Autonomous), Coimbatore, Tamil Nadu,India
About2: Asso.Prof, Department of Computer Applications, SNR Sons
college(Autonomous), Coimbatore, Tamil Nadu,India
by no means random, instead they exploit historical information to direct the search into the region of better performance within the search space. The basis for evolutionary computing algorithm is biological evolution, where over time evolution produces the best or “fittest” individuals [10].
GAs simulates the survival of the fittest among individuals over consecutive generation for solving a problem. Each generation consists of a population of character strings that may be identified by a complete encoding of the DNA structure. In general they start with an initial population, and then a new population is generated based on the survival of fittest, used to determine the best individuals in a population. Crossover technique generates new individuals by switching subsequences of the strings. Mutation processes sometimes appear where randomly changes characters in the offspring. This process continues until a generation where its fitness evolves to predefined threshold or after a specific number of generations.
A number of researches have proposed a genetic algorithm for clustering where these are insensitive to the initialization process and always converge to global optimum eventually [6, 9, 10]. The objective of this paper is to show the feasibility of applying genetic algorithms as an initialization method for the KM clustering technique, and build a new model to improve the quality of the clustering and to reduce the upcoming error. Section III explains the proposed method with architecture. In Section IV the experimental results are compared and Suggestions are made in Section V.
Clustering [7] has been used in many application domain including market research, pattern recognition, data analysis, image processing, machine learning and statistics. The process of grouping a set of physical or abstract objects into classes of similar objects is called clustering. A cluster is a collection of data objects that are similar to one another within the same cluster and are dissimilar to the objects in another cluster [3, 8]. Clustering means grouping of data or dividing a large data set into smaller data sets of some similarity. A clustering algorithm attempts to find natural groups of components (or data) based on some similarity. Also,
C
55©2011 Global Journals Inc. (US)
Feb rua ry 2011 G lo ba l J ou rn al o f C om pu te r Sc ie nc e an d Te chn ol og y Vo lu m e X I Is su e II Ve rs io n I
the clustering algorithm finds the centroid of a group of data sets. To determine cluster membership, most algorithms evaluate the distance between a point and the cluster centroids. The output from a clustering
algorithm is basically a statistical description of the cluster centroids with the number of components in each cluster.
Fig.1 Stages in Clustering Clustering is also called data segmentation in some
applications because clustering partitions large data sets into groups according to their similarity.Generally, the distance between two points is taken as a common metric to assess the similarity among the instances of a population. The commonly used distance measure is the Euclidean metric which defines the distance between two points P= (x1(P), x2(P)…) and Q = (x1(Q), x2(Q)…) is given by:
There are several standard alternatives to calculate the distance between clusters [8]. Single-link clustering (also called the connectedness or minimum method) considers the distance between one cluster and another cluster to be equal to the shortest distance from any member of one cluster to any member of the other cluster. If the data consist of similarities, it considers the similarity between one cluster and another cluster to be equal to the greatest similarity from any member of one cluster to any member of the other cluster. Complete-link clustering (also called the diameter or maximum method) considers the distance between one cluster and another cluster to be equal to the longest distance from any member of one cluster to any member of the other cluster. Average-link clustering considers the distance between one cluster and another cluster to be equal to the average distance from any member of one cluster to any member of the other cluster. Clustering algorithms can be categorized into partitioning methods, construct various partitions and then evaluate them by some criterion, e.g., minimizing the sum of square errors [11]. Typical methods: k-
means, k-medoids, CLARANS. Hierarchical methods, Create a hierarchical decomposition of the set of data (or objects) using some criterion typical methods: Diana, Agnes, BIRCH, ROCK, CAMELEON. The K-means algorithm is one of the popular techniques where it attempts to solve the clustering problem by optimizing a given metric [1].
1) K-Means Clustering
K-means [9] is an iterative clustering algorithm in which items are moved among set of clusters until the desired set is reached. It may be viewed as a type of squared error algorithm, although the convergence algorithm need to be defined based on the squared error. A high degree of similarity among elements in clusters is obtained, while a high degree of dissimilarity among elements in different clusters is achieved simultaneously. The K-means algorithm takes the input parameter, k, and partitions a set of n objects into k clusters so that the resulting intracluster similarity is high but the intercluster similarity is low. Cluster similarity is measured in regard to the mean value of the objects in a cluster, which can be viewed as the cluster‟s centroid or center of gravity.
The K-means algorithm classifies objects to a predefined number of clusters, which is specified by the user. First, it randomly selects k of the objects, each of which initially represents a cluster mean or center. For each of the remaining objects, an object is assigned to the cluster to which it is the most similar, based on the distance between the object and the cluster mean. It then computes the new mean for each cluster. This process iterates until the criterion function converges. Algorithm: k-means. The k-means algorithm for partitioning, where each cluster‟s center is represented by the mean value of the objects in the cluster.
2 1 2 2 )) ( ) ( ( ... )) ( 2 ) ( 2 ( )) ( 1 ) ( 1 ( ) , ( Q xj P xj Q x P x Q x P x Q P d p j 56
©2011 Global Journals Inc. (US)
Feb rua ry 2011 G lo ba l J ou rn al o f C om pu te r Sc ie nc e an d Te chn ol og y Vo lu m e X I Is su e II Ve rs io n I
The problem of K-means algorithm is sensitive to outliers, since an object with an extremely large value may substantially distort the distribution of the data. It is applicable only when mean is defined, then not in the case of categorical data. There is a need to specify k, the number of clusters, in advance. The other drawback of K-means is that, often terminates at a local optimum, and in its initialization step where it is normally done randomly [1, 3]. To improve the performance of the underlying algorithms by fixing their weaknesses, a special technique can be applied called genetic algorithm.
2) Genetic Algorithm
Genetic algorithms [2] are examples of evolutionary computing methods and are optimization type algorithms. It is a directed search algorithms based on the mechanics of biological evolution, developed by John Holland, University of Michigan (1970‟s). Given a population of potential problem solutions (individuals,
evolutionary expands this population with new and potentially better solutions. It provides efficient, effective techniques for optimization and machine learning applications. The basis for evolutionary computing algorithm is biological evolution, where over time evolution produces the best or fittest individuals. In a genetic algorithm, a population of strings (called chromosomes or the genotype of the genome), which encode candidate solutions (called individuals, creatures, or phenotypes) to an optimization problem, evolves toward better solutions. Traditionally, solutions are represented in binary as strings of 0s and 1s, but other encodings are also possible. The evolution usually starts from a population of randomly generated individuals and happens in generations. In each generation, the fitness of every individual in the population is evaluated, multiple individuals are stochastically selected from the current population (based on their fitness), and modified (recombined and possibly randomly mutated) to form a new population. The new population is then used in the next iteration of the algorithm. Commonly, the algorithm terminates when either a maximum number of generations has been produced, or a satisfactory fitness level has been reached for the population [4]. Fig. 3. Shows the basic structures for GAs.
Input:
K: The number of clusters,
D: A data set containing n objects. Output: A set of k clusters.
Method:
(1) Arbitrarily choose k objects from D as the initial cluster centers;
(2) Repeat
(3) (re)assign each object to the cluster to which the object is the most similar, based on the mean value of the objects in the cluster;
(4) Update the cluster means, i.e., calculate the mean value of the objects for each cluster; (5) Until no change; 57
©2011 Global Journals Inc. (US)
Feb rua ry 2011 G lo ba l J ou rn al o f C om pu te r Sc ie nc e an d Te chn ol og y Vo lu m e X I Is su e II Ve rs io n I
Fig 3. The general structure for GAs
3)
Ga – Clustering Algorithm
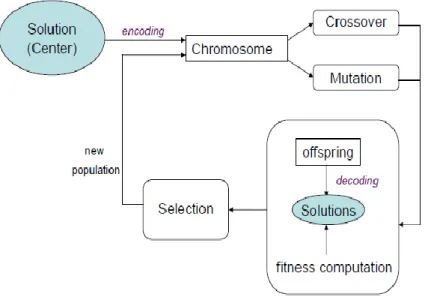
In this paper, GA is used for the purpose of finding the fixed number k of clusters, where GA is executed first to give initial values to K-means to start with rather than choosing random ones and expected to minimize the number of iterations that K-means needs in order to converge to local minima. Fig. 4 shows the basic steps for GA [5].Using GAs [5, 11] into clustering, an initial population of random cluster is set. The K cluster centers encoded in each chromosome are initialized to K randomly chosen points from the data set. This process is repeated for each of the P chromosomes in the population, where P is the size of the population. At each generation, each individual is evaluated on the basis of its fitness. New individuals can be created using two main genetic operators are crossover and mutation.
Fig. 4. Basic steps in GAs.
Before GA is run, a way must be found of encoding any potential solution to the problem. This could be as a string of real numbers or, as is more typically the case, a binary bit string. At the beginning of a run of a genetic algorithm a large population of random chromosomes is created. Each one, when decoded will represent a different solution to the problem at hand. Let's say there are N chromosomes in the initial population. Then, each chromosome is tested to see how good it is at solving the problem at hand and assign an fitness score accordingly. The fitness score is a measure of how good that chromosome is at solving the problem to hand. Select two members from the current population. The chance of being selected is proportional to the chromosomes fitness. Roulette wheel selection is a commonly used method. Dependent on the crossover rate crossover the bits from each chosen chromosome at a randomly chosen point. Step through the chosen chromosomes bits and flip dependent on the mutation rate. Repeat the process until a new population of N members has been created.
Crossover operates by selecting a random location in the genetic string of the parents (crossover point) and concatenating the initial part of one parent with the final part of the second parent to create a new child. A second child is simultaneously created by the remaining parts of the two parents. Different types of crossover are single point, Two points, Uniform, etc. The mutation operation randomly changes characters in the offspring. Mutation is applied after the crossover with a low probability in the range 0.001 and 0.01 and modifies elements in the chromosomes. Mutation causes movements in the search space (local to global). It restores lost information to the population.
Begin 1. t=0 2. Initialize population p(t) 3. Compute fitness p(t) 4. t=t+1 5. if termination criterion achieved go to step 10 6. select p(t) from p(t-1) 7. crossover p(t) 8. mutate p(t) 9. go to step 3
10. output best and stop End 58
©2011 Global Journals Inc. (US)
Feb rua ry 2011 G lo ba l J ou rn al o f C om pu te r Sc ie nc e an d Te chn ol og y Vo lu m e X I Is su e II Ve rs io n I
This paper presents a Modified Genetic algorithm Initializing KM (MGAIK) with multiple subpopulations and dynamic parameters [14]. Simple genetic algorithm (GA) involves only one initial population with fixed genetic operational parameters selected in advance and it requires more time for distance calculations and crossovers in each generation than K-means needs in one iteration. To solve the drawback of GAs, a new technique is proposed in this paper called Modified Genetic algorithm MGA, with multiple subpopulations and dynamic parameters, a natural way to speed up GA processes is to evaluate the individuals in parallel rather than sequentially.
1) Modified Genetic Algorithm (Mga)
In a simple GA, there is only one population in each generation and all the genetic operations are applied on it. It may require hundreds or thousands of function evaluation to solve a problem that is very time consuming. A natural way to speed up GA processes is to evaluate the individuals in parallel rather than sequentially. It uses a simple master-slave approach where one processor is the master, stores a single population and the other processors are the slaves, evaluate the individuals based on mutation and crossover operation. However the result of parallel GA is
the same as the sequential GA. Here, populations are split into separated subpopulations to keep diversity in the course of optimization process. The number of subpopulations is involved in parallel and an exchange of individuals between subpopulations is also performed periodically to obtain the good individuals through the set of subpopulations. The exchange is performed by means of migration operator. Migration of individuals between different subpopulations followed by application of genetic operators obtains generation of new individuals. The rate of migration allows the algorithm to control the level of diversity to be maintained inside the subpopulation.
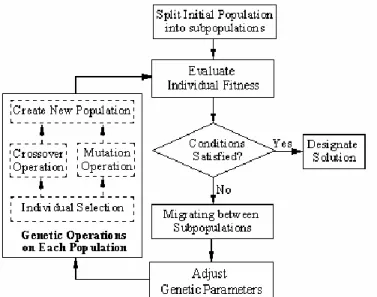
Here, the genetic operational parameters, specifically crossover probability and mutation probability are designed in a dynamic way on the basis of selected adjustment functions [13, 14]. At the beginning of the evolution process, bigger crossover probability and mutation probability are used to search the solution space quickly and increase the diversity of population. As the number of generations get bigger and bigger, the values of the genetic operator become smaller and smaller controlled by a mono-decreasing adjustment function, to keep the evolution process stable and finally converge to global optimum. Fig 5. Shows the structure of modified genetic algorithm. The steps of the algorithm are given below.
Fig 5. Diagram of modified genetic algorithm
Step 1: Code the problem with parameters as a form of sting: In this, binary coding method is used to transfer the parameter from problem space into coding space. The length of the code could be determined by
Where and denote the maximum value and minimum value of the variables respectively, and σ
is the precision required.
Step 2: Define individual fitness function: Fitness is always determined by the objective function. In this experiment, the individuals are sorted by objective values, pi denotes the order position of individual i and
59
©2011 Global Journals Inc. (US)
Feb rua ry 2011 G lo ba l J ou rn al o f C om pu te r Sc ie nc e an d Te chn ol og y Vo lu m e X I Is su e II Ve rs io n I
Q is the total number of individuals. The fitness of individual i denoted by fitness (i) is given by:
Step 3: Parameters design: Including the maximum value of the total number of generations, denoted by T; the size of each subpopulation, denoted by N; the number of subpopulations, denoted by M; the rate of migration, denoted by r; the probability of selection, denoted by s; and the probabilities of crossover and mutation, denoted by c and m respectively. At present, there is no guidance to be used to determine the values of M and N. In a general speaking, if the values of M and N are bigger, the quality of the solution may be higher, but the process of the evolution may be longer. The recommended values of MGA are: 3≤M≤8, N≈10 (L+n), where n is the number of variables.
The probability of selection of the i-th individual depends on the rate si, which is proportional to its degree of fitness, that is
While selection probability is set as a constant, crossover probability and mutation probability are changed dynamically. The rule of the crossover probability and mutation probability design is “the larger, the earlier” or “the smaller, the later”. The adjustment functions mj and cj are given by following equations
where t is the number of the current generation, aj and bj are the initial values mj and cj forthe j-th subpopulation respectively, Tj is a scaling constant number larger than or equal to T. Note from equation (4) and (5) that the values of mj and cj start from aj and bj respectively, and then decrease gradually with limitation zero in the process of evolution.
Step 4: Create initial populations randomly.
Step 5: Decode populations and evaluate individual fitness.
Step 6: Transfer information between subpopulations and exchange their individuals. The individuals with the highest performance in subpopulation i, i = 1… N-1, will be copied and substitute the individuals with the lowest performance in subpopulation i+1.
Step 7: Calculate crossover probability and mutation probability by their adjustment functions.
Step 8: Perform all the genetic operations, including selection, crossover and mutation, on each subpopulation and create new generations.
Step 9: Assess whether the terminating condition (t ≤ T) satisfied or not: If yes, stop the algorithm; otherwise, return to step five.
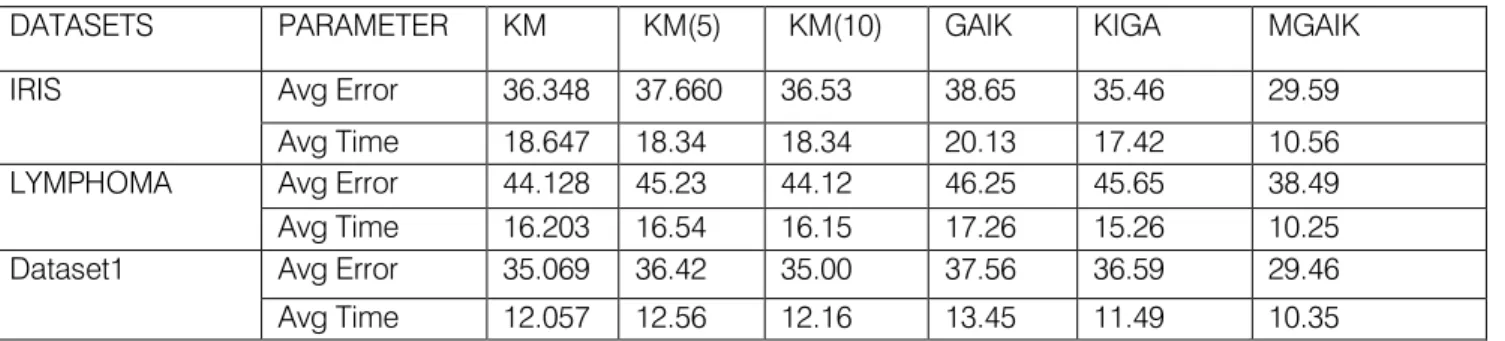
The experimental results comparing the MGAIK with the K-means, GAIK, KIGA algorithms are provided for one artificial data set(Dataset 1) and two real-life data sets(Iris, Lymphoma) respectively. These are first described below:Dataset 1: Dataset 1 is made based on a mathematical model to form their clusters with small amount of points interleaving. Dataset 1 Consists of 100 points scattered around 4 specific points with a radius of 0.2. Points are (0.125, 0.25), (0.625, 0.25), (0.375, 0.75), (0.875, 0.75). The first two points‟ clusters have horizontal interleaving on the boundary. In addition, points two and three have the same thing in common. This dataset is to be clustered into 4 clusters. Iris data: This data represents different categories of irises having four feature values, which represents the length and the width of sepal and petal, in centimeters. It has three classes with 50 samples per class. The value of k is therefore chosen to be three of this data. Lymphoma data: The Lymphoma data set is a data set about the three most prevalent adult lymphoid malignancies. It contains 62 samples consisting of 4,026 genes spanning three classes, which include 42 Diffuse Large B-Cell Lymphoma (DLBCL) samples, nine Follicular Lymphoma (FL) samples, and 11 B-cell Chronic Lymphocytic Leukemia (B-CLL) samples. This dataset is to be grouped into 3 clusters. In addition, for each dataset running K-means for 5 or 10 iterations only in addition to running it is tested until it satisfies its original termination condition. Also, the number of GA generations for testing to 1000 generations is fixed at most, and then the fittest generation is considered as the error rate. Each dataset was tested for each algorithm for 20 times and then we calculated the average time and error as listed in Table I.As shown in Table 1, for each dataset, specific number of clusters is considered. Moreover, Average Error and Average Time are listed to show the trade-off between them. From the table it is observed that, KM is not the most accurate approach, as the average error of KM is quite high. Moreover, initializing KM using GA will definitely lead it to fall early into local minima. Thus GA is not a good approach to solve the clustering problem due to its probabilistic nature. Even though mutations help not to fall into local minima, it still needs a lot of time and computations to find the global one. The average error and average time taken by the GAIK approach is quite high. Finally, running KM as an initializer to MGA definitely guides to the best solution among the group, this appears clearly from the results obtained after running it for 5 or 10 iterations before GA starts.The graph of the Fig 6(a) and Fig 6(b) gives a comparison
60
©2011 Global Journals Inc. (US)
Feb rua ry 2011 G lo ba l J ou rn al o f C om pu te r Sc ie nc e an d Te chn ol og y Vo lu m e X I Is su e II Ve rs io n I
of benchmark datasets of various methods(KM, GAIK,
KIGA, MGAIK) where the average error rate and average time of proposed method MGAIK shows very less compared to other methods.
Table 1
Performance Evaluation
Fig. 6 (a) Average Error Rate
Fig. 6 (b) Average Time
The experimental evaluation scheme was used to provide a common base of performance assessment and comparison with other methods. From the experiments on the dataset 1, iris and lymphoma dataset, it is observed that proposed approach using the modified genetic algorithms work well and yield meaningful and useful results in terms of finding good clustering configurations which contain interdependence information within clusters and discriminative information
for clustering. In addition, the proposed approach is meaningful in selecting significant centers, from each cluster. Finally, when comparing the experimental results of K-Means, GAIK and MGAIK it is observed clearly that MGAIK is better than the simple genetic algorithm. The average time and error rate are very less compared to KIGA and GAIK. As shown by the results on all datasets MGAIK is ready to achieve high clustering accuracy if compared to other algorithms.
1) P. Bradley, and U. Fayyad, ”Refining Initial Points for K-Means Clustering,” In Proceeding of 15th International Conference on Machine Learning, 1998, pp.91-99.
2) P. Chi, “Genetic Search with Proportion Estimation”, In proceedings of the Third Int. Con. on Genetic Algorithms (ICGA), San Mateo, California, 1989, pp. 92-97.
3) U. Fayyad, C. Reina, and J. Bradley, Initialization of iterative refinement clustering algorithms”, In proceedings of Fourth Int. Con. On Knowledge Discovery and Data Mining, AAAI, pp.194-198, 1998.
4) D.Goldberg,”Genetic Algorithms In Search Optimization, And Machine Learning,”Addison-Wesley, New York,1989.
5) K.Krishna, and M.Murty,”Genetic K-Means Algorithm,”IEEE Transactions on Systems, Vol.29, NO.3, 1999, pp.433-439.
6) Y. Lu, S. Lu, F. Fotouhi, Y. Deng, and S. Brown, “FGKA: A Fast Genetic K-Means Clustering Algorithm,” ACM Symposium on Applied Computing, 2004.
7) L. Hall, B. Ozyurt, and J. Bezdek, “Clustering With A Genetically Optimized Approach,” IEEE Transactions on Evolutionary computation, Vol. 3, No. 2, 1999, pp 103-112. 0 10 20 30 40 50 Er ro rr a te(% ) KM GAIK KIGA MGAIK 0 5 10 15 20 25 A ve ra ge Ti m e (s ec ) KM GAIK KIGA MGAIK
DATASETS PARAMETER KM KM(5) KM(10) GAIK KIGA MGAIK
IRIS Avg Error 36.348 37.660 36.53 38.65 35.46 29.59 Avg Time 18.647 18.34 18.34 20.13 17.42 10.56 LYMPHOMA Avg Error 44.128 45.23 44.12 46.25 45.65 38.49 Avg Time 16.203 16.54 16.15 17.26 15.26 10.25 Dataset1 Avg Error 35.069 36.42 35.00 37.56 36.59 29.46 Avg Time 12.057 12.56 12.16 13.45 11.49 10.35 61
©2011 Global Journals Inc. (US)
Feb rua ry 2011 G lo ba l J ou rn al o f C om pu te r Sc ie nc e an d Te chn ol og y Vo lu m e X I Is su e II Ve rs io n I
8) J. Han, and M. Kamber, “Data Mining: Concepts And Techniques,” Morgan Kaufmann Publishers, 2001.
9) Bashar Al-Shboul, and Sung-Hyon Myaeng, ”Initializing K-Means Using Genetic Algorithms,” World Academy of Science, Engineering and Technology 54 2009.
10) Y. Lu, S. Lu, F. Fotouhi, Y. Deng, and S. Brown, “Incremental Genetic K-Means Algorithm And Its Application In Gene Expression Data Analysis,” BMC Bioinformatics, 2004.
11) U.Maulik, and S.Bandyopadhyay,”Genetic Algorithm-Based Clustering Technique”, Pattern Recognition 33, 1999, pp.1455-1465.
12) J. Pena, J. Lozano, and P. Larranaga, “An Empirical Comparison of Four Initialization Methods For The K-Means Algorithm,” Pattern Recognition Letters, Vol. 20 No. 10, 1999, pp. 1027-10.
13) Siarry,P., A.Petrowski and M.Bessaou, “A multiple population genetic algorithm aimed at multimodal optimization” Advances in Engineering Software 33(2002)207-213.
14) Rongjun Li, and Xianying Chang,” A Modified Genetic Algorithm with Multiple Subpopulations And Dynamic Parameters Applied in CVAR model”, IEEE Transactions on Intelligent Agents, Web Technologies and Internet Commerce, 2006.
62
©2011 Global Journals Inc. (US)
Feb rua ry 2011 G lo ba l J ou rn al o f C om pu te r Sc ie nc e an d Te chn ol og y Vo lu m e X I Is su e II Ve rs io n I