Transforming
the High School
Experience
How New York City’s New Small Schools Are
Boosting Student Achievement and Graduation Rates
Howard S. Bloom Saskia Levy Thompson Rebecca unterman
Transforming the High School Experience
How New York City’s New Small Schools Are Boosting
Student Achievement and Graduation Rates
By
Howard S. Bloom
Saskia Levy Thompson
Rebecca Unterman
with
Corinne Herlihy
Collin F. Payne
Funding for this report was provided by the Bill & Melinda Gates Foundation.
Dissemination of MDRC publications is supported by the following funders that help finance MDRC’s public policy outreach and expanding efforts to communicate the results and implications of our work to policymakers, practitioners, and others: The Ambrose Monell Foundation, The Annie E. Casey Foundation, Carnegie Corporation of New York, The Kresge Foundation, Sandler Founda-tion, and The Starr Foundation.
In addition, earnings from the MDRC Endowment help sustain our dissemination efforts. Contrib-utors to the MDRC Endowment include Alcoa Foundation, The Ambrose Monell Foundation, An-heuser-Busch Foundation, Bristol-Myers Squibb Foundation, Charles Stewart Mott Foundation, Ford Foundation, The George Gund Foundation, The Grable Foundation, The Lizabeth and Frank Newman Charitable Foundation, The New York Times Company Foundation, Jan Nicholson, Paul H. O’Neill Charitable Foundation, John S. Reed, Sandler Foundation, and The Stupski Family Fund, as well as other individual contributors.
The findings and conclusions in this report do not necessarily represent the official positions or poli-cies of the funders.
For information about MDRC and copies of our publications, see our Web site: www.mdrc.org. Copyright © 2010 by MDRC.® All rights reserved.
Overview
Since 2002, New York City has closed more than 20 underperforming public high schools, opened more than 200 new secondary schools, and introduced a centralized high school admissions process in which approximately 80,000 students a year indicate their school pref-erences from a wide-ranging choice of programs. At the heart of these reforms lie 123 new “small schools of choice” (SSCs) — small, academically nonselective, four-year public high schools for students in grades 9 through 12. Open to students at all levels of academic achieve-ment and located in historically disadvantaged communities, SSCs were intended to be viable alternatives to the neighborhood high schools that were closing.
SSCs are more than just small. They were authorized through a demanding competitive proposal process designed to stimulate innovative ideas for new schools by a range of stakehold-ers and institutions, from educators to school reform intermediary organizations. The resulting schools emphasize strong, sustained relationships between students and faculty. Each SSC also received start-up funding as well as assistance and policy protections from the district and other key players to facilitate leadership development, hiring, and implementation.
The first step in New York City’s high school admissions process is to require eighth-graders to select in rank order of priority up to 12 high schools that they want to attend; when an SSC has more applicants than spaces, the district uses a lottery-like process to randomly assign students to the SSC or to another school in the district. These lotteries provide the basis for an unusually large and rigorous study, supported by the Bill & Melinda Gates Foundation, of the effects of SSCs on students’ academic achievement.
This report presents encouraging findings from that study, providing clear and reliable evidence that, in roughly six years, a large system of small public high schools can be created and can markedly improve graduation prospects for many disadvantaged students. Specifically:
· By the end of their first year of high school, 58.5 percent of SSC enrollees are on track to graduate in four years compared with 48.5 percent of their non-SSC counterparts, for a difference of 10.0 percentage points. These positive effects are sustained over the next two years.
· By the fourth year of high school, SSCs increase overall graduation rates by 6.8 percentage points, which is roughly one-third the size of the gap in gradu-ation rates between white students and students of color in New York City. · SSCs’ positive effects are seen for a broad range of students, including male
high school students of color, whose educational prospects have been histori-cally difficult to improve.
Contents
Overview iii
List of Tables, Figures, and Boxes vii
Preface xi
Acknowledgments xiii
Executive Summary ES-1
Chapter
1 Introduction 1
Only in New York 2
Contributing to the Evidence Base Around Small Schools 14 Studying New York City’s Small Schools of Choice 16
2 Research Design and Analysis 19
How HSAPS Creates SSC Lotteries 21
How Effects of Winning an SSC Lottery Are Estimated 22 Converting Estimated Effects of Winning an SSC Lottery into
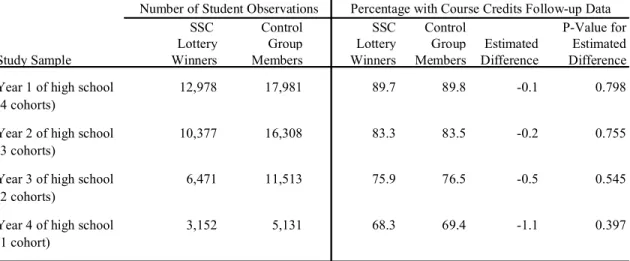
Estimated Effects of Enrolling in an SSC 23 Size of the Sample, Its Data Availability, and Implications of Missing Data 26
The Data and Their Sources 29
Who Is Represented by the Findings? 30
3 The Effects of Enrolling in Small Schools of Choice on Students’ High
School Academic Progress 35
Schools Attended by Target SSC Enrollees and by Their
Control Group Counterparts 35
Effects of SSC Enrollment on High School Academic Success 39
4 Conclusions and Next Steps 57
Interpreting the Findings 57
Implications of the Findings 61
Conclusion 65
Appendixes
A: More About the Study’s Research Design and Analysis 67
B: Effects of Winning an SSC Lottery 97
C: Baseline Characteristics of SSC Lottery Participants with Follow-up Data 103
D: Imputing Outcomes for Students Who Are Lost Through Attrition 113
E: Sources and Description of Data Collected for the Study 121
F: Variation in the Fourth-Year Effects 125
H: New York City Department of Education’s New Secondary School
Application, 2008 135
Bibliography 153
References 155
List of Tables, Figures, and Boxes
Table
ES.1 Estimated Effects of SSC Enrollment in Years 1 to 4 of High School ES-6 1.1 Number of New Small Schools and First-Time Ninth-Grade Student Enrollment, by
School Type 6
1.2 HSAPS Participation Patterns by Year 14
2.1 Baseline Characteristics of SSC Lottery Participants: First Year of High School,
Cohorts 1 to 4 24
2.2 Sample Sizes and Data Availability 27
2.3 Baseline Characteristics of Target SSC Enrollees, All HSAPS Enrollees in Study SSCs, and All First-Time Ninth-Grade Students in New York City: First Year of
High School, Cohorts 1 to 4 31
3.1 Characteristics of Schools Attended by Target SSC Enrollees Compared with Characteristics of Schools Attended by Their Control Group Counterparts: First
Year of High School, Cohorts 1 to 4 37
3.2 Estimated Effects of SSC Enrollment on the Transition into High School: First Year
of High School, Cohorts 1 to 4 41
3.3 Variation in Effects of SSC Enrollment on Ninth-Grade On-Track Indicator, by
Student Characteristic: First Year of High School, Cohorts 1 to 4 44 3.4 Estimated Effects of SSC Enrollment on Progress Toward Graduation: Second
Year of High School, Cohorts 1 to 3 49
3.5 Estimated Effects of SSC Enrollment on Progress Toward Graduation: Third Year
of High School, Cohorts 1 and 2 50
3.6 Estimated Effects of SSC Enrollment Over Time on Total Credits Earned and Total
Regents Exams Passed Toward Graduation: Cohort 1 52 3.7 Estimated Effects of SSC Enrollment on Graduation: Fourth Year of High School,
Cohort 1 53
A.1 Baseline Characteristics of SSC Lottery Participants: First Year of High School,
A.2 Distribution of Lottery Participants by Their Number of Prior Choices Not
Obtained: Cohorts 1 to 4 80
A.3 Distribution of Lottery Participants by Their Number of Prior Choices Not
Obtained: Students in Cohorts 1 to 4 Who Were in Multiple Lotteries 81 A.4 Sample Partial Table of Estimated SSC Enrollment Effects 94 B.1 Estimated Effects of Winning an SSC Lottery on the Transition into High School:
First Year of High School, Cohorts 1 to 4 99
B.2 Estimated Effects of Winning an SSC Lottery on Progress Toward Graduation:
Second Year of High School, Cohorts 1 to 3 100
B.3 Estimated Effects of Winning an SSC Lottery on Progress Toward Graduation:
Third Year of High School, Cohorts 1 and 2 101
B.4 Estimated Effects of Winning an SSC Lottery on Graduation: Fourth Year of High
School, Cohort 1 102
C.1 Baseline Characteristics of SSC Lottery Participants with Follow-up Data: First
Year of High School, Cohorts 1 to 4 105
C.2 Baseline Characteristics of SSC Lottery Participants with Follow-up Data: Second
Year of High School, Cohorts 1 to 3 107
C.3 Baseline Characteristics of SSC Lottery Participants with Follow-up Data: Third
Year of High School, Cohorts 1 and 2 109
C.4 Baseline Characteristics of SSC Lottery Participants with Follow-up Data: Fourth
Year of High School, Cohort 1 111
D.1 Estimated Effects of SSC Enrollment, Imputing Zeros for Students with Missing
Follow-Up Data for Course Credits: Cohorts 1 to 4 116 D.2 Estimated Effects on DOE-Defined Categories of Discharge Status: Fourth Year of
High School, Cohort 1 117
D.3 Estimated Effects of SSC Enrollment, Imputing Zeros for Dropouts and Values in Accord with Control Group Distribution for All Other Students with Missing
Follow-up Data for Course Credits: Cohorts 1 to 4 118 E.1 Source and Description of Data Collected for the Study 123 F.1 Variation in Effects of SSC Enrollment on Graduation, by Student Characteristic:
Figure
1.1 Student Enrollment in Closing High Schools, Small Schools of Choice, and Other
New Small Schools in Brooklyn and the Bronx 8
1.2 Student Flow from Eighth-Grade Choice to Ninth-Grade Enrollment Among
Students Enrolled in DOE Schools 13
A.1 HSAPS Assignment Process for a Hypothetical Student 71 A.2 HSAPS Assignment Process for a Hypothetical SSC 72 A.3 A Model of SSC Enrollment Among Hypothetical SSC Lottery Winners and
Control Group Members 87
Box
ES.1 Types of New Small Schools Opened Between 2002 and 2008 ES-3 1.1 Types of New Small Schools Opened Between 2002 and 2008 5 1.2 Key Differences Between New York City’s High School Application Processing
System (HSAPS) and the System It Replaced 12
3.1 Definitions of Outcomes: Transition Into and Progress Through High School 42 3.2 Definitions of Outcomes: Graduation and College Readiness 55
Preface
The traditional large high schools that typify so many school districts in this country — particularly our poor urban centers — are a relic of a former time, with too many of them characterized by shockingly high dropout rates and large numbers of young people who grad-uate unprepared for college-level studies. Despite much experimentation, little concrete evi-dence has emerged about how to turn around our lowest-performing public schools and equip America’s high school students with the skills they’ll need in today’s rapidly changing world.
In New York City, however, a remarkable transformation now appears to be taking place. Since 2002, the city has closed more than 20 underperforming public high schools, opened more than 200 new secondary schools, and introduced a centralized high school admis-sions process in which approximately 80,000 students a year indicate their school preferences from a wide-ranging choice of programs. At the heart of these reforms lie 123 small, academi-cally nonselective public high schools for students in grades 9 through 12. These “small schools of choice” (SSCs) — a name coined by the authors of this report to highlight the fact that stu-dents at any academic level could choose to attend them — are located in historically disadvan-taged communities and were intended to be viable alternatives to the neighborhood high schools that were closing. This report presents the findings of the first large-scale, rigorous evaluation of that reform effort.
What was the exact nature of the reform? It was rooted in the small schools movement, but it went further. SSCs are more than just small. They were authorized through a demanding and competitive proposal process that was designed to encourage and enable a range of on-the-ground stakeholders with innovative ideas — from educators to school reform intermediary or-ganizations — to start new schools. The result was an emphasis on features that offered support to disadvantaged and traditionally underserved students, such as reduced teacher load and common planning time as a way to ensure that all students were known well and to promote strong, sustained relationships between students and faculty. Each SSC also received start-up funding as well as assistance and policy support from the district and other key players to facili-tate leadership development, hiring, and implementation. In short, these schools were the prod-uct of a bottom-up, not a top-down, process.
MDRC’s unusually large and rigorous study takes advantage of a lottery-like system that New York City uses to assign students when the high schools they choose are oversub-scribed. The findings show that it is possible, in a relatively short span of time, to replace a large number of underperforming public high schools in a poor urban community and, in the process, achieve significant gains in students’ academic achievement and attainment. And those gains are seen among a large and diverse group of students — including students who entered the ninth grade far below grade level and male students of color, for whom such gains have been stubbornly elusive.
xii
While debates continue over test score differences and whether they can accurately pre-dict progression through high school and success later in life — despite little compelling evi-dence that scores alone can be relied upon to make such predictions — the reform effort that is the subject of this report has led to actual improvements in measures that point directly to in-creased attainment, graduation rates, and college-readiness: increases in attendance rates, in the number of credits earned from grade to grade over four years of high school, in high school graduation rates, in earning the New York State Regents diploma, and in achieving Regents scores in English that enable entry into the City University of New York. If the quality of the evidence presented here is rare, the results are rarer still. No comparable evidence has been pro-duced to date for any other major educational reform effort.
Notably, New York City’s reform effort represented a partnership among a diverse group of people and agencies: Mayor Michael Bloomberg, Schools Chancellor Joel Klein, the NYC Department of Education, a consortium of philanthropies, the teachers and principals un-ions, nonprofit intermediaries, and community groups. It took enormous courage and convic-tion, and years of unrelenting toil, for this group of people with diverging perspectives to tackle the problem of failing high schools. The logistics alone of simultaneously closing and opening schools at this scale are daunting to contemplate, making the results all the more impressive.
With the nation’s attention focused squarely on turning around failing urban high schools, this study demonstrates that it is possible to achieve meaningful changes at scale within a large, urban public school system. We look forward to following the story of the students in New York City’s small schools of choice to learn whether these gains grow as additional co-horts of students progress through their final year of high school, and whether the gains translate into success in postsecondary education and the labor market.
Gordon Berlin President MDRC
Acknowledgments
This report was funded by the Bill & Melinda Gates Foundation as one of a set of in-ter-related studies of New York City’s high school reform efforts. The authors would like to acknowledge the foundation leadership that stewarded this first report through completion ―
James Shelton, in his former role as Program Director, Education Division, for his initial support, and Allan Golston and Vicki Phillips for their continued commitment. Adam Tucker, Kendall Guthrie, Lance Potter, Constancia Warren, Jana Carlisle, current and former staff, and affiliates of the foundation provided invaluable feedback and suggestions over the course of the project.
This study would not have been possible without the support of the New York City Department of Education (DOE), which over the course of this project has demonstrated a tremendous commitment to learning about the effects of its reform agenda. We especially want to recognize DOE Chancellor Joel Klein; Michele Cahill, in her former role as Senior Counselor to the Chancellor for Education Policy; and Garth Harries, in his former role as Chief Executive of Portfolio Development, for providing early guidance and support for this study, as well as providing the access and information that seeded the past three years of research. We thank Jennifer Bell-Ellwanger for coordinating the DOE’s involvement. We owe a debt to the former and current staff of the Office of Student Enrollment, including Elizabeth Sciabarra, Evaristo Jimenez, Jesse Margolis, and Hussham Khan, who helped build our understanding of the district’s high school choice process for the purposes of rigorous study. Additionally, we are grateful to the many staff who provided data, input, and sugges-tions at different stages of the project, including Eric Nadelstern, Shael Polakow-Suransky, John White, Thomas Gold, Douglas Jaffe, Brianna Moore, and Dominique West.
We want to acknowledge the many reviewers and informal advisers who contributed to the technical aspects of this report. Early on, Parag Pathak and Atila Abdulkadiroglu, who developed New York’s High School Application Processing System, and Neil Dorosin, who implemented it, shared their insights in response to the study design. Additionally, several advisers have lent a substantial amount of time and thought to review of the authors’ metho-dology, including Jennifer Hill, Brian Jacob, Thomas Kane, Jeffrey Kling, Sean Reardon, the members of MDRC’s Education Studies Committee, and, in particular, the committee’s chair, Richard Murnane.
We would like to thank our research partners in the larger Gates-funded set of studies — Eileen Foley at Policy Studies Associates, Inc.; Cheri Fancsali and Vernay Mitchell-McKnight at the Academy for Educational Development; and Christopher Librizzi and Joe
Finally, we would like to express gratitude to the many colleagues at MDRC who have contributed to this report. In his former role at MDRC and currently at the Research Alliance for New York City Schools, James Kemple helped shape the scope and substance of the report. Gordon Berlin, Fred Doolittle, John Hutchins, Rob Ivry, and Janet Quint reviewed several versions of the report and provided detailed comments. Charles Michalopoulos and Michael Weiss served as additional technical reviewers, and Marie-Andree Somers and Pei Zhu provided methodological feedback and analytic support. Edmond Wong, Janell Smith, and Alma Moedano assisted with analysis and fact-checking, and Mario Flecha and Christina Saenz provided production assistance. Alice Tufel edited the report, and Stephanie Cowell and David Sobel prepared it for publication.
Executive Summary
Over the last decade, New York City has been the site of a systemwide high school reform effort that is unprecedented in its scope and pace. Since 2002, the school district has closed more than 20 failing high schools, opened more than 200 new secondary schools, and implemented a centralized high school admission process in which approximately 80,000 students a year indicate their school preferences from a wide-ranging choice of programs.
At the heart of these reforms lie the new schools that in this report are called “small schools of choice” (SSCs) — small, academically nonselective, public high schools that were opened between 2002 and 2008. Serving approximately 100 students per grade in grades 9 through 12 and open to students at all levels of academic achievement, the SSCs in this study were created to serve the district’s most disadvantaged and historically underserved students. Prior to the 2002-2003 school year, these students would have had little option but to enroll in one of the city’s large, zoned high schools when they made the transition from eighth to ninth grade. Many of the large schools were low-performing, with graduation rates below 50 percent.
This report presents encouraging findings from an unusually large and rigorous study, supported by the Bill & Melinda Gates Foundation, of the effects of SSCs on students’ academ-ic achievement in high school. It emerges at a moment when polacadem-icymakers, practitioners, and researchers have identified the high school years as the point of greatest weakness within the education pipeline. The rationale for this collective focus is clear: far too many students drop out of high school, and the consequences of entering adult life without a high school diploma are increasingly grave. Amid a national call for change and a dearth of effective responses, the findings presented in this report provide clear and reliable evidence that:
· In roughly six years, it is possible to create a large system of small public high schools that markedly improve graduation prospects for many of the disadvantaged students who choose to attend these schools.
· In the schools being evaluated, positive effects on students’ progress toward high school graduation become apparent as early as the ninth grade and are sustained during the next two years; by the end of four years of high school, these effects culminate in higher rates of graduation.
· These positive effects are experienced by a broad range of students who dif-fer in terms of their demographic characteristics, economic circumstances, and academic preparation. It is particularly noteworthy that the benefits of small schools extend to male high school students of color, whose education-al prospects have been historiceducation-ally difficult to improve.
This executive summary describes these findings and identifies their key implications for policy, practice, and knowledge-building.
What Are Small Schools of Choice?
The New York City public school system is the largest in the United States, with over 1.1 million students enrolled in more than 1,600 schools. Over the past decade, it has been the site of an ambitious effort to reform the high school system, of which the creation of SSCs was a central part. Beginning in 2002, the New York City Department of Education (DOE) accel-erated and expanded efforts that had been under way since the mid-1990s to close large, low-performing schools and open new small schools in their stead. These reform efforts were supported by a consortium of funders led by the Bill & Melinda Gates Foundation — which ultimately invested over $150 million in New York City1 — and were implemented in partner-ship with the teachers and principals unions.2 The resulting changes in the high school land-scape transpired with unprecedented scale and rapidity. By 2008, 23 high schools with gradua-tion rates below 45 percent had been targeted for closure, and 216 new small schools, of which 123 were SSCs, had been opened.
While the district established a variety of small school models (shown in Box ES.1), ranging from transfer schools designed to serve students who had struggled in conventional high schools to specialized schools intended to serve the district’s highest-performing students, the predominant model was the small school of choice,3 which, notably among the other school types, was academically nonselective and small not only in size but also in function. That is, structures such as reduced teacher load and common planning time (in which teachers meet together to discuss their students’ progress and problems) were recommended to ensure that all students were known well and to promote strong, sustained relationships between students and teachers. SSCs also had four other essential features:
· SSCs were predominantly located in disadvantaged communities whose neighbor-hood high schools were closing.
1The Gates Foundation supported the DOE’s new school creation efforts in partnership with the Carnegie Corporation of New York and the Open Society Institute, and other systemwide initiatives benefited from at least $230 million worth of funding from philanthropies including the Wallace Foundation, the Michael & Susan Dell Foundation, and the Eli and Edythe Broad Foundation. Quint, Smith, Unterman, and Moedano (2010) provides a history of small schools in New York City, including the efforts undertaken by New Visions for Public Schools — which launched the New Century High Schools Initiative — that immediately preceded and served as the model for the school creation efforts under the Bloomberg/Klein administration.
2New Visions for Public Schools (2005).
3“Choice” in “small schools of choice,” a term coined by the researchers, is meant to emphasize the fact that these nonselective schools are accessible to students of all academic levels.
· SSCs were established via a demanding and competitive proposal process that emphasized the common design principles of academic rigor, personali-zation, and community partnerships. This process required a prospective school leadership team to articulate an educational philosophy and demon-strate how it would motivate teachers, community members, and partner or-ganizations around it. Additionally, the new school leadership had to develop a viable improvement strategy from the ground up.
· SSCs benefited from an infusion of outside resources: new principals and teachers, partnerships with intermediary organizations that had expertise in starting new schools, and start-up funding from the district and its philan-thropic partners.
New York City Small Schools of Choice Box ES.1
Types of New Small Schools Opened Between 2002 and 2008 General high schools offer a standard core curriculum in addition to elective courses and serve students at various levels of academic ability in grades 9-12.
· Small schools of choice (SSCs) are both small and academically nonselective (123 opened by the 2008-2009 school year).
· Other general high schools are small and academically selective (38 opened by the 2008-2009 school year).
Transfer schools are small, personalized, full-time schools designed to help overage and undercredited students overcome obstacles to graduation (21 opened by the 2008-2009 school year).
Middle/high schools, typically serving grades 6-12 or 7-12, are intended to support stu-dents’ transition from middle to high school by enabling them to maintain relationships with familiar staff members and stay within familiar surroundings (33 opened by the 2008-2009 school year).
Specialized high schools serve students who are high-performing academically and/or artis-tically. Admission usually depends on the student’s score on the Specialized High Schools Admissions Test, taken during eighth grade (1 opened by the 2008-2009 school year). ______________________________________
SOURCE: MDRC calculations use High School Application Processing System data from 2004-2005 to 2007-2008 and school-level administrative records provided by the DOE for the 2002-2003 to 2008-2009 school years.
· SSCs received policy protections during their start-up period, including opening with only one founding grade of students (ninth grade) and having access to supports to facilitate procurement and hiring — such as special training for school principals and teachers; an amendment to the collective bargaining agreement, which gave principals more hiring discretion; and the conversion from a management system of regional offices to one in which schools had greater control over their budgets and educational programs.
How Was the Study Conducted?
In the spring of 2004, the city introduced the High School Application Processing Sys-tem (HSAPS), a centralized choice process that was to govern the placement of all entering ninth-grade students. HSAPS uses an objective, computer-based process to assign about 72,500 entering ninth-graders annually to about 400 public high schools.4 When they are in the eighth grade, students who participate in HSAPS indicate, in order of preference, up to 12 high schools they would like to attend. Each year, some schools have more applicants than seats available. When this occurs at an SSC, a lottery is created within HSAPS that randomly determines which students are assigned to that school.
The analysis presented in this report uses data from the high school admissions process to identify a sample of students who chose SSCs, but who — because their chosen SSC had more applicants than seats available — were assigned via lottery either to that school or to a subsequent choice on their list. The analysis includes four annual cohorts of students who entered high school in the fall of 2005, 2006, 2007, and 2008, respectively — a total of 21,085 students who applied to the 105 SSCs that were oversubscribed, and for which lotteries were held, during the study period.
The existence of these lotteries provides an unprecedented opportunity to launch a rigorous study of the effects of this group of schools on student academic achievement, because the lotteries create two randomized groups among students who chose a given SSC — those who won its lottery and were assigned to the SSC and those who lost its lottery and were assigned elsewhere. Future outcomes for these two groups can be compared to obtain valid estimates of the effects of SSCs on student achievement. The lotteries created by HSAPS together with the unusually large size of the randomized sample they produced allow for a high degree of validity and precision in the present analyses. Thus, one can have considerable
4Although approximately 80,000 students participate in HSAPS each year, a small percentage of those students do not receive a match and advance to high school through a borough enrollment office instead of through HSAPS. Thus, an average of 72,500 students are assigned through HSAPS.
confidence in them. Using these lotteries as the basis for its analysis, this report presents the estimated effects of enrolling in a small school of choice versus enrolling in one of the other high schools that are available to the average incoming ninth-grader.5
Most of the schools attended by students who did not enroll in an SSC were older and larger than the SSCs: all SSCs were created since 2002 while two-thirds of the schools attended by the non-SSC enrollees were established before then, and the ninth-grade classes averaged 129 students in SSCs and 635 students in the non-SSC schools.6 However, it is important to remember that the SSCs are not being compared with the large, failing schools they replaced but rather with a wide range of schools that were also operating in a reform-rich atmosphere.
What Are the Effects of Small Schools of Choice?
Making a successful transition into high school is a critical step toward graduation. For example, the Consortium on Chicago School Research found that high school students who are on track to graduate by the end of their first year — meaning that they have earned at least 10 credits and are failing no more than one core subject — are three and a half times more likely to graduate in four years than are other students.
The First Three Years of High School
SSCs have a substantial positive impact on the transition into high school during ninth grade, according to data using all four cohorts (see Table ES.1):
· SSC enrollees were 10.8 percentage points more likely than the students who enrolled in other schools to earn 10 or more credits during their first year — 73.1 percent compared with 62.3 percent.
· SSC enrollees were 7.8 percentage points less likely to fail more than one core subject (39 percent compared with 46.8 percent).
· Combining these two indicators, 58.5 percent of SSC enrollees were on track to graduate in four years compared with 48.5 percent of their counterparts who attended a different type of school — a 10 percentage point difference.
5As explained in Appendix A, to estimate the effects of enrolling in an SSC, the estimated effects of win-ning an SSC lottery (see Appendix B) are adjusted to account for the proportion of SSC lottery winners who do not enroll in an SSC and the proportion of control group members who do enroll in an SSC, using a well-known statistical approach called instrumental variables analysis.
6While the schools attended by non-SSC enrollees were significantly larger, some of those larger schools (for approximately one-eighth of those students) had structures such as small learning communities in place to increase the level of personalization.
Target Control Effect Size P-Value for SSC Group Estimated (Standard Estimated
Outcome Enrollees Counterparts Effect Deviation) Effect
Year 1 of high school (cohorts 1 to 4)
9th-grade on-track indicatora (%) 58.5 48.5 10.0 ** 0.000
Earned 10 or more credits 73.1 62.3 10.8 ** 0.000
Failed more than 1 semester of a core subject 39.0 46.8 -7.8 ** 0.000 Total credits earned toward graduationb 11.3 10.4 0.9 ** 0.21 ** 0.000
Year 2 of high school (cohorts 1 to 3)
Earned 20 or more credits (%) 69.4 58.3 11.1 ** 0.000
Total credits earned toward graduationb 22.3 19.8 2.6 ** 0.31 ** 0.000
Year 3 of high school (cohorts 1 and 2)
Earned 30 or more credits (%) 69.5 62.4 7.1 ** 0.000
Total credits earned toward graduationb 32.2 29.7 2.4 ** 0.23 ** 0.000
Year 4 of high school (cohort 1)
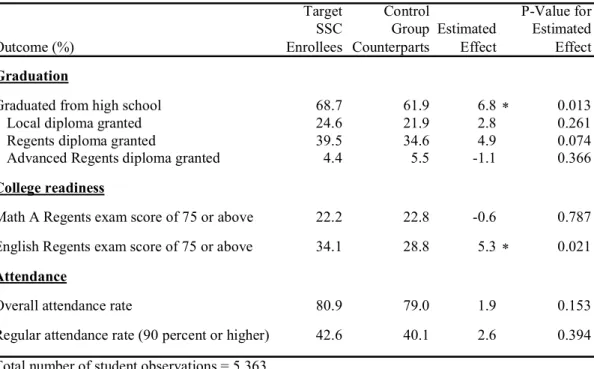
Graduated from high school 68.7 61.9 6.8 * 0.013
Local diploma granted 24.6 21.9 2.8 0.261
Regents diploma granted 39.5 34.6 4.9 0.074
Advanced Regents diploma granted 4.4 5.5 -1.1 0.366
Regents exams towards graduation requirementsc Regents exams towards graduation requirementsb Total number of student observations = 13,297
Total number of student observations = 5,363
New York City Small Schools of Choice
Table ES.1
Estimated Effects of SSC Enrollment in Years 1 to 4 of High School
Total number of student observations = 29,811
Total number of student observations = 21,822
SOURCES: MDRC's calculations use High School Application Processing System data from eighth-graders in 2004-2005 to 2007-2008, as well as data from New York City Department of Education attendance, course credits, Regents exam, transactional, and enrollment files from the 2005-2006 to 2008-2009 school years. NOTES: This table presents the estimated effects for students who have follow-up course credits data. Appendix A describes how values in the column labeled "Target SSC Enrollees" are estimated. Appendix A also describes how values in the column labeled "Estimated Effect" are estimated. Values in the column labeled "Control Group Counterparts" are differences between corresponding values in the first and third columns.
A two-tailed t-test was applied to the estimated effect. Statistical significance levels are indicated as: ** = 1 percent; * = 5 percent.
Cohorts 1, 2, 3, and 4 consist of students in the study who were eighth-graders in the spring of 2005, 2006, 2007, and 2008, respectively.
aThe on-track composite measure indicates whether students earned at least 10 credits in their first year of high school and had no more than one semester of failure in a core subject in that school year (English, math, science, and social studies).
bThe "total credits earned toward graduation" measure is the aggregate number of course credits earned toward fulfilling the New York State graduation requirements. The credit requirements are as follows: 31 core subject credits, including 8 credits each of English and social studies; 6 credits each of math and science; 2 credits of arts; 1 credit of health; and 13 additional credits, including 4 credits of physical education, 2 credits of a foreign language, and 7 credits of electives.
· During the first year of high school, SSC enrollees earn almost one full credit more (0.9 credit) toward graduation than do their control group counterparts. These positive effects on the transition into high school during ninth grade were seen among nearly all subgroups as defined by students’ academic proficiency, socioeconomic status, race/ethnicity, and gender. The effects of SSCs for the second year of high school (using data from the first three cohorts) are also positive:
· Among second-year SSC enrollees, 69.4 percent had earned 20 or more cred-its toward graduation as opposed to 58.3 percent of their counterparts in non-SSC schools — an 11.1 percentage point difference.
· Second-year SSC enrollees had accumulated an average of 22.3 credits to-ward graduation as opposed to 19.8 credits for their non-SSC counterparts, for a difference of 2.6 credits.
· SSCs continue to increase students’ engagement during their second year of high school, as evidenced by the increase in the percentage of students who attend school regularly — that is, at least 90 percent of the time — by 6.2 percentage points (49.0 percent for the non-SSC group compared with 55.2 percent for SSC enrollees).
In the third year of high school, positive effects continue to accumulate (according to data from the first two cohorts):
· SSCs increase the percentage of students earning 30 or more credits by 7.1 percentage points (69.5 percent for SSC enrollees compared with 62.4 per-cent for the non-SSC group).
· SSCs increase the average number of credits earned toward graduation by 2.4 credits (32.2 credits compared with 29.7 credits).
· SSCs increase average attendance during students’ third year of high school by 3.0 percentage points and increase the percentage of students who attend regularly by 8.1 percentage points.
In summary, SSCs consistently improve student academic outcomes during the first three years of high school. The next logical question is: To what extent do these academic gains translate into increased rates of high school graduation?
Effects on Graduation Rates
For the first cohort of students (the only cohort for whom there are four years of follow-up data), the evidence indicates that SSC improvements in students’ academic progress and school engagement during the early years of high school translate into higher rates of on-time graduation after four years:
· SSCs increase overall graduation rates by 6.8 percentage points, from 61.9 percent for students who attend schools other than SSCs to 68.7 percent for SSC enrollees.
· A majority of the SSC effect on graduation rates reflects an increase in re-ceipt of New York State Regents diplomas.7 For this type of diploma, stu-dents must pass a series of Regents examinations with a score of 65 points or above and pass all of their required courses.
· SSCs increase the proportion of students (by 5.3 percentage points) who passed the English Regents with a score of 75 points or higher, the threshold for exempting incoming students at the City University of New York from remedial courses. They did not have an effect on math Regents exams.
What Are the Implications of These Findings?
These findings speak to the nation’s current focus on high school reform. Much of the national discussion focuses on three areas where the education community has struggled to demonstrate success: (1) improving the academic outcomes of the most disadvantaged students, particularly with respect to high school graduation and college readiness; (2) identifying turn-around strategies for historically underperforming schools; and (3) implementing effective interventions at scale. This study sits at the nexus of all three themes, and its findings demon-strate that, in a relatively short period of time, an effective model can be implemented at scale and can improve the academic trajectories of large numbers of traditionally underserved students.
7Although the estimated effect of SSCs on the overall high school graduation rate is statistically signifi-cant, estimates of SSC effects on graduation rates by type of diploma (p = 0.07) miss the standard of statistical significance established for this study (p = 0.05). Thus, comparisons of effects across diploma types are suggestive only. Regents exams are administered to all public high school students in New York State. Students must pass at least five tests in specified subject areas in order to graduate with a diploma that is recognized by the New York State Board of Regents, which sets standards and regulations for all public schools.
The effects of small high schools of choice described in this report should be under-stood through three important lenses: their scale, the particular package of reforms they represent, and the group of highly disadvantaged students for whom they occurred.
Effecting Change at Scale. At capacity, the 105 SSCs in the study sample will serve over 45,000 students. That is roughly equivalent to the entire high school population of Houston, which is the seventh largest school district in the country. Readers should understand the magnitude of the present report’s findings in that context — imagine, for a school district the size of Houston, increasing the percentage of ninth-graders who are eligible for on-time promo-tion by 10.8 percentage points, the percentage of black males in ninth grade who are on track to graduate by 8.5 percentage points, or the percentage of high school graduates by 6.8 percentage points. Given the scale of the SSC initiative, even seemingly minor gains can be understood as affecting thousands of high school students. In fact, the 6.8 percentage point increase in four-year graduation rates is roughly equivalent in size to one-third of New York City’s gap in graduation rates between white students and students of color. Additionally, because the reported effects of SSCs are not the product of a small, targeted intervention but rather of a large system of small schools, the effects can be understood as reflecting the mean performance of a model imple-mented at scale. Reported effects are not the product of the best or most popular of the SSCs, but of 105 schools on average. In other words, the findings represent a real-world test of an interven-tion launched at the scale of a large-sized urban school district.
The SSC Package of Reforms.Students enrolled in SSCs did not just attend schools that were small. SSC enrollees attended schools that were purposefully organized around smaller, personalized units of adults and students, where students had a better chance of being known and noticed, and where teachers knew enough about their charges to provide appropriate academic and socioemotional supports. SSCs were not only new but were mission-driven. Their recent establishment via a demanding authorization process, which rejected more school proposals than it approved, required that a prospective school leadership team articulate an educational philosophy and demonstrate how it would motivate teachers, community members, and partner organizations around it. And the district’s commitment to acting as a steward for new schools throughout the start-up period generated a set of supports and protections as these schools got up and running. Finally, SSCs benefited from an influx of external ideas, talent, and resources.
Serving Disadvantaged Students. SSCs were intended to be a viable and accessible option for the district’s most disadvantaged students, and over the course of the study period, they served a population that almost exclusively comprised low-income students of color. The fact that SSCs targeted and served this population gives the reported findings even greater policy significance, as it is precisely economically disadvantaged students of color who find themselves at the bottom end of the nation’s persistent achievement gap, and who are least
likely to graduate from high school on time, if at all. Furthermore, the robust positive SSC effects for many different types of students, including young men of color, hold out great hope for educational policymakers, practitioners, and researchers who wish to effect change, by demonstrating that it is possible to transform a large number of high schools in ways that benefit many disadvantaged students.
Interpreting and Using the Findings
The reforms implemented in New York City should be considered as a package of inte-grated, reinforcing strategies. The effects are not simply the result of closing low-performing schools or of creating SSCs, but rather a purposeful marriage of the two strategies supported by the implementation of several enabling reforms. Decision-makers interested in replicating the district’s strategy should devote as much attention to how these reforms were operationalized as they do to what was conceptualized. Closing the failing schools would likely not have been singularly effective without the intentional creation of a range of viable alternative options to educate the displaced students. Similarly, the creation of new schools would likely not have gained the traction it did without the introduction of a districtwide choice process that motivated previously underserved students and their families to explore their high school options and exercise choice. Thus, while this study provides compelling evidence in support of a particular small school model, that model cannot be understood as existing in isolation but rather as one integral component of a comprehensive and coordinated set of district reforms.
While these results are uniformly encouraging, they are still early. Only one of the co-horts has been followed through four years of high school up to graduation. The full effects of the high school reform initiative in New York City will not begin to be revealed until the remaining three cohorts of students graduate from high school and venture into postsecondary education and the labor market.
Chapter 1
Introduction
Over the last decade, New York City has been the site of a systemwide high school reform effort that is unprecedented in its scope and pace. Since 2002, the school district has closed more than 20 failing high schools, opened hundreds of new secondary schools, and implemented a centralized high school admissions process that serves approximately 80,000 students per year.
At the heart of these reforms lie the new schools that in this report are called “small schools of choice” (SSCs) — small, nonselective, public high schools serving students in grades 9 through 12 that were opened between 2002 and 2008. Serving approximately 100 students per grade and open to students at all levels of academic achievement, the SSCs in this study were created to serve the district’s most disadvantaged students. Prior to the 2002-2003 school year, New York City’s most disadvantaged public school students had little option but to enroll in one of the city’s large, zoned high schools when they made the transition from eighth to ninth grade. Many of those schools were low-performing, with graduation rates below 50 percent.
Supported by the Bill & Melinda Gates Foundation, this report presents very encourag-ing findencourag-ings from an unusually large and rigorous study of the effects of SSCs on students’ academic achievement in high school. The study benefits from two aspects of the district’s systemwide strategy: (1) the unprecedented scale at which SSCs were created, with 123 opening in the six-year period noted above; and (2) the district’s simultaneous introduction of a universal high school choice process, which created lotteries for each SSC that was oversub-scribed — that is, for schools that did not have enough spaces for all the students who wished to attend them.
The analysis presented in this report uses data from the high school admissions process to identify a sample of students who chose SSCs, but who — because their chosen SSC had more applicants than seats available — were assigned via lottery either to that school or to a subsequent choice on their list.1 The analysis includes four annual cohorts of students who entered high school in the fall of 2005, 2006, 2007, and 2008 — a total of 21,085 students who applied to 105 oversubscribed SSCs.
The report presents estimates of the effects on students’ academic progress of enrolling in a small school of choice relative to what their progress would have been if they had enrolled
in one of the wide range of other available public high schools in New York City.2 For the students who constitute the study sample, those other schools were, on average, older and larger.3 To obtain these estimates, school records data are used to compare the academic progress of students who enroll in SSCs with that of their control-group counterparts who enroll elsewhere. This analysis reveals robust positive effects on students’ academic transition into high school, their subsequent progress toward graduation, and their attainment of a high school diploma within four years.
The remainder of this chapter positions these findings by:
· Describing the unique set of implementation conditions that gave rise to SSCs
· Discussing the ways in which this report’s analysis of SSCs contributes to the evidence base around the efficacy of small schools
· Presenting a research framework that outlines what was studied, what com-parisons were drawn, and how broadly the findings can be generalized
Only in New York
The New York City public school system is the largest in the United States, with over 1.1 million students enrolled in more than 1,600 schools.4 Over the past decade, it has been the site of an ambitious effort to reform the high school system, of which the creation of SSCs was a central part.
In 2002, newly elected Mayor Michael Bloomberg identified school reform as a priority of his administration, successfully petitioning the New York State legislature to establish mayoral control of the school district,5 and appointing Joel Klein — a nationally recognized antitrust lawyer — as its chancellor. Beginning in 2002, the New York City Department of Education (DOE) rapidly introduced an ambitious set of reforms organized around the prin-ciples of “Leadership, Empowerment, and Accountability,” including:
2As explained in Appendix A, to estimate the effects of enrolling in an SSC, the estimated effects of win-ning an SSC lottery are adjusted to account for the proportion of SSC lottery winners who do not enroll in an SSC and the proportion of control group members who do enroll in an SSC, using a well-known statistical approach called instrumental variables analysis.
3It is important to remember that the SSCs are not being compared with the large, failing schools they replaced.
4NYC Department of Education (2010a).
5Prior to 2003, district governance responsibilities were divided among the mayor, an appointed Board of Education, and 32 locally elected school boards.
· The founding of a training institute for school principals, known as the NYC Leadership Academy, and the expansion of an analogous program for teach-ers, known as the NYC Teaching Fellows, intended to both attract and train nontraditional educators to serve in DOE schools6
· An amendment to the collective bargaining agreement, which eliminated the prevailing hiring policy that compelled principals to hire teachers with se-niority in favor of a policy that gave them more discretion7
· The conversion from a management system of regional offices responsible for school governance, curricular mandates, and budget allocation to one in which schools had greater control over their budgets and educational pro-grams, and were responsible for contracting with their choice of “School Support Organization” to purchase core services8
Together, these systemwide changes, which provide the policy backdrop for the high school reforms described below, signaled a shift in responsibility for decisions about budget, staffing, and instruction away from district offices to the schools themselves.
In an effort to address its persistently low four-year graduation rate, which had hovered around 50 percent for more than a decade,9 the district implemented a particularly ambitious set of changes at the high school level. The impetus for and scope of those reforms are detailed at length in a companion report that identifies two key dimensions of the district’s efforts: (1) an overhaul of the stock of existing high schools through the closure of some high schools and the creation of others, and (2) the implementation of a centralized high school choice process for all rising ninth-graders.10
While the changes had systemwide implications, they were specifically intended to benefit the district’s most academically and socioeconomically disadvantaged students, who, as noted earlier, had historically been served by a limited and often low-performing set of high schools.
6By the 2008-2009 school year, graduates of the NYC Leadership Academy represented 13 percent of New York City public school principals, and graduates of the NYC Teaching Fellows represented 11 percent of teachers. See NYC Leadership Academy (n.d.) and NYC Teaching Fellows (n.d.).
7Daly, Keeling, Grainger, and Grundies (2008).
8Beginning in 2007-2008, principals were able to choose their school’s School Support Organizations. These organizations provide many of the same services and supports that were historically provided by the New York City Department of Education through its regional offices.
9Between 1992 and 2002, New York City Department of Education graduation rates ranged from 48-51 percent. See NYC Department of Education (2010b).
A Changed Set of High School Options
Beginning in 2002, the DOE accelerated and expanded efforts that had been under way in the city since the mid-1990s to close low-performing schools and open new small schools in their stead.11 The chancellor’s reform efforts were supported by a consortium of funders led by the Bill & Melinda Gates Foundation — which ultimately invested over $150 million in New York City12 — and were implemented in partnership with the teachers and principals unions.13 The resulting changes in the high school landscape transpired with unprecedented scale and rapidity. By 2008, 23 dysfunctional high schools — defined as those with graduation rates below 45 percent — had been targeted for closure,14 and 216 new small schools had been opened.
Box 1.1 describes the range of new small school types that were opened during this pe-riod. While the district advocated a “portfolio” approach and established a variety of models ranging from transfer schools designed to serve students who had struggled in conventional high schools to specialized schools intended to serve the district’s highest-performing students, the predominant model was the small school of choice (SSC):15 small, nonselective general high schools intended to serve grades 9 to 12 at capacity. As conceived, all of the district’s new small schools were intended to provide a range of geographically accessible options for students whose neighborhood high schools were closing. SSCs, which did not impose academic admis-sions requirements, represented a particularly viable option for those students. SSCs gave preference to students who (1) had geographic priority (usually residing within the same borough as the school), and (2) had attended a school’s open house or the school’s booth at a school fair,16 or who were otherwise “known” to the school.
Table 1.1 shows the distribution, by school type, of new small schools and their enrol-lees between the 2005-2006 and 2008-2009 academic years. The table not only illustrates the
11A history of small schools in New York City appears in Quint, Smith, Unterman, and Moedano (2010), including the efforts undertaken by New Visions for Public Schools — which launched the New Century High Schools initiative — that immediately preceded and served as the model for the school creation efforts under the Bloomberg/Klein administration. Similarly, the report notes that of the 23 schools closed between 2002 and 2008, three had been identified prior to that time period.
12The Gates Foundation supported the DOE’s new school creation efforts in partnership with the Carnegie Corporation of New York and the Open Society Institute, and other systemwide initiatives benefited from more than $230 million worth of funding from philanthropies including the Wallace Foundation, the Michael & Susan Dell Foundation, and the Eli and Edythe Broad Foundation. See Quint, Smith, Unterman, and Moedano (2010) and NYC Department of Education Fund for Public Schools (n.d.).
13New Visions for Public Schools (2005).
14Schools targeted for closure were typically phased out by ceasing admission of first-time freshmen but al-lowing enrolled students to advance through the upper grades. See Quint, Smith, Unterman, and Moedano (2010). 15The “of choice” in “small schools of choice,” a term coined by the researchers, is meant to emphasize the fact that these nonselective schools are accessible to students of all academic levels.
16New York City holds several city and boroughwide school fairs to give students an opportunity to talk with representatives of the city’s public schools and learn about their programs.
pace and magnitude of the district’s school creation efforts (the 216 new small secondary schools that had opened by 2008-2009 served 17,682 students), but also demonstrates the prevalence of the nonselective SSCs, which by 2008-2009 numbered 123 and served 12,448 first-time ninth-graders (70 percent of those served by all new small schools).
The SSCs were not just small and nonselective; they also shared four essential features with the other new small schools that were founded during this period:
1. They were predominantly located in disadvantaged communities whose neighborhood high schools were closing.
New York City Small Schools of Choice
Box 1.1
Types of New Small Schools Opened Between 2002 and 2008
General high schools offer a standard core curriculum in addition to elective courses and serve students at various levels of academic ability in grades 9-12.
· Small schools of choice (SSCs) are both small and academically nonselective (123 opened by the 2008-2009 school year).
· Other general high schools are small and academically selective (38 opened by the 2008-2009 school year).
Transfer schools are small, personalized, full-time schools designed to help overage and undercredited students overcome obstacles to graduation (21 opened by the 2008-2009 school year).
Middle/high schools, which typically serve grades 6-12 or 7-12, are intended to support students’ transition from middle to high school by enabling them to maintain relationships with familiar staff members and stay within familiar surroundings (33 opened by the 2008-2009 school year).
Specialized high schools serve students who are high-performing academically and/or artistically. Admission usually depends on a student’s score on the Specialized High Schools Admissions Test (SHSAT), which is taken during a student’s eighth-grade year (1 opened by the 2008-2009 school year).
______________________________________
SOURCE: Quint, Smith, Unterman, and Moedano (2010). MDRC calculations use High School Application Processing System data from 2004-2005 to 2007-2008 and school-level administrative records provided by the DOE for the 2002-2003 to 2008-2009 school years.
6
2005-2006 2006-2007 2007-2008 2008-2009 2005-2006 2006-2007 2007-2008 2008-2009
NYC Department of Education (DOE) New Small Schools
Transfera 8 9 14 21 -- -- --
--Middle/high schools 17 21 27 33 1,382 1,760 2,314 2,570
High schools 102 117 137 162 10,666 12,307 13,323 15,112
Specialized high schools 0 1 1 1 0 65 37 90
General high schools 102 116 136 161 10,666 12,242 13,286 15,022
SSCs 85 96 110 123 8,869 10,219 11,347 12,448
Total number of schools or students 127 147 178 216 12,048 14,067 15,637 17,682
School Type
New York City Small Schools of Choice
Table 1.1
Number of New Small Schools and Their First-Time Ninth-Grade Student Enrollment, by School Type
Number of Schools Number of First-Time 9th-Graders Enrolled
SOURCES: MDRC calculations use High School Application Processing System data from eighth-graders in 2004-2005 to 2007-2008, data from New York City Department of Education (DOE) enrollment files for the 2005-2006 to 2008-2009 school years, and school-level administrative records provided by the DOE for the 2002-2003 to 2008-2009 school years.
NOTES: Rounding may cause discrepancies in sums and differences.
Previous year's enrollment files were used to determine whether or not a student was a first-time ninth-grader.
aTransfer schools serve students who have been previously enrolled in a traditional high school, and are thus not intended to serve first-time
2. They were authorized through a demanding competitive proposal process that emphasized the common design principles of academic rigor, personalization, and community partnerships.
3. They benefited from an infusion of outside resources: new principals and teachers, partnerships with intermediary organizations, and start-up fund-ing from the district and its philanthropic partners.
4. They received policy protections during their start-up period.
A Focus on Historically Underserved Communities
During the period under study, the closure of underperforming schools and the opening of new small schools were concentrated in the city’s poorest boroughs — Brooklyn and the Bronx. Nineteen of the 23 large high schools that were closed by 2008 and 128 of the 216 new small secondary schools that opened were located in those two boroughs. Figure 1.1 illustrates the student population shift in Brooklyn and the Bronx as of the 2007-2008 school year at the 19 closed high schools and the 128 new small schools that were open at that point.17 By 2007, those 128 schools served 38,922 students across grades 9-12 (with the 85 SSCs among them serving 28,016). The number of students served by the new small schools actually exceeds the 36,892 students whom the large closing schools had served six years earlier.
A Rigorous Planning Process and Common Design Principles
As noted above, the new small schools were authorized through a competitive proposal process that emphasized three core elements:18
· Academic Rigor. Schools were expected to set high expectations for stu-dents and to offer a standards-based curriculum aligned with New York State graduation requirements. In fact, schools were encouraged to develop col-lege-ready standards that exceeded basic graduation requirements and em-phasized higher-order skills such as critical thinking.
17Figure 1.1 provides whole school enrollment information (grades 9-12) for the 2002-2003 school year through the 2007-2008 school year. In order to provide data for the years prior to the period of the present study, the authors rely on New York State school-level data, which were only available through the 2007-2008 school year at the time of publication. Thus, unlike other references in this analysis, the figure does not include the 2008-2009 school year.
New York City Small Schools of Choice Figure 1.1
Student Enrollment in Closing High Schools, Small Schools of Choice, and Other New Small Schools in Brooklyn and the Bronx
0 5,000 10,000 15,000 20,000 25,000 30,000 35,000 40,000 45,000 2002-2003 2003-2004 2004-2005 2005-2006 2006-2007 2007-2008 Total enrollment School Years
SOURCE: MDRC calculations use High School Application Processing System data from eighth-graders in 2004-2005 to 2007-2008, as well as New York State Report Card and school-level administrative records provided by the New York City Department of Education for school years 2002-2003 through 2007-2008. NOTE: The figure presents whole school enrollment numbers corresponding to the following counts of schools in Brooklyn and the Bronx:19 schools that ceased admitting new ninth-grade students between the 2002-2003 and 2007-2008 school years, 85 small schools of choice, and 43 other new small schools.
Small Schools of Choice
· Personalization. Schools were to be small not only in size but also in func-tion. Structures such as “Advisory,”19 reduced teacher load, and common planning time (in which teachers meet together to discuss their students’ progress and problems) were recommended to ensure that all students were known well and to promote strong, sustained relationships between students and teachers.
· Community Partnerships. The majority of new small schools were theme-based, with their curriculum organized around a theme such as business or law. Through partnerships with business and community partners, schools were intended to offer learning opportunities outside the classroom and to in-fuse classroom instruction with relevant real-world examples. Partners were expected to bolster school capacity in areas ranging from curriculum and in-struction to youth development and community outreach.
An Infusion of External Resources
The new small schools were started from scratch, fueled by new ideas, talent, and capi-tal that came from sources beyond the school district.
· The new small schools were founded by teams of teachers and administrators that had self-affiliated and participated in a rigorous planning and proposal process in order to win school approval. These planning teams developed the mission and vision for each new school as well as the planned curriculum and student services.
· Teams were encouraged to involve community partners, and the majority did so. While these partners were sometimes small community-based organiza-tions, they were more likely to be established education intermediaries — nonprofit organizations that served both as fiscal agents for distributing grant funds to schools and as central sources of experience and technical support related to the creation and operation of small schools. Most of these interme-diary organizations received funding from the Bill & Melinda Gates Founda-tion to start schools in New York City, and the large majority had started new schools before receiving Gates funding to do so. Once the new small schools
19“Advisory” (also known as “Family Group”) is a counseling model whereby teachers, administrators, and other adults in the building act as “advisors” to small groups of students, with whom they meet as part of the regular schedule to address academic and socioemotional issues.
were open, intermediaries were charged with providing ongoing technical as-sistance, largely in the areas of leadership development, instructional support, and college-readiness services.
· Finally, new small schools were provided with start-up grants to support costs associated with implementation. Those schools that were affiliated with Gates-funded intermediaries received four- or five-year grants averaging $400,000 per school. Other new small schools received supplemental grants directly from the DOE.
Support for Start-up
As noted earlier, the district’s efforts to create new small schools was informed by pre-vious local school creation efforts. The implementation challenges that had been experienced historically were well documented, and district planners put several measures in place to buffer and support this wave of new small schools from similar pitfalls during their nascent years:
· Schools opened with only one founding grade of students (ninth grade), gradually phasing in by admitting an additional cohort each year until reaching capacity for all four grades of a standard high school curriculum.
· New small schools that opened between 2002 and 2007 were not required to serve English language learners or special education students in their first two years of start-up operations while internal capacity was still being built.20
· District offices that were devoted to new school support were intended to facilitate procurement and hiring issues (which were difficult logistically because the schools were new administrative entities) and to support issues related to school facilities and shared campuses.
In summary, between 2002 and 2008, the district established more than 200 new small schools, which were distinguished by several key features beyond their size. Over the course of that period, SSCs — academically nonselective small schools serving mostly disadvantaged students in grades 9 through 12 — emerged as a prevalent and established school model, particularly in those communities that had previously been served by the large zoned high schools.
20By their third year of operations, schools that opened between 2002 and 2007 were required to admit students with special needs. Schools that opened in 2008 or later were expected to serve students with special needs from their inception.