04 August 2020
Data mining techniques for complex application domains / Mahoto, NAEEM AHMED. - STAMPA. - (2013).
Original
Data mining techniques for complex application domains
Publisher: Published DOI:10.6092/polito/porto/2506368 Terms of use: openAccess Publisher copyright
(Article begins on next page)
This article is made available under terms and conditions as specified in the corresponding bibliographic description in the repository
Availability:
This version is available at: 11583/2506368 since: Politecnico di Torino
PhD in Information and System
Engineering
XXV cycle
III Facolt`
a di Ingegneria
Settore scientifico ING-INF/05
PhD Thesis
Data mining techniques for
complex application domains
Author:
Naeem Ahmed
Mahoto
Supervisor:
Prof. Elena
Baralis
Matr. 169222
Co-supervisor:
Prof. Silvia
Chiusano
March 2013
A.A. 2012/2013
All praise be to Allah, Lord of the worlds, the Beneficent, the Merciful, Who blesses us with His kindness, mercy and help that made me capable to accomplish my studies.
I feel great privilege to express my deep gratitude to my supervisor Pro-fessor Elena Baralis for providing me with the opportunity to work in the research in data mining, for her kind interest, valuable suggestions, encour-agement and guidance that leaded me at all levels.
I would like to give explicit credit to Professor Silvia Chiusano for her valuable tips and suggestions that made me able to focus on right things for the research. In addition, I am also grateful to all my research group colleagues Alessandro Fiori, Tania Cerquitelli for their suggestions at times, and specially Luca Cagliero for his help, and kind suggestions.
A very special thank is due from me to Giulia Bruno who guided, helped, and supported me at every step. It has been a pleasure working with these nice and generous people.
1 Introduction 1
2 Healthcare Data Mining 6
2.1 Knowledge discovery from healthcare data . . . 6
2.2 Related works . . . 7
2.2.1 Medical pathways mining . . . 8
2.2.2 Association rule mining in healthcare data . . . 9
2.2.3 Clustering techniques in healthcare data . . . 10
2.3 Extraction of medical pathways . . . 11
2.3.1 Frequent patterns . . . 12
2.3.2 Frequent closed patterns . . . 13
2.3.3 Experimental results . . . 16
2.4 Extraction of exam correlations . . . 36
2.4.1 Association rule mining . . . 36
2.4.2 Experimental results . . . 40 2.5 Patient clustering . . . 44 2.5.1 Clustering techniques . . . 45 2.5.2 Clustering algorithms . . . 46 2.5.3 Distance measures . . . 52 2.5.4 Clustering evaluation . . . 54 2.5.5 Experimental results . . . 56
3 Textual Data Mining 67 3.1 Text mining . . . 67
3.2 Related works . . . 68
3.2.1 Text summarization . . . 69
3.2.2 Analysis and visualization of user-generated content . . 71
3.3 Text summarization . . . 75
3.3.1 Graph-based Summarizer (GraphSum) . . . 76
3.3.2 Experimental results . . . 85
3.4 Analysis and visualization of user-generated content . . . 93
3.4.1 Twitter Generalized Rule Visualizer (TGRV) . . . 94
3.4.2 Experimental results . . . 100 ii
4 Conclusion and future works 104
Index 107
List of Figures 107
List of Tables 108
Introduction
The emergence of advanced communication techniques has increased avail-ability of large collection of data in electronic form in a number of application domains including healthcare, e-business, and e-learning. Everyday a large amount of records are stored electronically. However, finding useful informa-tion from such a large data collecinforma-tion is a challenging issue. The data mining techniques are greatly adopted to retrieve valuable and interesting knowledge from such a huge amount of data. Data mining technology aims automat-ically extracting hidden knowledge (i.e., valuable patterns) from large data repositories exploiting sophisticated algorithms, just like a miner uses vari-ous tactics depending on the earth surface and outer environment to mine gold, iron, and other valuable metals from earth. The extracted information is significantly valuable in many application domains including business, ed-ucation, science, and healthcare systems. Knowledge discovery in databases (KDD), comprising of a series of steps, converts raw data into meaningful information [153]. Although several definitions are given for data mining and KDD, some as examples are described in the following:
• Knowledge discovery in databases is the non-trivial process of iden-tifying valid, novel, potentially useful, and ultimately understandable patterns in data.˝[53]
• Data mining is finding hidden information in a database.˝[45]
• Data mining is the process of extracting valid, previously unknown, comprehensible, and actionable information from large databases and using it to make crucial business decisions.˝[139]
• Data Mining is the process of automatically discovering useful infor-mation in large data repositories.˝[153]
The KDD process consists of the following main phases as illustrated in Fig.1.1: data collection, data selection, data preprocessing, data transforma-tion, data mining, and knowledge interpretation.
Figure 1.1: The KDD process [54]
Data collection. Data is collected from different units into a warehouse for the data mining process.
Data selection. Domain experts are involved at this phase to select the fields/attributes that are related to the problem.
Data preprocessing. The preprocessing phase cleans the dataset by re-moving erroneous and noisy data and providing missing values. This phase is also very much necessary for the final results because incorrect and erroneous data may lead towards incorrect information.
Data transformation. At this stage, the preprocessed data is trans-formed into suitable format so that mining algorithms can be directly ap-plied.
Data mining process. This phase normally uses different algorithms and techniques to get useful knowledge. However, certain algorithms can be used for some specific problem domains.
Information evaluation/interpretation. Domain experts interpret the mined patterns. The extracted information are then applied in the real world applications based on its correctness, completeness, and novelty.
Generally, data mining tasks are classified into two categories: descriptive and predictive. Descriptive mining emphasizes on general properties of the data in database. Predictive mining infers some predictive clues based on the current data in database [66]. Different data mining techniques are applied to get targeted information.
The hidden knowledge in the electronic data may be potentially utilized to facilitate the procedures, productivity, and reliability of several application domains. For example, in the healthcare context, the practitioners, pharma-ceutical personnel and medical staff can be provided guidelines by exploiting data mining techniques to enhance medical treatment procedures, optimal use of resources, and significantly lower time and cost. The online textual data may be found in either plain textual format and blogs or user-generated content (i.e., tweets or user comments on social networking). Whilst, the hidden knowledge inside textual data, may help to provide an insight in-formation about user behaviours, web services to support management and decision making strategies.
Data mining relies on databases containing raw data, thus it faces sev-eral difficulties. The major issues, which may be contained in database, can be incomplete data (missing values) and incorrect data (noisy data). Apart from these issues, the database may be limited to some specific application domain at limited scope, which in return cannot express the generalized out-comes for the domain. The problems and pitfalls are not only concerned with outcomes of data mining techniques but also fall into inadequate technolog-ical resources. For example, an application that results quick and correct outcomes based on small training datasets, may behave partially or com-pletely different while dealing with large amount of database. Similarly, small dataset may fit into memory space where as larger database may cause insufficient memory errors [33].
General purpose data mining approaches are often unsuitable for address-ing advanced analysis on complex domains. Data minaddress-ing solution must be tailored to the problem under analysis to support domain experts in discov-ering fruitful knowledge.
The PhD activity has been focused on novel and effective data mining approaches to tackle the complex data coming from two main application domains: Healthcare data analysis and Textual data analysis.
Healthcare data analysis. Since Healthcare problems are evolution-ary, complicated, and diversified, there is the need of automatic data
discov-ery to enhance medical. For example, the analysis of correlations between various symptoms for a given disease and data regarding resource utiliza-tion can provide informautiliza-tion to enhance the healthcare services. The ex-tracted knowledge leads healthcare systems to achieve profitable, effective, significantly accurate treatment procedures, and may possibly reduce costs. Moreover, healthcare data is diversified due to the high dimensionality of the data comprising of medical history records of patients having different symptoms. Besides, being health an essential aspect of life, efficient, sophis-ticated, and correct techniques and procedures are highly required to address healthcare data problems. However, since the manual analysis of vast amount of patients’ records is complex task, thus, novel data mining techniques are needed to utilize resources effectively, reduce cost, save time, and identify non-compliant processes timely.
The PhD research activity, in the context of healthcare data, addressed the application of different data mining techniques to discover valuable knowl-edge from real exam-log data of patients. In particular, efforts have been devoted to the extraction of medical pathways, which can be exploited to analyze the actual treatments followed by patients. The derived knowledge not only provides useful information to deal with the treatment procedures but may also play an important role in future predictions of potential patient risks associated with medical treatments.
Textual data analysis. Textual data is commonly available in elec-tronic documents or on social networks. Its peculiar features prevent the application of traditional data mining techniques. Hence, proposing novel data mining approaches to discovery of valuable knowledge from such kind of data is a challenging task.
The research effort in textual data analysis is twofold. On the one hand, a novel approach to discovery of succinct summaries of large document collec-tions has been proposed. On the other hand, the suitability of an established descriptive data mining technique (i.e., generalized association rule mining [143]) to support domain experts in making decisions has been investigated. Both research activities are focused on adopting widely exploratory data mining techniques to textual data analysis, which require to overcome in-trinsic limitations for traditional algorithms for handling textual documents efficiently and effectively.
This thesis is organized as follows. Chapter 2 describes the data mining techniques adopted in healthcare domain. This chapter presents the ap-proaches proposed to extract medical pathways from real healthcare data
of patients in three different pathologies considered as case studies. Chap-ter 3 introduces the text mining and presents the adopted approaches in multi-document summarization and investigation of user-generated content. Furthermore, the previous works on text summarization as well as on the analysis of social network data; the experimental results from real-world data and performance of the proposed approaches are also reported. Finally, Chapter 4 draws conclusions and discusses the future developments for the proposed approaches.
Healthcare Data Mining
This chapter describes data mining techniques for healthcare domain. The knowledge discovery from healthcare data is presented in Section 2.1 and the related research work in Section 2.2. The proposed approaches for the extraction of medical pathways are reported in Section 2.3, while for exam correlations in Section 2.4 and Patient clustering in Section 2.5.
2.1
Knowledge discovery from healthcare data
The introduction of electronic medical records has made available a large amount of medical data, storing the medical history of patients. This large data collection can be profitably analyzed by using data mining techniques to extract a variety of information, for example the relationships between medical treatments and final patient conditions, or the medical protocols usually adopted for patients with a given disease [26]. Data mining focuses on studying effective and efficient algorithms to transform large amounts of data into useful knowledge [153].
An actual problem in this domain is to perform reverse engineering of the medical treatment process to highlight medical pathways typically adopted for the specific health conditions, as well as discovering deviations with re-spect to predefined care guidelines. The medical pathway is a course of treatment performed by a certain patient to cure a certain disease, and is prescribed by the medical experts. The standard medical pathways define care guidelines for a number of chronic clinical conditions, specifying the course of treatment (i.e., sequences or patterns) and timing of actions nec-essary to perform for a given disease in an effective and efficient way. Thus,
the discovered knowledge can support healthcare organizations in improving the current treatment processes or assessing new guidelines.
Figure 2.1: Knowledge extraction process
The PhD research activity aims at extracting useful knowledge from real healthcare data. The knowledge extraction process is carried out by means of well established data mining techniques such as sequential pattern mining [4], association rule mining [2] and clustering techniques [153] as presented in Fig. 2.1. The proposed approaches are described in details later in this chapter.
2.2
Related works
Many healthcare applications are developed for enhancement of the health-care management as well as patients’ health-care [1]. Everyday, a large collection of medical data are stored in electronic format in healthcare organizations. The analysis of such an immense amount of data is a complex and very difficult task, since each patient has his/her medical history and disease complexities and conditions. Therefore, the investigation of medical data is an open and challenging issue. To cope with this problem, data mining techniques have taken great attention to investigate large collection of medical data [67]. For example, [26] demonstrated medical care enhancement, reduction in time and cost from large medical data records. The decision support tools in healthcare exploiting data mining techniques are reported in [84, 116, 138], however, none of them worked on real dataset for the experiments.
Data mining studies are recommended to carry on in medical field by [15]. Furthermore, well established sequential pattern mining [4] technique has been successfully exploited for analyzing electronic medical data. [147] reported data warehousing and data mining techniques essential for the pro-vision of evidence-based guidelines for clinicians. The work in [160] promoted data warehousing and data mining activities for clinical and administrative data in healthcare management. [148] presented prediction model to pre-dict pressure ulcer development. The model exploits data mining techniques namely Mahalanobis Taguchi System (MTS) [150], Support Vector Machines (SVMs) [158], Decision Tree [120] and Logistic Regression (LR) [72] to pre-dict incidence of pressure ulcers, which helps to take care of surgical patients and reduce occurrences of pressure ulcers; thus ensuring good health. More-over, MTS performs better in comparison with other techniques applied in the research [147].
Data mining techniques such as association rules [2], clustering [153], sequential pattern mining [4] and classification [153] are essential in building the new healthcare applications. These sophisticated algorithms are applied to obtain relevant information from medical data. The extracted information provides a number of benefits such as helping physicians, deeply investigation of treatment processes and helping in building of standard care guidelines [6]. The literature about exploitation of different data mining techniques in healthcare data is reported in the following.
2.2.1
Medical pathways mining
A number of research is carried out for enriching and refining clinical guide-lines to support medical pathways (also clinical pathways) and practices, disease management and resource utilization [30, 73, 76]. Clinical pathway mining is an essential aspect aiming at discovery of medical patterns [73]. Standard medical pathways, also termed as clinical pathways, are defined as care guideline for a variety of prolonged clinical conditions. These pathways postulate the necessary sequence and timing of actions to offer treatments to patients. The adoption of such guidelines help healthcare management to control both their treatment processes as well as costs [23, 117]. The clinical pathways and clinical guidelines may differ from each other due to administrative reasons; clinical guidelines require consensus between medi-cal experts, however, clinimedi-cal pathways imitate a-priori treatment of patients [5, 73, 160].
brain strokes are reported in [92]. The obtained patterns help in prediction of patients´admission in hospitals. A data mining framework for finding alternative practices and evaluation of liver disease is reported in [136]. The prototype was demonstrated in Taiwan and Mangolia. However, using cloud computing [29] and Service Oriented Architecture (SOA) [49], the framework could be shared in other countries. A role of predictive data mining in clinical medicines is discussed in [15]. The use of semantic web technologies, precisely ontologies and semantic rules for integrating clinical pathways in clinical decision support system is reported in [171].
A variety of techniques for clinical pathways analysis is proposed. These techniques help to either redesign or optimize the existing clinical pathways [132]. Among such techniques clinical statistical pathway analysis can also be exploited for investigation of medical pathways, for instance, statistics of pathway abort rate and pathway coincidence rate [46, 166]. The medical experts interpret the set of patterns of several patients to deeply analyze treatment procedures [73]. The mining of closed clinical pathways from clin-ical workflow logs, which record medclin-ical behaviours as events in patients’ course of treatment is described in [73]. The work in [73] detects most of the regular frequent clinical pathways given a clinical workflow log. However, the infrequent pathways, which are variants and/or missing in extracted path-ways need to be discovered and properly analyzed.
The frequent sequence extraction from exam log data for analysis of med-ical pathways of diabetic patients is proposed in [10]. A self-learning expert system for identifying symptoms in Traditional Chinese Medicine by means of data mining techniques, particularly, using improved hybrid bayesian net-work learning algorithm is discussed in [164]. The proposed system in [164] is data driven in nature and constructs knowledge base by learning auto-matically from clinical data and the knowledge of experts. It differs from rule-based systems that inherent knowledge through interactions between experts and knowledge engineers.
2.2.2
Association rule mining in healthcare data
The association rule mining is greatly exploited in medical domain for ana-lyzing the relationships between various symptoms for a given disease. The possible side effects of using multiple drugs during pregnancy period are pre-sented in [31] using association rule mining [2] approach. [31] used SmartRule technique (spreadsheet software) to mine association rules from a stored tab-ular pregnancy data and achieved Maximum Frequent Itemsets (MFI) for a
user given minimum support threshold. The association rules are obtained with targeted attributes from a selected subset of MFIs. Further, the resul-tant rules are arranged in hierarchical tree structure. The work in [31] high-lighted and warned about the drugs that may cause harm to unborn babies. The impacts in management strategies against human immune-deficiency virus (HIV) are addressed in [62] using decision tree and association rule mining techniques. Several data mining techniques are addressed including diagnosis of heart disease [137] and prediction of heart attacks in [1, 144].
A bridging rule concept is proposed in [173], which is a kind of outlier and a new type of patterns. Further, [173] investigated associations between two or more conceptual clusters. The antecedent and consequence of bridging rule contained in different clusters. For example, consider two clusters Ca
and Cb, each of the cluster comprises of some data objects, e.g., Ca = {ca1,
ca2, ca3, ..., can} and Cb = {cb1, cb2, cb3, ..., cbn}. The data objects of each
cluster may be having relationships among themselves. A rule ca1 ⇒ cb1 is a bridging rule, since its antecedent and consequence belong to different conceptual clusters. A bridging rule is similar to association rule but it differs in two reasons:
i. It can also be extracted from infrequent patterns ii. It is measured by its importance
The bridging rule helps to discover information that might have been missed during clustering and classification of the concepts [173].
2.2.3
Clustering techniques in healthcare data
Clustering algorithms are widely adopted in several medical applications for different viewpoints. An approach for discovery and integration of frequent sets of features from distributed databases is presented in [43] by means of unsupervised learning (i.e., hierarchical clustering [81]). Precisely, frequent sets are extracted from distributed datasets and then are merged into a single frequent itemset. Moreover, after applying hierarchical clustering, indexing is measured for quality results [43]. Building analytical models of patients flow in hospitals is demonstrated in [77] using k-means clustering [82]. [77] emphasized on the data preparation phase as an essential step that affects the quality of solutions. Further, the size of the dataset is reported as main affecting factor to the solutions [77].
The design of the care model for patients for a given collection is reported in [22]. The approach in [22] identifies interested set of patients, then builds patients’ care model (i.e., patterns of patients’ care) and provides descriptions
of each pattern. Finally, these patterns are clustered to group similar patterns by exploiting agglomerative hierarchical clustering [81]. The work in [154] collects the real dataset of blood donors from Hacettepe University Hospitals’ Computer Center. Exploiting Two-Step Cluster method [142] for clustering, Classification and Regression Tree (CART) [20] method for classification, Testik et al. [154] discovers arrival patterns of the blood donors.
A graphb-coloring clustering technique is reported in [47], which is com-pared with agglomerative hierarchical clustering [81] and an existing system in the french healthcare system. The approach aimed to find the hospital stays of patients. A probabilistic clustering model is proposed in [99] for the high-dimensional, temporal sparse, and uncertain electronic healthcare data. The model exploited empirical prior distribution for dealing the spar-sity issues of the ten years data, collected from pediatric intensive care unit (PICU) at Children’s Hospital Los Angeles.
2.3
Extraction of medical pathways
The medical pathways (also called clinical pathways) actually done by pa-tients are extracted by using the well established sequential pattern mining technique. Sequential pattern mining [4] aims at identifying and extracting frequent sequences of events from the data collection. In addition, it plays an essential role in healthcare data for identifying hidden and interesting patterns for a given pathology.
The PhD research activity presents identification, detection, and eval-uation of hidden patterns from raw healthcare data called exam-log data, which is an electronic storage of events of the physical diagnostic medical examinations (i.e. medical tests or services) with their corresponding times-tamps. More specifically, the exam-log data has been analyzed to extract interesting medical pathways against the standard medical pathways (i.e., care guidelines). The research activity rebuilds the actual patients’ treat-ment procedures (i.e. medical or clinical pathways) from an operational raw medical data and allows to detect the following information:
1. Set of examinations frequently done together 2. Sequences of set of examinations frequently done 3. Set of sequences frequently followed
An examination (hereafter “exam”) is a physical diagnostic test per-formed by a patient for a certain pathology. A set of examinations (hereafter “exam set”) is a collection of exams, which reports the exams done together by patients. A sequence of set of examinations (hereafter “exam sequence”) actually reveals the temporal relation between the exam sets followed by pa-tients. Formally exam set and exam sequence are described in the Definitions 2.3.1 and 2.3.2 respectively.
Definition 2.3.1 Exam Set. Let E = {e1, e2, e3,..., en} be the set of exams done by patients in a given healthcare data. An exam set S is a group of exams such that S E and 1 ≤ S ≤ |E|.
Definition 2.3.2 Exam sequence. Let E = {e1, e2, e3,..., en} be the set of exams and T = {t1, t2, t3, ..., tn} be the corresponding timestamps of the set of exams for patients. An exam sequence S = {{s1}{s2}{s3},...,{sn}} if t1 < t2 < t3 < ... < tn is an ordered temporal relationship among set of exams such that S E, where set of exams represent the order of exams in which these are diagnosed.
Definition 2.3.3 Frequent exam sequence. Let S be the exam sequence in a database D. A frequent exam sequence S0 is an exam sequence if its frequency is higher than the given minimum support threshold, where S v S0.
A sequence length is the number of exam sets present in an exam sequence performed by a patient for a given pathology. For example, letS={{e1, e2}{e3}} be an exam sequence performed by a certain patient, which comprises of two exam sets {e1, e2} and {e3}. Further, exam set {e1, e2} is done before {e3}, while sequence length of the exam sequence S is 2, since two exam sets are present in S. Furthermore, a frequent exam sequence (see Definition 2.3.3) has the support frequency equal to or higher than a given value and the support of an exam sequence (or exam set) is the frequency (i.e., number of occurrences) of the exam sequence (or exam set) in a given database.
The extracted knowledge highlights the medical pathways typically adopted by patients for a specific disease as well as the deviation amongst pathways. In the following description of frequent patterns and frequent closed patterns is presented.
Table 2.1: Sequence Database D Ids Sequences 1 A B C C A 2 A B C 3 B C D 4 A C D
2.3.1
Frequent patterns
Frequent pattern mining is one of the robust aspects of data mining for fre-quent data analysis. A pattern is a data behaviour, an arrangement or a form of data that might be of interest. A frequent pattern has support fre-quency equal to or higher than a given threshold. Several known algorithms have been exploited for finding frequent patterns/sequences such as Apriori [3] and PrefixSpan [119]. Frequent pattern mining is an expensive technique in terms of storage and computational power due to large data collections and thus, produce a large number of frequent sequences (FS) (or patterns). To prevent the cost of storage and computational power, several algorithms have been proposed to detect frequent closed sequences (FCS), described in the subsequent sections.
2.3.2
Frequent closed patterns
The frequent closed pattern (or sequence) represents compact form of the frequent sequences (i.e., frequent exam sequence). In other words, all the frequent sequences (i.e., exam sequences) are contained in frequent closed sequences (see Definition 2.3.4). The BIDE algorithm [163] is an example of the frequent closed sequence/pattern mining algorithms.
Definition 2.3.4 Frequent closed exam sequence. Let S be a frequent exam sequence. A frequent sequence S0 is a frequent closed exam sequence if there exists no proper super-sequences of S.
For example, consider the sequence database D reported in Table 2.1. The frequent sequences in the format sequence:support (i.e. C:4 indicate that the sequence containing item C has support 4) are the following:
A:3, B:3, C:4, D:2, AB:2, AC:3, ABC:2, BC:3, CD:2 The closed frequent sequences are the following:
C:4, AC:3, BC:3, CD:2, ABC:2
It is worth mentioning that itemsA,B,DandABare not frequent closed items because their super-sequences AC, BC, CD and ABC have their same support.
The compression factor (CF) evaluates the compactness of frequent closed sequences (FCS) instead of considering all frequent sequences (FS). The CF can be defined as:
CF = (1 − #F CS
#F S )% (2.1)
where #F CS is the number of all the frequent closed sequences and #F S is total number of frequent sequences at a given threshold value (i.e., minsup). For example, let D be a sequence database containing the following two se-quences:
s1 = {e1}{e2, e3}{e2} and s2 ={e2, e3}{e4}
Consider minsup = 2 (i.e., 100%). Then 3 frequent sequences are generated i.e., {e2}, {e3} and {e2, e3}, while the frequent closed sequence is only {e2,
e3}. Sequences {e2}, {e3} are not closed sequences since they are contained in sequence {e2, e3}.
When considering minsup = 1. Frequent sequences 17 (seventeen), and fre-quent closed sequences 3 (three) are extracted. The compression factor CF = 82% is achieved. Hence, frequent closed sequences significantly reduce the size of the solution set.
The BIDE algorithm
The BI-Directioanl Extension (BIDE) algorithm [163] is an efficient algo-rithm for mining frequent closed sequences. A sequence S is called closed sequence if there exists no proper super-sequences of S that has the same support as that of S [163]. The BIDE reported in Algorithm 1 uses depth-first-search technique to traverse the sequence tree. More precisely, it checks the closed sequences by applying BI-Directional Extension closure check-ing without candidate maintenance. This closure checks forward-extension events and backward-extension events to declare aprefix sequence as frequent closed sequence. The prefix sequence is defined in the Definition 2.3.5. Definition 2.3.5 Prefix sequence Let S = {e1, e2, e3,..., en} be a se-quence. A subsequence S is prefix i-sequence e1 of the S from the beginning of S to first appearance of item e1 in S.
Algorithm 1 BIDEalgorithm [163] – BIDE(S, minsup)
Require: A sequence database S and minsup
Ensure: Closed f requent sequences (Sk) ≥minsup 1: Sk =φ
2: Scan S once to f ind f requent 1−sequences F 3: for each f requent sequence Sp in F do
4: Build pseudo projected database S0 of Sp {Sp is pref ix sequence} 5: end for
6: for each f requent sequence Sp in F do
7: U se BackScan pruning method f or checking if Sp can be pruned
{BackScan uses ScanSkip to speed up the process}
8: if !P runed then
9: Compute backward−extension−item BEI of Sp 10: bide(S0, Sp, BEI, minsup){call bide procedure} 11: end if{if it can not be pruned}
12: end for
13: Return Sk
– bide(S0, Sp, BEI, minsup)
Require: a projected sequence database S0, pref ix sequence Sp, minsup
and back−extension−items BEI
Ensure: set of closed f requent sequences Sk 1: f ind local f requent items F I in S0
2: Compute f orward−extension−item F EI of Sp 3: if BEI+F EI = 0 then 4: Sk=Sk S Sp 5: end if 6: for each Sp0 in F I do
7: Build pseudo projected datatbase S00 of Sp0
8: end for
9: for each Sp0 in F I do
10: U se BackScan pruning method f or checking if Sp0 can be pruned
11: if !P runed then
12: Compute backward−extension−item BEI of Sp0
13: bide(S00, Sp0, BEI, minsup){bide procedure recursively calls itself}
14: end if
15: end for
Definition 2.3.6 Projected sequence. Let S = {e1, e2, e3,..., en} be a sequence and prefix i-sequence e1 be a prefix sequence ofS. A subsequenceS’ is a projected sequence, when first instance of prefix i-sequence e1 is removed from S.
For example, consider sequenceABCCA. Theprefix sequence-BCin sequence ABCCA is ABC. It should be noted that the first appearance of itemset BC is contained in its prefix sequence. The remaining part of the sequenceABCCAis CA, It is called projected sequence (see Definition 2.3.6) with respect toprefix sequence-BC. The complete set of projected sequences in a given sequence database D with respect to prefix sequence e1, e2, e3,..., en is referred to as projected database inD with respect to the prefix sequencee1,e2,e3,..., en.
For example, consider the sequence databaseD shown in Table 2.1. The projected database of prefix sequence-BC is {CA, φ, D, φ}, where φ indicates empty set. The forward-extension event checking generates locally frequent items with support of a prefix sequence since no candidates are generated. While backward-extension event checking is performed to handling the new sequence, which can be absorbed into already closed sequence.
The BIDE algorithm is very efficient because it saves time and tells about closed frequent sequences in which all the frequent sequences are already con-tained. Like PrefixSpan algorithm [119], it also works on projected database sequences and does not generate candidates thus memory space is saved. Moreover, BIDE also does not keep history of all frequent sequences to find closed ones and is a time efficient algorithm. The algorithm consumes time during forward-extension and backward-extension phases and possesses lin-ear scalability property in terms of the number of sequences in a database.
2.3.3
Experimental results
The extracted medical pathways from the real datasets are presented in this section, particularly, frequent closed exam sets (hereafter “frequent exam sets”) and frequent closed exam sequences (hereafter “frequent exam se-quences”). Initially, the raw medical data has been prepared for the knowl-edge extraction process. In the following, details about data preparation are reported.
2.3.3.1 Data preparation
The main terminologies concerning data, such as data set and data attribute are described in the following.
Data. Data can be numbers, characters, images, or other method of record-ing that could be assessed by human. In computer terminology, it is collection of facts and figures, and can be processed, interpreted, stored, and/or trans-mitted on some digital channel.
Data set. Data set is a collection of data objects, and a data object could be a record, point, vector, pattern, event, observation and entity.
Data attribute. An attribute is a property of an object and attributes of different objects may differ. For example, “person” is a data object, whose attributes can be “height”, “hair color” and “age”. Thus, different persons can have different attributes.
The data preparation is one of the first essential steps to transform data into a suitable format, which can be further processed. The data is processed to remove unnecessary attributes and missing values. Then, the cleaned data can be transformed into specific format suitable for the post-processing operations. The complete procedure of data preparation is illustrated in Fig. 2.2.
Figure 2.2: Data collection and preparation
The real raw healthcare data (i.e., exam-log data) were collected from medical units of Local Sanitary Agency of the Asti province - Italy. Then the collected data were integrated into a single common structure. Table 2.2 reports few example records of exam-log data. Three different exam-log data (considered as reference case studies in the PhD research) comprises of three different types of pathologies: (i) Diabetic patients, (ii) Colon-cancer patients, and (iii) Pregnant women.
The provided exam log data has been preprocessed to remove noisy and irrelevant data attributes. All irrelevant data attributes such as medical
Table 2.2: Patients’ exam-log data
Patient ID Date Exam ...
1 10/01/07 Capillary blood ... 1 10/01/07 Glucose ... 2 25/05/07 Eye examination ... 3 15/03/07 Glucose ... 3 05/04/07 Venous blood ... 3 05/04/07 Urine Test ... ... ... ... ...
Table 2.3: Sequence database
Patient ID Exam sequence
1 {Capillary blood, Glucose}
2 {Eye examination}
3 {Glucose} {Venous blood, Urine Test}
... ...
branch codes and description about the diagnostic exams, patients’ addresses and other information have been removed and only attributes patient id, exam date, exam name are selected. Then, the cleaned and integrated data have been transformed into a sequence database (see Definition 2.3.7). The data transformation is reported in the following.
Definition 2.3.7 Sequence Database. Let P = {p1, p2, p3,..., pn} be the set of patient-identifiers and E = {e1, e2, e3,..., en} a temporal list of exam sets done by the patients in P. A sequence database D is a collection of tuples, where each tuple is a set of pairs (ps,ei), ps P, ei E.
Data transformation The data is converted into a specific format suitable for subsequent operations. For example, in the medical exam log data, the name of the exams and their timestamps along with patients iden-tifiers are needed for analyzing treatment procedures (i.e. medical pathways). Table 2.3 represents the outcome of the data transformation process. The exams of each patient are represented in such a way that exams done in same dates come together within a subgroup delimited by comma, where exams done on different dates are delimited by curly braces. For instance, Table 2.2 indicates that Capillary blood and Glucose exams are done by the patient id-1 at the same date. Similarly, the exams performed at different dates are
Table 2.4: Characteristics of exam-log data
Sr. No. Exam-log Name Exam-log records No. of patients No. of distinct exams Avg. exam length per patient
1 Diabetic 95788 6380 159 15
2 Colon-cancer 2071 157 123 13
3 Pregnancy 29679 905 327 32
separated with curly braces (see patient id-3 in Table 2.3).
Data characteristics The three raw exam-log data considered in this study are transformed into the corresponding sequence databases as input to knowledge discovery process. Table 2.4 reports the characteristics of each exam-log data. The diabetic dataset comprises of 95788 log records of 6380 patients, the colon-cancer dataset has 2071 logging exams records of 157 pa-tients and the pregnancy dataset exam-log data contains 29679 log-records of 905 patients. The numbers of distinct exams show the presence of differ-ent exams in the exam-log data, where as average exam length is the mean of number of exams done by a patient. The diabetic dataset contains min-imum exam number 1 and maxmin-imum 154, while minmin-imum 1, maxmin-imum 92 for the colon-cancer dataset, and 1 as minimum, 172 as maximum exams are recorded for the pregnancy dataset.
Data segmentation Data segmentation can be defined as a process or an activity of partitioning a given data set into small segments (chunks or groups) based on a specific criterion. The segmentation process needs some information about the data objects for portioning. For example, In the sequence database of pregnancy dataset, the amniocentesis exam is a crucial exam during pregnancy period. The women, who did amniocentesis exam differ from the rest of women in the database. These differences lead towards insight knowledge about the actual patterns. Therefore, sequence databases may be segmented for investigation of differences among various patients of a pathology.
The extraction of medical pathways from each of the three real sequence databases of different pathologies are reported in the subsequent sections.
2.3.3.2 Case study - Diabetic sequence database
The extracted medical pathways from the diabetic sequence database (see Section 2.3.3.1) are of two types: (i) frequent exam sets performed together
in the same date and (ii) frequent sequences of exam sets. The adopted ap-proach is shown in Fig. 2.3 that includes additional information as shown in the block Domain constraints. Domain constraints help to focus on specific data analysis and following domain constraints:
Target exam set. The most expensive or crucial exam sets are consid-ered. The target exam sets are selected from exam log data during the data preparation phase (see Section 2.3.3.1). Only those patients who have been diagnosed with target exams are considered. This approach is particularly essential while dealing with infrequent critical exams for a given pathology. Medical pathways length. This constraint helps to focus on the analysis of patient specific clinical history (e.g., exams done multiple times in a year). This constraint is also inserted in the data preparation phase to discard the patients whose clinical history does not meet the constraint.
Figure 2.3: Medical pathways extraction process (diabetic dataset) Furthermore, the extracted medical pathways have been evaluated with the support of a medical expert in accordance with medical domain knowl-edge and available medical guidelines. During the evaluation, the following scenarios have been detected:
Correct pathways. The extracted medical pathways are coherent with the medical knowledge. Thus, the treatment process followed by such patients is correct.
New or alternative pathways. The extracted medical pathway is not available in the medical domain knowledge. For example, the available med-ical guidelines do not cover rare and specific cases of a given disease. This scenario allows to identify common medical pathways followed by patients,
who could be exploited in the assessment of new guidelines.
Erroneous pathways. The extracted medical pathway is erroneous be-cause it is not found coherent with medical domain knowledge. For example, it comprises of different or additional exams, or some exams are missing. These pathways could be for instance because of incorrect data collection procedures.
The detailed analysis of the extracted medical pathways for the diabetic sequence database is described in the following. In particular, exam frequen-cies, frequent exam sets, frequent exam sequences and medical pathways derived by injecting the target exam set constraint.
Exam frequencies
Though diabetic sequence database contains the medical exam-log data of one single year, a wide spectrum of clinical treatments is covered. The most frequent exams reflect the standard and routinely check-ups exams of dia-betic patients for monitoring sugar concentration present in the blood. For example, glucose level (84.76%), venous blood (79.25%), capillary blood sam-ple (75.03%), and urine test (74.87%). Serious diabetes complications are also detected with crucial exams having lower frequencies. The total choles-terol level (35.96%) and the triglycerides level (35.69%) exams detect the cardiovascular complications. The exams concerning liver disease alanine aminotransferase enzyme (30.14%) and aspartate aminotransferase enzymes (29.51%) are some examples of the complex cases. In the diabetic treatment, exams monitoring the eye status are also available to diagnose possible prob-lems on the eye retina (retinopathy), e.g., the examination of fundus oculi (27.24%) and laser photocoagulation (2.24%). The later exam, being more specific for retina repairing, has a significantly lower frequency.
Frequent exam sets
The frequent exam set represents the exams frequently done together in the same day by the patients. The extracted exam sets are found consistent to medical domain knowledge for the diabetic treatment, but few anomalies are also detected. The glucose level is usually measured in association with atleast one of the three exams venous blood, capillary blood and urine test. For example, exam sets {glucose level, urine test} (74.86%), {glucose level, capillary blood}(74.40%), {glucose level, venous blood}(70.99%) have been extracted having higher frequencies. Besides, 5.56% of the patients have been
found, whose exam sets have atleast once glucose level exam not associated with any of the three exams. Such sequences clearly reflect an error condition, because the evaluation of glucose level exam without any of the three exams is not possible. These errors may have been present in the dataset because of incorrect data entry process, where incomplete data have been stored.
Frequent exam sequences
The exam sequences are found coherent with diabetic treatment. For exam-ple, glucose measure for monitoring disease status throughout the year are repeatedly performed. The most frequent sequences for the diabetic disease describe this behaviour, e.g., glucose level is repeated two times (58.20%) of patients, three times (31.83%) and four times (14.78%) during the considered year of the dataset.
Pathways including target exams
The extraction of the medical pathways related to the specific exams from the diabetic dataset have been carried out by selecting a subset of the dataset in data preparation step. The subset comprises of patients, who did atleast one of the target exams. For example, the damage of eye retina (retinopathy) is a serious diabetic disease degeneration. To repair retina lacerations, the retinal photocoagulation therapy is used. The patients affected of retinopa-thy usually require multiple therapy treatments. The subset of 143 patients (i.e., 2.24% of the total patients) including retinal photocoagulation therapy have been selected for the analysis of the patients who did atleast once reti-nal photocoagulation therapy. The pathways provide the insight knowledge of the retinal disease patients, e.g., therapy is repeated two times (50.35% of the subset, but 1.13% of the total) or three times (25.17% of the subset, but 0.56% of the total).
2.3.3.3 Case study - Colon-cancer sequence database
Health problems require proper and accurate medication to cure deadly dis-ease in time, such as cancer. Colon-cancer is one of the deadly disdis-eases which may cause cancer-related death. However, early diagnosis may lead towards proper and complete cure. There is a large availability of diagnos-tic guidelines for the colon-cancer disease, for instance, ASCRS [7], Cancer
Care Ontario [114], Commissione Oncologica Regionale Health Care Guide-line [125], Effective Health Care [24] [25], Institute for Clinical System Im-provement [56], NCI [109], and RCS [111]. The possibility of a very general level agreement of all guidelines on the same sequence of exams could be con-tended. Medical guidelines, usually, try to provide a reliable and accurate diagnosis of the cancer presence and at the same time to avoid as much as possible the adoption of expensive or invasive procedures. The International Classification of Diseases, Clinical Modification (ICD IX-CM classification) [113] is used in assigning codes to diagnosis and procedures. In the diag-nosis of colon-cancer, Colonoscopy is considered gold-standard examination. The screening guideline prescribes a general physical examination, followed by a colonoscopy, a closed biopsy, and a diagnostic ultrasound of abdomen. Metastasis at the lungs are instead sought through a chest radiograph and confirmed by a Computerized Axial Tomography (CAT) scan.
Figure 2.4: Medical pathways extraction process (colon-cancer dataset) Guidelines generally do not suggest CAT of Abdomen as alternative method, instead these suggest the more invasive Colonoscopy [167]. Besides, the matter of fact is that the possibility of detection error by performing CAT is too high to suggest it. The methodology adopted for analyzing colon-cancer dataset is shown in Fig. 2.4. The sequence database created in the data preparation (see Section 2.3.3.1) has been segmented to group patients with similar behaviours. Then, frequent medical pathways (i.e. fre-quent exam sets and exam sequences) are extracted from each segment and compared to detect the differences in patients’ behaviour (see Fig. 2.4).
Table 2.5: Characteristics of four segments (colon-cancer dataset)
Segment Diagnostic exam Number of patients
1 Colonoscopy or Closed Biopsy 32
2 CAT of Abdomen 37
3 X-Ray of Abdomen 50
4 None of the previous four diagnostic exams 38
The medical guidelines prescribe only colonoscopy and closed biopsy as diagnostic exams for colon-cancer. Alternative protocols occur when patients perform at least one different diagnostic exam, mainly CAT of Abdomen or X-Ray of Abdomen. The four main segments have been identified from colon-cancer sequence database, whose characteristics are summarized in Table 2.5. The patients of Segment1 show only colonoscopy or closed biopsy as diagnostic exams. They have been neither diagnosed CAT of Abdomen nor X-Ray of Abdomen. This segment represents patients, who followed only the prescribed exams in the guidelines. For this reason, it has been used as a reference case for the medial pathway analysis. Likewise, Segment2 and Segment3 represent patients who have been diagnosed with least one diagnostic exam not prescribed in the guidelines.
For example, Segment2 contains patients, who did at least once CAT of Abdomen exam along with other diagnostic exams, and those who did at least once X-Ray of Abdomen exam are in Segment3. The patients, who did not follow the above four diagnostic exams, even if they were affected by the disease, are placed into Segment4. Moreover, the Segment2 and Segment3 are not mutually exclusive i.e., patients, who did both CAT of Abdomen and X-Ray of Abdomen exams belong to both segments. However, both segments do not overlap with the Segment1 and Segment4. The main blocks the approach are described in the following.
Mining frequent exam sets The analysis has been carried out in each segment for the identification of the frequent exam sets. In Fig. 2.4, the upper part presents the main steps. Firstly, the exam log data transformed into a sequence database is segmented. Then, data segments are represented as a set database reporting the different exams done by each patient. All the irrelevant information about the exams have been omitted for the analysis such as when exams have been diagnosed (i.e., timestamps) and redundancy (i.e., repetition of the exams). Then, the mining process is applied to extract frequent exam sets on each segment separately.
Table 2.6: Statistics of four segments (colon-cancer dataset) Avg. num. Avg. num. Avg. time
of cluster of exams dimension per patient per cluster per cluster
Segment1 3.0 2.7 3.5
Segment2 3.0 5.7 7.3
Segment3 2.6 7.0 7.0
Segment4 1.9 3.6 6.3
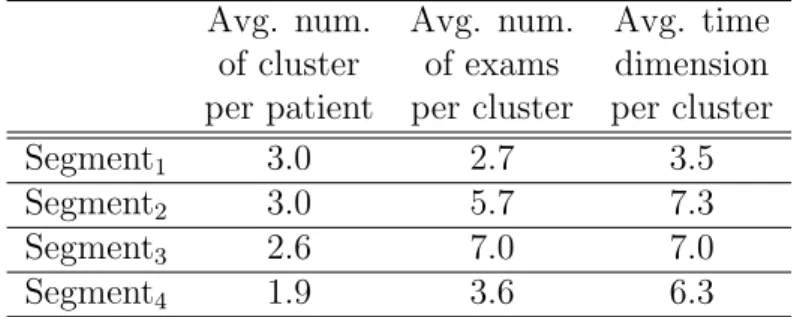
Mining frequent exam sequences The temporal relationships among exams, i.e., which exams frequently precede or follow other exams, have been investigated by considering the analysis of frequent exam sequences. The temporal order of two consecutive exams may not be always relevant. For instance, when two consecutive exams have the difference of few days, the or-der of the exams could be because of scheduling reasons instead of constraints for the prescription. Therefore, the adopted approach applies a clustering al-gorithm to group together the exams diagnosed in a ’close’ period of time. Each cluster represent a set of exams. However, the order of the exams within the cluster has not considered. Further, sequence database is built from clusters and ultimately analyzed to extract frequent exam sequences, as reported in the lower part of Fig. 2.4.
Clustering of exams The DBSCAN algorithm [50] (see Section 2.5.2) has been applied to group together exams in a ’close’ time period. To group two consecutive exams into a single cluster, the notation of temporal distance be-tween the exams should be defined. In the proposed approach, the maximum distance represents the maximum time interval between two consecutive ex-ams. The euclidean distance (see Section 2.5.3.1) is used to measure distance between two consecutive exams. The approach groups two consecutive ex-ams if the maximum time interval between them is not greater than 12 days. This constraint caused an average cluster time dimension of around 7 days, that means that, on average, exams done within a week are considered in the same cluster.
The clustering results are reported in Table 2.6. Almost the same number of patients is grouped together in Segment1, Segment2, and Segment3, whilst the number of patients is significantly decreased in Segment4. The Segment1 averagely has a lower number of exams per cluster in comparison with the other three segments. This behaviour of Segment1 reveals that patients have quite homogeneous behaviour and they have been diagnosed exams in a very
short time interval. The patients in the other clusters instead have a quite diversified behaviour, since they did more exams at a larger time interval.
The analysis of the medical pathways extracted from the colon-cancer dataset is reported in the following.
Exam frequencies
Colonoscopy, Closed Biopsy, and Diagnostic Ultrasound of Abdomen exams specified in the care guidelines are the most frequent in Segment1. While Electrocardiogram exam is often diagnosed before surgical operation. The rest of the exams in Fig. 2.5 helps to investigate side effects of colon cancer. The results of Segment1 are consistent to medical guidelines for the colon cancer.
Figure 2.5: Exam frequencies in Segment1 (colon-cancer dataset) The behaviour of patients in Segment2 and Segment3 is more diversified than that of the Segment1. For example, the frequency of exams in the two segments is higher than that of in Segment1. Each patient has been diag-nosed with a larger set of different exams (averagely 8.7 in Segment2 and 7.9 in Segment3) and a large number of different exam sets is present in both segments (178 sets in Segment2 and 189 in Segment3, that is almost three times the number of exam sets in Segment1). Precisely, the most frequent exams in both segments are almost the same and with slightly differences in their frequencies. For instance, Routine Chest X-Ray (49.4% in Segment2 and 58% in Segment3), Diagnostic Ultrasound of Urinary System (18.5% in
Segment2and 11% in Segment3), and Diagnostic Ultrasound of Digestive Sys-tem (29.3% in Segment2 and 20.9% in Segment3). The later two exams have been diagnosed by single patient in Segment1. To detect possible metastasis typically two exams CAT Scan of Thorax (43.2% in Segment2 and 20% in Segment3) and CAT Scan of Head (13.5% in Segment2and 10% in Segment3) are found most frequent ones.
Since Segment4 comprises of patients who have been diagnosed none of the four exams (i.e., Colonoscopy, Closed Biopsy, CAT of Abdomen and X-Ray of Abdomen) recommended in medical guidelines, therefore, no medical pathways have been extracted. Moreover, most of the patients were diag-nosed one or two exams. These exams may reflect the alternative diagnosis for the colon cancer. A possible reason for lack of diagnostic exams may be the data entry errors or the patients may have been privately diagnosed. An-other possible explanation may be that some patients have been diagnosed during surgical operation.
Frequent exam sets
The analysis of frequent exam sets highlight the homogeneous behaviour of the patients in Segment1, few different exams i.e., on average 4.8 exams are the most frequent for each patient. Moreover, the number of different exams are quite low in this segment (about 58). Only few patients did larger set of exams having different exams. The larger exam sets may have occurred due to complication of disease or some additional exams for other pathologies. For example, 25% patients have done more than 6 different exams, and 6.3% did more than 10. One patient has been found having more than 10 exams, including Bronchoscopy and Bronchial Biopsy. These exams probably may be due to another pathology.
In Segment1, 62.5% of patients comply with medical guidelines by doing both Colonoscopy and Closed Biopsy exams. While 37.5% have been diag-nosed having only one of the two exams i.e., 25% did only Colonoscopy and 12.5% did only Closed Biopsy. This may be an erroneous condition, since Colonoscopy should always come before Closed Biopsy for the provision of the tissue sample needed for later exam. This error condition may be due to incorrect data entry, or some exams were done privately. Thus only partial entry has been recorded. The patients, who strictly comply with the medical guidelines are 18.8%, and they were diagnosed Colonoscopy, Closed Biopsy, and Diagnostic Ultrasound of Abdomen. In both segments Segment2 and Segment3, the large number of different exams are done. This behaviour
Table 2.7: Exam sequences in Segment1 (colon-cancer dataset)
Exam sequence Frequency (%)
{Colonoscopy, Closed biopsy} 62.5
{Colonoscopy, Closed biopsy},{Electrocardiogram} 28.1
{Diagnostic Ultrasound of Abdomen},{Colonoscopy} 25.0
{Colonoscopy},{Routine Chest X-Ray} 25.0
{Electrocardiogram},{Routine Chest X-Ray} 21.9
{Colonoscopy, Electrocardiogram} 18.8
{Colonoscopy, Diagnostic Ultrasound of Abdomen} 15.6
{Electrocardiogram, Routine Chest X-Ray} 12.5
{Electrocardiogram},{Colonoscopy},{Electrocardiogram} 12.5
leads towards a significant increase in costs, for instance, CAT Scan of Ab-domen is found together either with Colonoscopy (46% patients) or X-Ray of Abdomen (62.2% patients) in Segment2. X-Ray of Abdomen exam found to-gether with CAT Scan of Abdomen 46% and Colonoscopy 26% in Segment3. Whilst medical pathways did not emerge in Segment4.
Frequent exam sequences
The most frequent exam sequences extracted in Segment1 and Segment2 are reported in Tables 2.7 and 2.8 respectively. The clustered exam sets are de-limited by two brace brackets and are diagnosed within a de-limited time interval (i.e., 12 days). For example, referring to Table 2.7, both exams Colonoscopy and Closed biopsy are grouped together in the same cluster and 62.5% of patients followed this exam sequence. The two separate brace brackets rep-resent two clusters of exams, e.g., 28.1% patients did the exams Colonoscopy and Closed biopsy both in the same cluster and consecutive cluster has Elec-trocardiogram exam. In addition, some patients have performed repeatedly same exams. For instance, Electrocardiogram is done twice by 12.5% of patients in the same cluster. The repetition of exams may be due to the emergency hospitalization.
CAT Scan of Abdomen is diagnosed often with either Electrocardio-gram or Routine Chest X-Ray in Segment2. Likewise, 43.2% of patients did Colonoscopy, additionally they did CAT Scan of Abdomen in the same cluster. The repetition of the exams is more frequently done in Segment2 in comparison of Segment1, for instance, {Routine Chest X-Ray, Routine Chest X-Ray}59.5%, {X-Ray of Abdomen, X-Ray of Abdomen}45.9% and
{Electrocardiogram, Electrocardiogram} 37.8% of patients. However, the exam sequences {CAT Scan of Abdomen}, {X-Ray of Abdomen} 21.6% and
Table 2.8: Exam sequences in Segment2 (colon-cancer dataset)
Exam sequence Frequency (%)
{CAT Scan of Abdomen, Electrocardiogram} 70.3
{CAT Scan of Abdomen, Routine Chest X-Ray} 67.6
{Electrocardiogram, Routine Chest X-Ray} 64.9
{Routine Chest X-Ray, Routine Chest X-Ray} 59.5
{Routine Chest X-Ray, X-Ray of Abdomen} 56.8
{X-Ray of Abdomen, X-Ray of Abdomen} 45.9
{CAT Scan of Abdomen, CAT Scan of Thorax} 43.2
{CAT Scan of Abdomen, Colonoscopy} 43.2
{Electrocardiogram, Electrocardiogram} 37.8
{CAT Scan of Abdomen},{X-Ray of Abdomen} 21.6
{X-Ray of Abdomen},{CAT Scan of Abdomen} 16.2
{CAT Scan of Abdomen, CAT Scan of Thorax},{Routine Chest X-Ray} 10.8
{CAT Scan of Abdomen},{Routine Chest X-Ray},{Routine Chest X-Ray} 13.5
{X-Ray of Abdomen}, {CAT Scan of Abdomen} 16.2% of patients reflect that there is no any clear evidence for the ordering of both exams. CAT Scan of Abdomen follows X-Ray of Abdomen by 21.6% of patients, while the reverse order appeared 16.2% of patients. The results of Segment3are similar to Segment2, Routine Chest X-Ray is usually repeated. This behaviour is not only appeared in the same cluster but also in longer time intervals (i.e., in consecutive clusters). For example, {Routine Chest X-Ray} {Routine Chest X-Ray} is diagnosed by 28% of patients.
2.3.3.4 Case study - Pregnancy sequence database
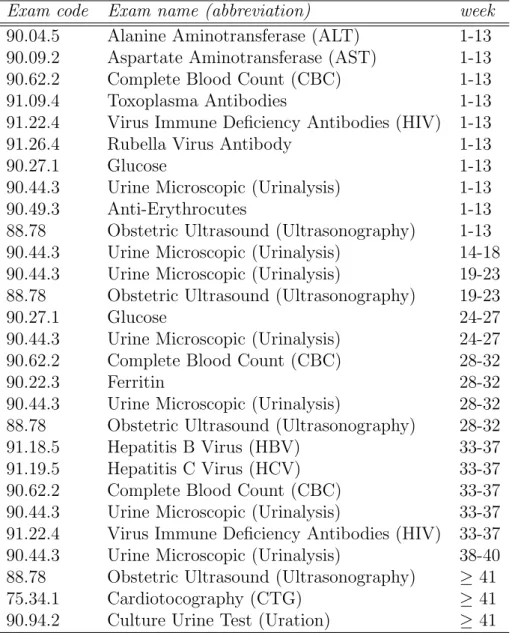
Determination of fetus conditions, such as whether it comprises of certain ab-normalities including established hereditary or instinctive genetic disorders, is monitored by testing the fetus before birth. Generally prenatal diagnostic testing involves such sort of testing, some of the tests, for instance, blood tests and Ultrasonography, are part of routinely prenatal care [57] [110].
Prenatal diagnostic exams are often distributed on weekly basis, for ex-ample, within first thirteen (13) weeks Complete Blood Count (CBC), Toxo-plasmosis antibody, Rubella Virus Antibodies, Virus Immune Deficiency An-tibodies (HIV), Urinalysis (Urine microscopic exam), Obstetric Ultrasound (Ultrasonography), concentration of Glucose level in the blood, and Indirect Coombs Test or Anti-erythrocyte antibody detection are performed. The duration between 19th and 23rd week needs repetition of Ultrasonography
and Urinalysis examinations. The Urinanalysis and concentration of Glu-cose level in the blood are repeated in between 24th and 27th week of the
Figure 2.6: Medical pathways extraction process (pregnancy dataset) pregnancy period. Whilst in the period of 28th and 32nd week, Urinalysis,
CBC, and Ultrasonography are performed again. Then, between the time period of 33rd and 37th week of pregnancy Hepatitis B antibody (HBV) and Hepatitis C antibody (HCV) tests are performed, and some tests are repeated including CBC, HIV and Urinanalysis. Finally, last weeks i.e., between 38th
and 40th, Urinanalysis is repeated and in the 41st week Ultrasonography and Cardiotocography tests are performed. [57]. The International Classification of Diseases, Clinical Modification (ICD IX-CM classification) [113] assigns codes to diagnosis and procedures. Table 2.9 reports timing of each prenatal exams as the medical guidelines for the pregnancy period.
The adopted approach for extracting medical pathways from pregnancy dataset is depicted in Fig. 2.6. The approach mainly comprises of three phases. Firstly, the collected data collection is transformed into sequence database and then, it is segmented to analyze the small group of patients separately. The considered dataset has 29679 logging records (see details in Table 2.4). All the exams performed by the 905 women who gave birth to a child are recorded in between July and December 2007. Secondly, pathways mining phase does the actual extraction of the medical pathways. Finally, the obtained results are evaluated based on available medical guidelines in the pathway evaluation phase.
Table 2.9: Guidelines for pregnancy exams
Exam code Exam name (abbreviation) week
90.04.5 Alanine Aminotransferase (ALT) 1-13
90.09.2 Aspartate Aminotransferase (AST) 1-13
90.62.2 Complete Blood Count (CBC) 1-13
91.09.4 Toxoplasma Antibodies 1-13
91.22.4 Virus Immune Deficiency Antibodies (HIV) 1-13
91.26.4 Rubella Virus Antibody 1-13
90.27.1 Glucose 1-13
90.44.3 Urine Microscopic (Urinalysis) 1-13
90.49.3 Anti-Erythrocutes 1-13
88.78 Obstetric Ultrasound (Ultrasonography) 1-13
90.44.3 Urine Microscopic (Urinalysis) 14-18
90.44.3 Urine Microscopic (Urinalysis) 19-23
88.78 Obstetric Ultrasound (Ultrasonography) 19-23
90.27.1 Glucose 24-27
90.44.3 Urine Microscopic (Urinalysis) 24-27
90.62.2 Complete Blood Count (CBC) 28-32
90.22.3 Ferritin 28-32
90.44.3 Urine Microscopic (Urinalysis) 28-32
88.78 Obstetric Ultrasound (Ultrasonography) 28-32
91.18.5 Hepatitis B Virus (HBV) 33-37
91.19.5 Hepatitis C Virus (HCV) 33-37
90.62.2 Complete Blood Count (CBC) 33-37
90.44.3 Urine Microscopic (Urinalysis) 33-37
91.22.4 Virus Immune Deficiency Antibodies (HIV) 33-37
90.44.3 Urine Microscopic (Urinalysis) 38-40
88.78 Obstetric Ultrasound (Ultrasonography) ≥ 41
75.34.1 Cardiotocography (CTG) ≥ 41
of similar characteristics of patients namelySegmentF ull−P eriod,SegmentAmnio
and SegmentN on−Amnio. The SegmentF ull−P eriod comprises of 455 patients
that have almost full pregnancy period. However, not all patients full history (i.e., 9 months diagnostic records) is available, this may be due to some of pa-tients had exams in a predicate structure. Therefore, for analyzing complete medical pathways of pregnant women, patients whose atleast 190 days (i.e., greater than 6 months) history is available are included inSegmentF ull−P eriod.
Another group of patients is segmented based on specific diagnostic exam, which highlights abnormal conditions. In pregnancy, one of the crucial exam-ination is Amniocentesis. This exam, being an invasive is used to determine genetic disorders about the unborn baby and this also diagnoses uterine in-fection. The examination of amniotic fluid that surrounds the unborn baby in the womb is carried out by Amniocentesis exam. Moreover, it is usually diagnosed after first 3 months of pregnancy period for women older than 35 years [57]. To analyze the medical pathways of women in critical conditions, the sequence database is segmented into two groups: (i) Patients with critical conditions and (ii) Patients without critical conditions.
TheSegmentAmnio contains 73 patients, who did the crucial examination
(i.e., Amniocentesis) and the rest of the patients (i.e., 832 patients) from a total of 905 are grouped into SegmentN on−Amnio. Hence, the medical
path-ways have been extracted form both segments and their results are compared to get insight knowledge about the impact of critical conditions on the entire pregnancy period. Moreover, the analysis of SegmentF ull−P eriod have also
been investigated to understand the complete prenatal care. In addition, the patients in SegmentF ull−P eriod are analyzed on the basis of trimester.
A trimester comprises of 3 months time duration of pregnancy period, thus in 9 months there would be 3 trimesters: 1st Trimester, 2nd Trimester and 3rd Trimester. The initial 3 months are covered in 1st trimester, next 3 months in 2nd trimester and rest of the days are included in 3rd trimester. In the subsequent sections, the analysis of the extracted medical pathways is described.
Frequent exam sets
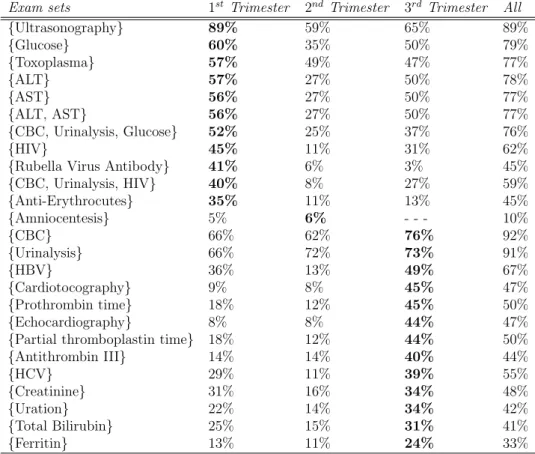
The frequent exam sets of SegmentF ull−P eriod trimester-wise are reported in
Table 2.10, it also includes results as a whole complete period. Majority of the results are consistent to the guidelines reported in Table 2.9. The most frequent exams in 1st trimester, including Glucose, ALT, AST, HIV, Toxoplasma, and Ultrasonography, are those which are recommended in first
Table 2.10: Exam sets in SegmentF ull−P eriod (pregnancy dataset)
Exam sets 1st Trimester 2nd Trimester 3rd Trimester All
{Ultrasonography} 89% 59% 65% 89% {Glucose} 60% 35% 50% 79% {Toxoplasma} 57% 49% 47% 77% {ALT} 57% 27% 50% 78% {AST} 56% 27% 50% 77% {ALT, AST} 56% 27% 50% 77% {CBC, Urinalysis, Glucose} 52% 25% 37% 76% {HIV} 45% 11% 31% 62%
{Rubella Virus Antibody} 41% 6% 3% 45%
{CBC, Urinalysis, HIV} 40% 8% 27% 59% {Anti-Erythrocutes} 35% 11% 13% 45% {Amniocentesis} 5% 6% - - - 10% {CBC} 66% 62% 76% 92% {Urinalysis} 66% 72% 73% 91% {HBV} 36% 13% 49% 67% {Cardiotocography} 9% 8% 45% 47% {Prothrombin time} 18% 12% 45% 50% {Echocardiography} 8% 8% 44% 47%
{Partial thromboplastin time} 18% 12% 44% 50%
{Antithrombin III} 14% 14% 40% 44% {HCV} 29% 11% 39% 55% {Creatinine} 31% 16% 34% 48% {Uration} 22% 14% 34% 42% {Total Bilirubin} 25% 15% 31% 41% {Ferritin} 13% 11% 24% 33%
weeks of the prenatal care. The exams Echocardiography, Uration, Uration, Total Biluribine, HBV, and HCV are the most frequent in 3rd trimester in accordance with medical guidelines. Th only Amniocentesis exam is found most frequent in 2nd trimester, this leads to the fact that Amniocentesis is usually performed in between 15th and 20th week of the pregnancy period. Thus, the most of the results are coherent with guidelines. The exam sets highlight the fact that these exams are performed together, for instance, ALT and AST.
There has also been some unexpected results inSegmentF ull−P eriod, since
some of the frequencies of the exams are lower than the expected ones, e.g., Rubella Virus Antibody, Cardiotocography, and Ultrasonography. The pos-sible reason behind such behaviour could be these exams quickly and com-fortably are performed privately. The patients may have preferred private examination of such exams to avoid long queues of the public health care centres. Another crucial exam Rubella Virus Antibody is found about 45%, that is the limited percentage of patients. The Rubella Virus Antibody exam
Table 2.11: Exam sets in SegmentAmnio and SegmentN on−Amnio (pregnancy
dataset)
Exam sets SegmentAmnio SegmentN on−Amnio Difference
{Ultrasonography} 100% 76% 24% {CBC} 88% 77% 21% {HBV} 68% 52% 16% {CBC, Urinalysis, HBV} 63% 49% 14% {HIV, Urinalysis, CBC} 56% 43% 13% {HIV} 56% 45% 11% {HBV, HCB} 53% 42% 11% {HCV} 53% 43% 10% {Urinalysis, Glucose, CBC} 68% 59% 9% {Glucose} 73% 64% 9% {Urinalysis} 85% 77% 8% {CBC, ALT, AST} 67% 60% 7% {ALT} 68% 61% 7% {AST} 67% 61% 6% {ALT, AST} 67% 61% 6% {Toxoplasma} 63% 61% 2%
is very critical because, in case of infection found in mother, the baby may congenital rubella syndrome. This implies to a serious incurable illness. The possible reason of is limited frequency could be people did Rubella earlier, since they are already known about the antibodies. Thus, such behaviour of low frequency has been analyzed. Moreover, some of the exams are hav-ing higher frequency than that of the expected ones, such behaviour reveals the aspect of medical guidelines being obsolete or at least incomplete with respect the actual medical knowledge. Prenatal care is complex process, which is contingent on health conditions of the woman, therefore, medical experts (i.e., doctors) prescribe treatment in accordance with patient’s actual conditions. The Creatinine (48%), Prothrombin Time (50%), Antithrombin III (44%) and Echocardiography (47%) are some examples of such exams, which are unavailable in guidelines, but appeared with higher frequency in the considered dataset. The guidelines prescribe Glucose level, ALT, AST once in the whole pregnancy period, but these exams are found with higher frequency in both the 1st and the 3rd trimesters.
The exam sets are generally more frequent inSegmentAmnio with respect
to SegmentN on−Amnio, e.g., atleast always 10% higher frequency is analyzed
inSegmentAmnioas compared toSegmentN on−Amniofor the exams HIV, HBV
and HCV. The frequent exam sets of both the segments are reported in Table 2.11. Although the exams ALT, AST and Toxoplasma are having almost sim-ilar frequencies in both the segments, yet SegmentAmnio has slightly higher
Table 2.12: Exam sequences of three trimesters in SegmentF ull−P eriod
(preg-nancy dataset)
Exam sequences Frequency (%)
{Ultrasonography}{Urinalysis} 73 {Ultrasonography}{CBC} 73 {Urinalysis}{Urinalysis} 64 {Ultrasonography}{Ultrasonography} 64 {CBC}{CBC} 60 {HIV}{Urinalysis} 38 {Glucose}{Glucose} 37 {Ultrasonography}{Urinalysis}{CBC} 44
{Ultrasonography}{Urinalysis}{Urinalysis} 43
{Ultrasonography}{Urinalysis}{Urinalysis, CBC} 40
{Ultrasonography}{Ultrasonography}{CBC} 38
{Ultrasonography}{Ultrasonography}{Urinalysis} 37
{Ultrasonography}{CBC}{CBC} 36
{Ultrasonography}{Urinalysis}{Ultrasonography} 36
{Ultrasonography}{Ultrasonography}{Ultrasonography} 35
{Ultrasonography}{Toxoplasma}{Urinalysis} 31
{Urinalysis}{Urinalysis}{Urinalysis} 27
{Ultrasonography}{Urinalysis}{Echocardiography} 26
{CBC}{CBC}{CBC} 24
{Ultrasonography}{Urinalysis}{Cardiotocography} 23
{Ulrasonography, HIV}{Urinalysis}{CBC} 21
{Toxoplasma, AST, ALT}{Urin

![Figure 2.4: Medical pathways extraction process (colon-cancer dataset) Guidelines generally do not suggest CAT of Abdomen as alternative method, instead these suggest the more invasive Colonoscopy [167]](https://thumb-us.123doks.com/thumbv2/123dok_us/354456.2539007/29.892.204.693.537.805/medical-pathways-extraction-guidelines-generally-abdomen-alternative-colonoscopy.webp)