Myopathy Detection and Classification Based on
the Continuous Wavelet Transform
Abdelali Belkhou, Abdelouahad Achmamad and Atman Jbari
Abstract—Electromyography (EMG) technique is often used for diagnosis of neuromuscular diseases such as myopathy that affects the muscle and causes many changes in the electromyogra-phy signal characteristics. This paper presents a new method for analysis and classification of normal and myopathy EMG signals based on the continuous wavelet transform (CWT). Classification algorithms, namely Support Vector Machine (SVM), k-Nearest Neighbor (k-NN), Decision Tree (DT), Discriminant Analysis (DA) and Native Bayes (NB) were used in our study. Five features were extracted from the CWT and employed them as input features to the classifiers. Results were evaluated and subsequently, a comparison was made in terms of performance markers, namely, accuracy, sensitivity, and specificity to ensure the efficacy of individual classifiers as well as the number and the combination of the feature sets. Results showed that k-NN classifier with an association of four features delivered the best performances with an accuracy of 93.68%.
Index Terms—Electromyography (EMG), continuous wavelet transform (CWT), support vector machine (SVM), k-nearest neighbor (k-NN), decision tree (DT), discriminant analysis (DA), native bayes (NB).
I. INTRODUCTION
I
N the biomedical area, Electromyography (EMG) refers to the study of the electrical activity of the muscle [1]. From a technical side, EMG is a biological signal acquired from mus-cles with the aim of evaluating their activities [2]. Typically EMG is recorded by invasive and non-invasive techniques. The former employs needle electrodes and the latter employs surface electrodes to acquire signals known as intramuscular EMG and surface EMG [3]. In addition to the muscle fatigue evaluation, sports science, rehabilitation and the development of the prosthetic device purposes [4] [5], the primary use of the EMG signal is the diagnosis of the neuromuscular diseases [6] [7] [8]. As already mentioned and studied in different researches [8] [9], the most famous neuromuscular diseases of muscles are myopathy and neuropathy. In neurogenic cases, nerves of the neuromuscular system are damaged, whereas, in myopathy disease, the affected organ is the muscle itself [10]. In the literature, the diagnosis of neuromuscular diseases or more particularly, classification of EMG data into normal, myopathy, and neuropathy EMG signals, was a topic ofManuscript received May 30, 2019; revised October 28, 2019. Date of publication November 25, 2019. Date of current version November 25, 2019. The associate editor prof. Mladen Russo has been coordinating the review of this manuscript and approved it for publication.
Authors are with the Electronic Systems, Sensors and Nano-biotechnologies Research Team, ENSET, Mohammed V University in Rabat, Morocco (e-mails: [email protected], [email protected], [email protected]).
Digital Object Identifier (DOI): 10.24138/jcomss.v15i4.7
multiple research. In [11], an accuracy of 90.7% was achieved using wavelet neural networks (WNN) based classifier with an autoregressive (AR) model of EMG signals. In [12], neuro-fuzzy computing techniques with autoregressive (AR), dis-crete wavelet transform (DWT) and wavelet packet transform (WPT) as feature extraction methods were studied. Classifi-cation accuracy of 95% was achieved. Other essential works which studied the classification of normal, myopathy, and neuropathy EMG signals can be found in [10] [13] [14]. The research and the classification into myopathic, amyotrophic lateral sclerosis (ALS) or normal EMG signals have also taken considerable importance in the last years. The authors in [15] proposed a learning scheme based on a feature fusion using multi-domain discriminant correlation analysis (MDCA) for a diagnosis of electroencephalogram (EEG) and EMG patterns. The algorithm was the object of a real-time implementation on a microcontroller device. Regarding the EMG signal diagnosis, the proposed work achieved an optimal accuracy of 98% using DA. In [16], a multiview feature fusion system is proposed. The set of features are generated in both the time and the wavelet domains. Thereafter, the discriminant correlation anal-ysis (DCA) was performed. The proposed algorithm was tested with two EMG data sets. The authors obtained 100% in terms of accuracy, specificity and sensitivity in one of the two data sets. Other relevant multi-class studies related to myopathic, ALS and normal EMG signals can be found in [7] [17] [18] [19] [20].
Our study deals with a binary classification issue to dis-tinguish myopathic patients from normal subjects using the CWT. Different approaches have been proposed to deal with this issue. In a recent paper [21], an autoregressive moving average (ARMA) model followed by linear discriminant anal-ysis (LDA) algorithm was used to identify myopathic patients from normal subjects. An accuracy of 90.25% was obtained. An empirical mode decomposition (EMD) based technique for the discrimination between myopathic and normal EMG signals was proposed in [22]. In [14], the authors employed different feature techniques for the classification of EMG signals into healthy subjects or myopathic patients. The autore-gressive (AR) technique along with the multilayer perceptron (MLP) classification algorithm achieved higher results with an accuracy of 83%. The authors in [23] achieved 86.1% accuracy, 88.9% sensitivity and 83.3% specificity using the au-tocorrelation function and k-NN classifier. In another reported work [24], authors combined features extracted from tunable-Q wavelet transform (Ttunable-QWT) and from the time domain to classify EMG signals into normal subjects or myopathic patients. The obtained accuracy was 82.41% using random 1845-6421/12/796 © 2019 CCIS
forest classifier.
In our previous work [25], four features were extracted from the CWT and were all fed to SVM and k-NN classifiers to detect myopathic cases from normal subjects. 10-fold cross-validation was used as an evaluation technique. An accuracy of 91.11 ± 0.38 (mean ± standard deviation) was obtained using k-NN. This work is an experimental study in which the CWT is applied along with five classification algorithms and five extracted features (latterly detailed). The main idea behind this study is the evaluation of the effect of the number and the combination of the used features on the classification accuracy. Thus, all the possible combinations of the previous features were examined to determine the most suitable parameters for our research. Besides, this work is interested in finding the association of the mother wavelet in a pretreatment step, the features, the classifier and the kernel function that ensure higher accuracy. The algorithm is tested on data which is divided into 2 separate subsets: a training set and a test set. As opposed to the 10-fold cross-validation method employed in the previous study, the included training subset signals in this work are in no way reused in the test process.
As a mathematical tool for feature extraction, the CWT is a non-stationary signal processing technique widely used in the biomedical field. Several publications proved the usefulness of CWT in EMG signal processing [10] [26] [27]. The aim of this study is to develop a new and reliable EMG classification method. In our proposed work, the CWT is applied to raw EMG data to extract useful features for classification purpose. In the classification process, feature extraction is a crucial stage, in which single scalar parameters represent the whole signal. These parameters must be meaningful as much as possible. In other words, the chosen features must have the capability to discriminate between different signals (myopathic and normal in our case). Thus, to prove the efficiency of the proposed parameters, and to get higher classification performances, our algorithm was run as much as the possible combinations of these features using five classification algo-rithms with different kernel functions.
The remainder of the paper is organized as follows: Section II introduces the theory of wavelet analysis and feature ex-traction. Section III shows the methodology used in this study. Section IV presents the experimental results of the proposed methodology with discussion and presents a comparative study with other reported works from the literature. Finally, we conclude with Section V.
II. THETHEORY OFWAVELETANALYSIS ANDFEATURE
EXTRACTION
A. Continuous Wavelet Transform
The CWT provides both time and frequency localization of a signal, which makes it an appropriate technique for analysing non-stationary signals such as EMG which is the subject of this study. The CWT is based on the notion of scale which is an alternative to the concept of frequency in the Fourier transform. The result of the CWT is shifted and scaled versions of the original wavelet, whereas in Fourier transform, the
original signal is decomposed into sine waves of multiples frequencies [28].
The CWT, which reflects the correlation between a signal x(t) and a function known as the mother wavelet is defined by the following equations:
Cx(τ, σ) = Z +∞ −∞ x(t)ψτ,σ∗ (t)dt (1) where ψτ,σ(t) = 1 √ σψ t−τ σ (2)
ψ(t)∗ denotes the complex conjugate of the mother wavelet functionψ(t),σis the scale,τ refers to the translation of the wavelet and √1
σ is used for energy normalization [2]. Generally, the choice of appropriate scales and an adequate analysing wavelet function depends on the application.
B. Average Absolute Coefficient per Scale
After we applied CWT to our EMG data, the result C is an N×M coefficients matrix for each signal.N reflects the number of scales whereas M indicates samples of the signal. Since this representation could be difficult to interpret, we proposed in a first stage to reduce the size of the matrix to a single vector by calculating the mean absolute coefficient per scale, by the mean of the following equation:
sc= M X j=1 |Cij| M i= 1, ..., N (3)
where sc is a vector which contains the average absolute coefficient per scale for one subject. The second stage of the proposed system corresponds to feature extraction and will be explained next.
C. Feature Extraction using CWT
Based on first observations (Fig. 2 and Fig. 3), good discrimination between normal and myopathy EMG signals could be done using the proposed algorithm presented in Fig.1. The use of classifiers requires the extraction of the most relevant parameters in the signal. In most machine learning applications, signals are represented by their statistical infor-mation. Thus, five statistical features are extracted in our study by means of mathematical tools. The proposed features are :
– The mean scale
meanscale= Rscalemax 0 σ|cx(σ)| dσ Rscalemax 0 |cx(σ)| dσ (4) – The median scale
Z medscale 0 |cx(σ)| dσ= 1 2 Z maxscale 0 |cx(σ)| dσ (5) – The mean coefficient
meancwt= N X i=1 sc(i) N (6)
mincwt=min(sc) (7) – The maximum coefficient
maxcwt=max(sc) (8)
III. METHODOLOGY
A. EMG Dataset
As presented in [29], the data contains two classes: a class of normal subjects and a class of myopathic patients. The myopathic group is composed of 7 patients aged 19-63 years; 5 males and 2 females. The myopathic patients had all, electrophysiological and clinical signs of myopathy. The group of the normal class contains 10 subjects, 6 males and 4 females aged 21-37 years. The normal group had no signs of neuromuscular disorders. The brachial biceps muscle was employed in this work because it is one of the most investigated muscles in the EMG analysis.
The EMG signals were recorded under usual conditions for Motor Unit Action Potential (MUAP) analysis. The recordings were made at a low voluntary and constant level of contraction. A standard concentric needle electrode was used. The signals were recorded from five places in the muscle at three levels of insertion (deep, medium, low). The signals were recorded at a sampling frequency of 23437 Hz. The high and low pass filters of the EMG amplifier were set at 2 Hz and 10 kHz [29].
B. Classification Process
The EMG data used in this study is divided into a training data set and test data set. The training data represents 75% of the total data set and it is used to build the classification model. The test data which represents 25% of the total data is used for validation purpose. The distribution of records in the two data sets for each class is shown in Table I.
TABLE I
DISTRIBUTION OFRECORDS IN THETWODATASETS Class Training set Test set Total
Normal 201 68 269
Myopathy 80 27 107
After extracting the previously mentioned features, the next step is the classification of all signals into two groups: normal subjects and myopathic patients. In our study, five supervised learning classifiers are applied. Table II summarizes the differ-ent classifiers and kernels used. Regarding the k-NN classifier, it is evaluated via different k parameter values.
Next, classification results are examined. Measurements such as accuracy, sensitivity, and specificity are used and defined as follows [11]:
– Specificity (Spec): refers to the number of correctly classified normal subjects divided by the total number of normal subjects.
– Sensitivity (Sens): refers to the number of correctly classified myopathic subjects divided by the total number of myopathic subjects
– Accuracy (Acc): refers to the number of correctly clas-sified subjects divided by the total number of subjects.
These measurements are calculated by the following equations [30]: Sensitivity= Tp Tp+FN ×100 (9) Specif icity= TN TN+FP ×100 (10) Accuracy= TN+TP TN +TP +FN +FP ×100 (11) whereTP is the number of true positives, TN true negatives,
FP false positives andFN false negatives [31].
Raw EMG data • 201 signal from normal subjects • 80 from myopathic subjects
CWT analysis • Using sym6wavelet • A scale interval from 2 to 100
Average absolute (CWT) • Calculation of the average
absolute coefficient per scale
Feature extraction • The mean and the median scales • The minimum, the mean and the
maximum coefficients
Classification • To normal or myopathic patients • Using SVM, k-NN, DA, NB and
DT
Fig. 1. Block diagram of the proposed work.
IV. EXPERIMENTALRESULTS ANDDISCUSSION
This paper presents a new technique for EMG signal analy-sis and classification (Fig. 1). The study concerns two groups: normal subjects and myopathic patients. An example of a typical EMG signal for each group is given in Fig. 2.
In our study, the CWT is used to analyse EMG signals. In order to determine the suitable CWT parameters (the mother wavelet and the scales), a pretreatment process is done. Wavelet functions such as “db4”, “sym6” and “haar” wavelets were tested. Best performances and low computation time were obtained via “sym6”. Following this result, the whole study is completed using “sym6” wavelet function.
TABLE II
CLASSIFIERS ANDKERNELSUSED IN THISSTUDY
Classifier SVM DA DT NB k-NN
Kernel/ K value
Linear(Lin) Linear(Lin) Exact(Ex) Normal(Nor) 3
Polynomial(Pol) PseudoQuadratic(PsQ) PullLeft(Pul) Triangle(Tri) 5
RBF DiagLinear(DiagL) PCA Epanechnikov(Ep) 7
- PseudoLinear(PsL) - Box 9
Fig. 2. Typical normal and myopathic EMG signals.
Table III summarizes the empirically obtained CWT param-eters.
TABLE III
CWT PARAMETERSUSED IN THISSTUDY
Mother wavelet Scale interval Corresponding frequency interval (Hz)
Sym6 2 - 100 170 - 8523
After CWT is applied to raw EMG data, and to correctly identify myopathic patients from normal subjects, we followed a procedure based on the calculation of the mean absolute CWT coefficient per scale (Fig. 3). Meaningful features were then proposed to be extracted for classification purpose.
Fig. 3. The average coefficient evolution per scale for four significant subjects: two normal and two myopathic.
A meaningful difference between normal and myopathic subjects based on time scale analysis of the EMG signal is shown in Fig. 3. The evolution of the mean coefficient per scale of normal subjects is more significant than myopathic ones. The box-and-whisker plot of this result is illustrated in Fig. 4. As shown in Fig. 3 and Fig. 4, this technique has efficiency in the discrimination between myopathy patients and normal subjects. In order to classify all signals, five features are extracted: the mean and the median scales, the minimum, the mean and the maximum coefficients.
Fig. 4. The box-and-whisker plot of the average coefficient evolution per scale for four significant subjects: two normal and two myopathic.
A correct diagnosis of myopathic cases requires a higher classification accuracy. Thus, our algorithm was run several times to find combinations of features and kernels that ensure the best results.
Table IV shows the best results obtained with the cor-responding kernel functions using all the five parameters previously presented.
TABLE IV
CLASSIFICATIONRESULTUSING ALLFEATURES Classifier Acc (%) Sens (%) Spec (%) Kernel / K value
SVM 91.58 81.48 95.59 RBF
DA 90.53 85.18 92.65 Lin
NB 89.47 88.89 89.71 Ep - Tri
k-NN 90.53 88.89 91.18 9
DT 82.10 92.59 77.94 all kernels
These results show that SVM classifier achieved the best performance with an accuracy of 91.58%, a sensitivity of 81.48% and a specificity of 95.59% using RBF kernel.
Regarding the other classifiers performances, accuracies of 90.53%, 89.47%, and 82.10% are obtained using k-NN and DA classifiers, NB, and DT, respectively.
To get higher accuracies, we propose to run our algorithm as much as the possible combinations of features. Table V summarizes the results of the best performances combination of only four features. The best combination found is compound from the following features: The mean and the median scales, the mean and the minimum coefficients.
Using only four features, the k-NN classifier with k=7 demonstrated the highest performance with an accuracy of 93.68%, a sensitivity of 88.89% and a specificity of 95.59%. SVM classifier with the RBF kernel performed the second-highest classification accuracy of 92.63%. On the one side, DA and NB classifiers kept almost the same performances as previously when all five features were used. On the other side, DT classifier achieved an accuracy of 83.16% using all kernels. As compared to the case with five features, results become higher using only four.
TABLE V
CLASSIFICATIONRESULTUSINGBESTFOURCOMBINEDFEATURES Classifier Acc (%) Sens (%) Spec (%) Kernel / K value
SVM 92.63 85.18 95.59 RBF
DA 90.53 88.89 91.18 PsQ
NB 89.47 85.18 91.18 Nor - Tri
k-NN 93.68 88.89 95.59 7
DT 83.16 88.89 80.88 all kernels
Table VI presents the results of the best three combined features, which are: the mean scale, the minimum, and the maximum coefficients.
TABLE VI
CLASSIFICATIONRESULTUSINGBESTTHREECOMBINEDFEATURES Classifier Acc (%) Sens (%) Spec (%) Kernel / K value
SVM 90.53 81.48 94.12 RBF
DA 89.47 88.89 89.71 Lin
NB 88.42 88.89 88.23 Box
k-NN 91.58 85.18 94.12 5-7
DT 81.05 85.18 79.41 all kernels
As it is clear in the table above, stability in the overall performances is noticed. All classifiers except DT have an accuracy higher than 88%, while DT achieved only 81%. In general, the specificity values are higher than sensitivity values for all classifiers except for DT classifier.
Table VII illustrates a comparison between the performances of the five classifiers using only two features. The best two combined features are the mean scale and the minimum coefficient.
We can notice from the results of Table VII that the overall performances decreased for the majority of classifiers except for SVM and NB classifiers. An accuracy of 90.53% is achieved with the Linear kernel function of the SVM. The obtained sensitivity and specificities are 88.89% and 91.18% respectively. A significant decrease is to be noticed in DT
TABLE VII
CLASSIFICATIONRESULTUSINGBESTTWOCOMBINEDFEATURES Classifier Acc (%) Sens (%) Spec (%) Kernel / K value
SVM 90.53 88.89 91.18 Lin
DA 89.47 81.48 92.65 DiagL
NB 89.47 77.78 94.12 Box
k-NN 89.47 85.18 91.18 7
DT 76.84 70.37 79.41 all kernels
results. The DT accuracy is only 76.84%, while the sensitivity and the specificities are 70.37% and 79.41% respectively. Table VIII shows the obtained results with the corresponding kernel function using only one parameter. Best results were obtained using the mean scale feature.
TABLE VIII
CLASSIFICATIONRESULTUSINGONLYONEFEATURE Classifier Acc (%) Sens (%) Spec (%) Kernel / K value
SVM 84.21 70.37 89.71 Lin-RBF
DA 85.26 74.07 89.71 all kernels
NB 84.21 70.37 89.71 all kernels
k-NN 81.05 74.07 83.82 7
DT 73.68 59.26 79.41 all kernels
Using only the mean scale as a feature, the best-obtained accuracy is 85.26% and was obtained via all kernels of DA classifier. DT had the lowest result with an accuracy of 73.68%. The following figure presents the evolution of the accuracy of all classifier along with the number of the used features.
From the obtained results, and as the Fig. 5 shows, it is noticed that generally, the accuracy significantly increases with an increase in the number of features used to train the classifiers. The highest results of all classifiers were obtained using a combination of the following four features: the mean and the median scales, the mean and the minimum coefficients. The best-obtained accuracy was 93.68% and was achieved using k- NN classifier with k=7. SVM achieved an accuracy of 92.63% using the Polynomial kernel. These results show the effectiveness of these two classifiers compared to others (DT in particular), the thing that goes with the previous results from the literature [7] [25] [31].
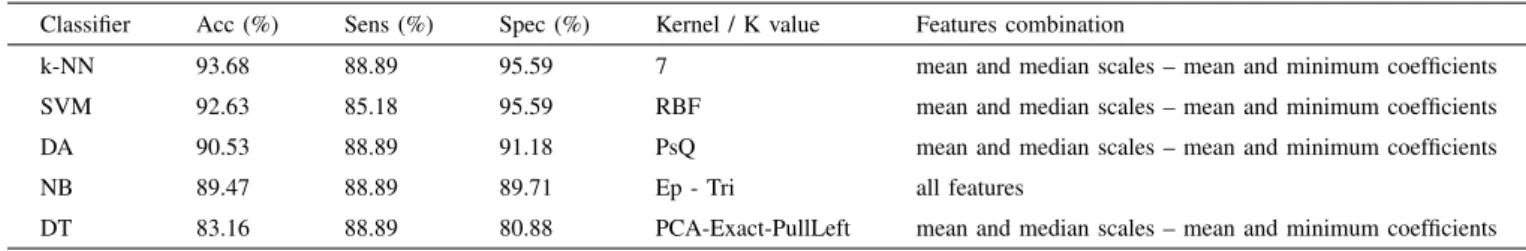
The summary of all best results for each classifier with the specific kernel and the best features combination employed is presented in Table IX.
The findings are of a higher accuracy when compared with other studies which investigated the normal and the myopathic EMG classes (Table X).
V. CONCLUSION
In this work, a new approach based on CWT to analyse and classify EMG data into two groups: normal and myopathy, is proposed. The CWT was performed, and then five features that we applied at a later stage as inputs to classifiers were extracted. The suggested parameters in this study are the
TABLE IX
SUMMARY OF THEBESTCLASSIFICATIONRESULTS OF ALLCLASSIFIERS WITH THEFEATURESCOMBINATIONUSED Classifier Acc (%) Sens (%) Spec (%) Kernel / K value Features combination
k-NN 93.68 88.89 95.59 7 mean and median scales – mean and minimum coefficients SVM 92.63 85.18 95.59 RBF mean and median scales – mean and minimum coefficients DA 90.53 88.89 91.18 PsQ mean and median scales – mean and minimum coefficients
NB 89.47 88.89 89.71 Ep - Tri all features
DT 83.16 88.89 80.88 PCA-Exact-PullLeft mean and median scales – mean and minimum coefficients
TABLE X
COMPARISON OF THEPROPOSEDWORK WITHOTHERREPORTEDWORKSWHICHSTUDIEDTWO-CLASSCLASSIFICATION: MYOPATHIC ANDNORMALCLASSES
Work Methods and classification algorithms used Acc (%) Sens (%) Spec (%)
Fattah et al. [23] Auto-correlation – k-NN 86.1 88.9 83.3
Elamvazuthal et al. [14] Auto-regressive – MULTI-LAYER PERCEPTRON 83 -
-Joshi et al. [24] Tunable-Q wavelet – RANDOM FOREST 81.14 -
-Lahmiri and Boukadoum [21] Full ARMA – LDA 90.25 83.67 92.65
Proposed work CWT – k-NN 93.68 88.89 95.59
Fig. 5. Evolution of the accuracy of all classifier following the number of the used features.
mean and the median scales, the mean, the minimum and the maximum coefficients. Five classification algorithms were also used: Support Vector Machine (SVM), Discriminant Analysis (DA), Native Bayes (NB), k-Nearest Neighbour (k-NN) and Decision Tree (DT). For each classification algorithm, multiple kernel functions were explored. The core focus of this research is to investigate the highest classification performances by evaluating the impact of the number and the association of the proposed features on the classification results. From the research that has been carried out, it can be concluded that our proposed technique using the CWT is an efficient tool for the diagnosis of myopathy disease. This binary classification al-gorithm delivered consistent results in discrimination between myopathic patients and normal subjects using intramuscular EMG signals. The findings of our research are quite convinc-ing, and thus, this technique can be generalised in the future as a multi-class classification method. The proposed work can be applied and also tested for other biomedical signals.
REFERENCES
[1] D. Yang, H. Zhang, Y. Gu, and H. Liu, “Accurate EMG onset detection in pathological , weak and noisy myoelectric signals,” Biomed. Signal Process. Control, vol. 33, pp. 306–315, 2017. DOI: 10.1016/j.bspc.2016.12.014.
[2] A. Belkhou, A. Jbari, and L. Belarbi, “A continuous wavelet based technique for the analysis of electromyography signals,”International Conference on Electrical and Information Technologies (ICEIT), Rabat, pp. 1-5, 2017. DOI: 10.1109/EITech.2017.8255232.
[3] M. Cifrek, V. Medved, S. Tonkovi´c, and S. Ostoji´c, “Surface EMG based muscle fatigue evaluation in biomechanics,”Clin. Biomech., vol. 24, no. 4, pp. 327–340, 2009. DOI : 10.1016/j.clinbiomech.2009.01.010. [4] V. K. Mishra, V. Bajaj, A. Kumar, and G. K. Singh, “Analysis of ALS
and normal EMG signals based on empirical mode decomposition,”IET Sci. Meas. Technol., vol. 10, no. 8, pp. 963–971, 2016. DOI: 10.1049/iet-smt.2016.0208.
[5] G. R. Naik, D. K. Kumar and M. Palaniswami, “Classification of low level surface electromyogram using independent component analysis,” in IET Signal Processing, vol. 4, no. 5, pp. 479-487, Oct. 2010. DOI: 10.1049/iet-spr.2007.0211.
[6] V. K. Mishra, V. Bajaj, A. Kumar, D. Sharma, and G. K. Singh, “An efficient method for analysis of EMG signals using improved empirical mode decomposition,”AEU - Int. J. Electron. Commun., vol. 72, pp. 200–209, 2017. DOI: 10.1016/j.aeue.2016.12.008.
[7] E. Gokgoz and A. Subasi, “Effect of multiscale PCA de-noising on EMG signal classification for diagnosis of neuromuscular disorders,”J. Med. Syst., vol. 38, no. 4, 2014. DOI: 10.1007/s10916-014-0031-3. [8] A. Goen, “Classification of EMG Signals for Assessment of
Neuromus-cular Disorders,”Int. J. Electron. Electr. Eng., vol. 2, no. 3, pp. 242–248, 2014. DOI: 10.12720/ijeee.2.3.242-248.
[9] C. D. Katsis, Y. Goletsis, A. Likas, D. I. Fotiadis, and I. Sarmas, “A novel method for automated EMG decomposition and MUAP classi-fication,” Artif. Intell. Med., vol. 37, no. 1, pp. 55–64, 2006. DOI: 10.1016/j.artmed.2005.09.002.
[10] R. Isteniˇc, P. A. Kaplanis, , C. S. Pattichis, et al., “Multiscale entropy-based approach to automated surface EMG classification of neuromus-cular disorders,”Med. Biol. Eng. Comput, vol. 48, no. 8, pp. 773–781, 2010. DOI: 10.1007/s11517-010-0629-7.
[11] A. Subasi, M. Yilmaz, and H. R. Ozcalik, “Classification of EMG signals using wavelet neural network,”J. Neurosci. Methods, vol. 156, no. 1–2, pp. 360–367, 2006. DOI: 10.1016/j.jneumeth.2006.03.004.
[12] A. Subasi, “Classification of EMG signals using combined features and soft computing techniques,”Appl. Soft Comput. J., vol. 12, no. 8, pp. 2188–2198, 2012. DOI:10.1016/j.asoc.2012.03.035.
[13] C. D. Katsis, T. P. Exarchos, C. Papaloukas, Y. Goletsis, D. I. Fotiadis, and I. Sarmas, “A two-stage method for MUAP classification based on EMG decomposition,” Comput. Biol. Med., vol. 37, no. 9, pp. 1232–1240, 2007. DOI: 10.1016/j.compbiomed.2006.11.010.
[14] I. Elamvazuthi, N. H. X. Duy, Z. Ali, S. W. Su, M. K. A. A. Khan, and S. Parasuraman, “Electromyography (EMG) based Classi-fication of Neuromuscular Disorders using Multi-Layer Perceptron,” Procedia Comput. Sci., vol. 76, no. Iris, pp. 223–228, 2015. DOI: 10.1016/j.procs.2015.12.346.
[15] A. Hazarika, L. Dutta, P. Barman, A. Subasi, M. Bhuyan and C. Talukdar, “Real-time Implementation of a Multi-domain Feature Fusion Model Using Inherently Available Large Sensor Data,” inIEEE Trans-actions on Industrial Informatics. DOI: 10.1109/TII.2019.2914975. [16] A. Hazarika, L. Dutta, M. Barthakur, and M. Bhuyan, “A
Mul-tiview Discriminant Feature Fusion-Based Nonlinear Process As-sessment and Diagnosis: Application to Medical Diagnosis,” IEEE Trans. Instrum. Meas., vol. 68, no. 7, pp. 2498–2506, 2019. DOI: 10.1109/TIM.2018.2866744.
[17] E. Gokgoz and A. Subasi, “Comparison of decision tree algorithms for EMG signal classification using DWT,”Biomed. Signal Process. Control, vol. 18, pp. 138–144, 2015. DOI: 10.1016/j.bspc.2014.12.005. [18] V. K. Mishra, V. Bajaj, and A. Kumar, “Classification of normal, ALS,
and myopathy EMG signals using ELM classifier,” Proceeding IEEE - 2nd Int. Conf. Adv. Electr. Electron. Information, Commun. Bio-Informatics, IEEE - AEEICB, pp. 455–459, 2016. DOI: 10.1109/AEE-ICB.2016.7538330.
[19] A. Hazarika, L. Dutta, M. Barthakur, and M. Bhuyan, “Fusion of projected feature for classification of EMG patterns,” Int. Conf. Ac-cess. to Digit. World, ICADW 2016 - Proc., pp. 69–74, 2017. DOI: 10.1109/ICADW.2016.7942515.
[20] A. Hazarika, L. Dutta, M. Boro, M. Barthakur, and M. Bhuyan, “An automatic feature extraction and fusion model: application to elec-tromyogram (EMG) signal classification,” Int. J. Multimed. Inf. Retr., vol. 7, no. 3, pp. 173–186, 2018. DOI: 10.1007/s13735-018-0149-z. [21] S. Lahmiri, M. Boukadoum, “Improved Electromyography Signal
Mod-eling for Myopathy Detection,” IEEE International Symposium on Circuits and Systems (ISCAS), Florence, pp. 1-4, 2018. DOI: 10.1109/IS-CAS.2018.8350893.
[22] V. K. Mishra, V. Bajaj, A. Kumar, and D. Sharma, “Discrimination between Myopathy and normal EMG signals using intrinsic mode functions,”Int. Conf. Commun. Signal Process. ICCSP, pp. 299–303, 2016. DOI: 10.1109/ICCSP.2016.7754143.
[23] S. A. Fattah, A. B. M. S. U. Doulah, and M. Ahmed, “Evaluation of Different Time and Frequency Domain Features of Motor Neuron and Musculoskeletal Diseases,”International Journal of Computer Applica-tions, vol. 43, no. 23, pp. 34–40, 2012. DOI: 10.5120/6422-8922. [24] D. Joshi, A. Tripathi, R. Sharma and R. B. Pachori, “Computer
aided detection of abnormal EMG signals based on tunable-Q wavelet transform,” 2017 4th International Conference on Signal Processing and Integrated Networks (SPIN), Noida, pp. 544-549, 2017. DOI: 10.1109/SPIN.2017.8050010.
[25] A. Belkhou, A. Achmamad, A. Jbari, “Classification and Diagnosis of Myopathy EMG Signals Using the Continuous Wavelet Transform,” 2019 Scientific Meeting on Electrical-Electronics and Biomedical Engi-neering and Computer Science (EBBT), Istanbul, Turkey, pp. 1-4, 2019. DOI: 10.1109/EBBT.2019.8742051.
[26] M. Yochum, T. Bakir, S. Binczak, R. Lepers, “EMG artifacts removal during electrical stimulation, a CWT based technique,” 2014 IEEE REGION 10 SYMPOSIUM, Kuala Lumpur, pp. 137-140, 2014. DOI: 10.1109/TENCONSpring.2014.6863012.
[27] R. N. Leao and J. A. Burne, “Continuous wavelet transform in the evaluation of stretch reflex responses from surface EMG,” J Neurosci Methods, vol. 133, no. 1-2, pp. 115–125, 2004. DOI: 10.1016/j.jneumeth.2003.10.003.
[28] H. Khorrami and M. Moavenian, “A comparative study of DWT, CWT and DCT transformations in ECG arrhythmias classification,” Expert Syst. Appl., vol. 37, no. 8, pp. 5751–5757, 2010. DOI: 10.1016/j.eswa.2010.02.033.
[29] M. Nikolic, “Detailed Analysis of Clinical Electromyography Signals EMG Decomposition, Findings and Firing Pattern Analysis in Controls and Patients with Myopathy and Amytrophic Lateral Sclerosis,” PhD Thesis, Faculty of Health Science, University of Copenhagen, 2001. [30] R. R. Sharma and R. B. Pachori, “Time–frequency representation
using IEVDHM–HT with application to classification of epileptic EEG signals,”IET Sci. Meas. Technol., vol. 12, no. 1, pp. 72–82, 2018. DOI: 10.1049/iet-smt.2017.0058.
[31] A. Benba, A. Jilbab, and A. Hammouch, “Discriminating Between Patients With Parkinson’s and Neurological Diseases Using Cepstral Analysis,”IEEE Trans. Neural Syst. Rehabil. Eng., vol. 24, no. 10, pp. 1100–1108, 2016. DOI: 10.1109/TNSRE.2016.2533582.
A. Belkhoureceived his engineer degree in Electri-cal Engineering in 2016 at Cadi Ayyad University in Marrakech. He is currently a PhD student with the Research Team of Electronic Systems, Sensors and Nano-biotechnologies (E2SN) at ENSET, Mo-hammed V University in Rabat, Morocco. His cur-rent research interests include electronics and signal processing.
A. Achmamadwas born in Rif area of Morocco, at 27th January 1992. He received his master degree in Electrical Engineering in 2017 from High School of Technical Education, Rabat. Currently PhD student with the Research Team of Electronic Systems, Sensors and Nano-biotechnologies (E2SN) at EN-SET, Mohammed V University in Rabat, Morocco. He is interested in the biomedical field, especially biological signal processing.
A. Jbari is currently a Professor at the Elec-trical Engineering Department of ENSET “Ecole Normale Sup´erieure de l’Enseignement Technique”, Mohammed V University in Rabat, Morocco. In 2009, he received his PhD degree in Computer and Telecommunications from Mohammed V-Agdal University. His current research interests include signal processing, blind source separation and em-bedded electronic systems. He is a member of Elec-tronic Systems, Sensors and Nano-biotechnologies research group.