AUT J. Elec. Eng., 49(2)(2017)215-222 DOI: 10.22060/eej.2017.12577.5096
K-Complex Detection Based on Synchrosqueezing Transform
Z. Ghanbari1 and M. H. Moradi1*1 Faculty of Biomedical Engineering, Amirkabir University of Technology, Tehran, Iran
ABSTRACT: K-complex is an underlying pattern in the sleep EEG. Due to the role of sleep studies in neurophysiologic and cognitive disorders diagnosis, reliable methods for analysis and detection of this pattern are of great importance. In our previous work, Synchrosqueezing Transform (SST) was proposed for analysis of this pattern. SST is an EMD-like tool, which benefits from wavelet transform and reallocation approaches. This method is able to decompose signals into their time-varying oscillatory ingredients. In addition, it provides a time-frequency representation with less blurring compared to wavelet transform. In this paper, firstly, the ability of SST is investigated by applying the ANOVA test, which is approved by proper p-values. This paper proposes SST for K-complex detection. The proposed method is based on a so-called “detection of K-complexes and sleep spindles” (DETOKS) framework. DETOKS is based on spares optimization and decomposes signals into four components, namely transient, low frequency, oscillatory, and a residual. Applying the Teager-Kaiser energy operator and setting a threshold on the low-frequency component result in K-complex detection. We modify DETOKS using SST. The proposed method is applied to DREAMS dataset. The dataset provides two visual scorings accompanied by an automatic one. As the visual labels were extremely different, the automatic detection is considered as the third expert’s scoring and data is re-labeled by a voting approach among three experts. For DETOKS, DETOKS modified by CWT, and the proposed method, MCC measure is 0.62, 0.71, and 0.76, respectively. It shows superiority of the proposed method.
Review History:
Received: 26 February 2017 Revised: 27 August 2017 Accepted: 27 August 2017 Available Online: 15 October 2017
Keywords:
K-complex Sleep EEG
Synchrosqueezing Transform (SST) Sparse Optimization
Teager-Kaiser Energy Operator
1- Introduction
K-complexes that were introduced more than 70 years ago are one of the most important micro-events in the sleep EEG. They have a crucial role in the sleep stage scoring besides their important role in studying the functional role of sleep and sleep disorder diagnosis. K-complex is the largest grapho-element of the EEG signal. K-complex and sleep spindles characterize the second stage of the non-rapid eye movement (NREM) sleep. According to the American Academy of Sleep Medicine (AASM), K-complex is a “well-delineated negative sharp wave immediately followed by a positive component standing out from the background EEG, with total duration≥0.5 s, usually maximal in amplitude over the frontal regions”. Duration of K-complex is between 0.5s to 1.5 s in the most of existing references. However, the maximum duration of 1-3 s is imposed for this pattern [1]. Since studying K-complexes is very important in children and adults sleep studies as well as neurophysiologic and cognitive disorders diagnosis, reliable methods for analysis and detection of this pattern is of great importance, from both research and clinical aspects [2-4].
Visual annotation of K-complex is time-consuming, due to the fact that there are typically 1-3 K-complexes in stage 2 of young adults [1]. Moreover, it is highly prone to error. The great number of experts’ disagreement annotations confirm this [2, 5]. K-complexes may vary in morphologic appearance and be affected by artifacts. Some artifacts may
be recognized as K-complexes [6, 7].
Based on the aforementioned points, many approaches are proposed for the automatic detection and analysis of the K-complex pattern. These methods include analysis of period-amplitude, spectral analysis methods, e. g. Fourier transform, wavelet transform, matching pursuit, autoregressive modeling, and state-space modeling [8]. The authors of [9] considered K-complex and sleep spindles as anomalies and tried anomaly detection methods. The papers [10, 11] utilized optimization approaches.
Empirical mode decomposition (EMD) is an approach which decomposes a signal into its building block functions. EMD represents the signal in the form of a superposition of a number of components, each of which can be considered locally harmonic with slowly varying amplitudes and frequencies. EMD components are separated in the time-frequency plane [12]. Applying EMD to the sleep EEG signal showed desirable results in the sleep spindle detection [13].
SST is a time-frequency EMD-like tool for the purpose of signal analysis. It can be expressed as the combination of wavelet transform and reallocation approaches. It is able to decompose signals into their time-varying oscillatory ingredients in addition to providing an accurate estimation of the instantaneous amplitude and frequency modulation [14]. SST tackles the problem of blurring in the wavelet time-frequency representation [15]. SST decompositions are much sharper compared to wavelet decompositions. Moreover, they are able to identify specific frequency components of a signal with a reasonable accuracy, even in the presence of high level of noise [16]. Furthermore, SST is more powerful
in delineating the harmonic components compared to Fourier spectrum. It not only benefits from the advantages of EMD method but also is more robust in the case of noise embedded signals and provides much more easily interpretable results [16].
SST has been successfully applied to the biomedical signals, including respiratory and ECG signals which contain oscillation [17, 18]. In the recent years, it has been also adopted for the sleep spindle detection [16].
The main contribution of this paper is the proposing of a novel methodology for K-complex detection based on the SST combined with DETOKS.
This paper is organized as follows. Material and methods are discussed in section 2. Our proposed method is explained in section 3. Results are presented in section 4. The last section is dedicated to conclusion and discussion.
2- Material and methods
This section is dedicated to description of the dataset used in our study and two approaches which are combined in our work.
A. Database Description
Database used in this study is prepared and available online, via the so-called DREAMS project run by University of MONS- TCTS Laboratory (Stéphanie Devuyst, Thierry Dutoit) and Université Libre de Bruxelles - CHU de Charleroi Sleep Laboratory (Myriam Kerkhofs). This project is under the terms of the Attribution-NonCommercial-NoDerivs 3.0 Unported (CC BY-NC-ND 3.0) License [5]. Data were acquired using a digital 32-channel polygraph, in a sleep laboratory of a Belgium hospital. This database contains ten excerpts of 30 minutes of EEG from ten healthy subjects. Three EEG channels, including CZ-A1 or C3-A1, FP1-A1, and O1-A1, two EOG channels, including P8-A1 and P18-A1, and also one sub-mental EMG channel are recorded. Signals are extracted from the whole night polysomnography (PSG) recordings. For each subject, signals are accompanied by two experts’ annotations, which contain sleep stages, unknown stages, movements, and the K-complex patterns. Data are recorded at 200 Hz sampling rate. The two experts were independently asked to put labels on the data. Their annotation is done based on the following points.
A pattern considered as a K-complex must be a biphasic wave which is composed of a first negative sharp wave immediately followed by a slower positive one. Its duration should be at least 500 ms and should not exceed 1500 ms. Its amplitude should be at least twice as high as the background EEG. The amplitude of the negative component should be at least 50% of the positive amplitude component. Successive K-complexes in slow wave sleep should have the minimum interval of 2000 ms. K-complexes may occur in an isolated way or by the pair. They can be associated with spindles before, after, or even on them [5]. Table 1 contains complementary information. As this table represents, the second expert’s scoring is just available for the first five excerpts. Due to this fact, [11] and [19] only used the first five excerpts. For the same reason, we will use these excerpts as well. Having two experts with very different scorings is a crucial challenge in the validation process. To tackle this issue, the automatic results obtained in [19] are considered as another expert’s annotation. It is referred to as the third expert in Table 1.
Preprocessing was made by removing main power system noise with an appropriate notch filter. Signals are bandpass filtered with a filter with cut off frequencies of 0.5 and 75 Hz. B. Synchrosqueezing Wavelet Transform
Synchrosqueezing is considered as a special case of reallocation methods. Reallocation methods, in general, are proposed for the purpose of sharpening the time-frequency representation R(t,ω). These methods allocate the values of the time-frequency plane to other corresponding points on the plane. Actually, the new point (t`,ω`) is determined by the local behavior of R(t,ω) around (t,ω) [12].
Signals containing constituent components with time-varying oscillatory characteristics can be shown as s(t)=∑k
k=1sk(t), where sk(t) is a mono-component asymptotic AM_FM signal, and we have sk(t)=Ak(t)cos(ϕk(t)). In other words, sk(t) is a Fourier like oscillatory component. Ak(t) and ϕk(t) are the instantaneous amplitude and phase, respectively. Thus, the instantaneous frequency will be finst(t)=(dϕk(t))/dt.
We can summarize the SST algorithm in the following three steps:
1- calculating the complex continuous wavelet transform (CWT). For a given signal s(t), it holds that
For any given ξ, the mother wavelet ψ should satisfy the condition . If for ξ<0, it is said to be analytic. ψ(t) can be defined by ψ(t)=g(t)exp(jω0t), where g(t) is the window function and ω0 is the central angular frequency of the wavelet. Wavelet ridge is shown as the following set:
(ar,b) represents the ridge point at b and |Ws(ai,b)| denotes the wavelet coefficient modulus. In real applications, the analytic form of the signal is not usually available. The instantaneous frequency of the signal can be obtained from the extracted ridge as
Similarly, the instantaneous amplitude is
where ĝ(0) is the Fourier transform of g(t) at ω=0.
SST is proposed to tackle the problem of blurring of the time-frequency plane. Considering finst(t)=f and Ainst(t)=A, we will have
Since is concentrated around ξ=f0, Ws(a,b) should be concentrated around a=ω0/ω. However, Ws(a,b) often spreads out over a region around a=f0/f. Ws(a,b) has an oscillatory behavior in b points with the original frequency f, regardless
s
1
t b
W (a,b)
s(t)
(
)dt
a
a
−
=
∫
ψ
(1)(2)
(3)
(4)
(5) 2
0
( ) d
∞ψ ξ
ξ < ∞ ξ
∫
ψ ξ =ˆ ( ) 0(
)
(
)
{
,
2;
,
}
max
(
(
,
)
)
=
r∈
s r=
s iP
a b
R M a b
W a b
0 inst
r
f (t)
2 a (t)
ω
=
π
( )
(
( )
)
( ) ( )
ˆ
0
2
,
≈
s rinst
r
W a t t
A
t
a t g
ib ibf
s
1
ˆ
A
ˆ
W (a,b)
s( ) (a )e d
(af )e .
a
2 a
ξ
=
∫
ξ ϕ ξ
ξ =
ϕ
ˆ ( )
of the a values. Hence, we have the second step as follows. 2- Initial estimation of the phase transform for each (a,b) (for which Ws(a,b)≠0):
This will cancel out the wavelet influence on Ws.
3- Squeezing Ws(a,b) via reassignment leads to the SST representation that is given by
where . ε̃ and α are the threshold and accuracy, respectively. Furthermore, h is the smoothing function. In computation, a and b as the scaling variables and f as the frequency variable, are discrete. Consequently, Ws(a,b) is just computed at discrete values. The map (b,a)⟶(b,finst(a,b)) transfers information from the time domain to the time- frequency plane. Based on this mapping procedure, the Synchrosqueezing Transform S(f,b) is just performed at the centers fl of the successive bins
Thus, we will have the Synchrosqueezing Transform as [12, 16]
It is proved that SST has the perfect reconstruction property with the equation
C. DETOKS
In [11], a nonlinear method is proposed for the detection of sleep spindles and K-complexes (DETOKS). It models the
EEG signal as the sum of the following components.
In [11], a nonlinear method is proposed for the detection of sleep spindles and K-complexes (DETOKS). It models the EEG signal as the sum of the following components.
1- A transient component: it is comprised of spikes on a baseline of zero. This component is modeled as a sparse signal which has a sparse first order derivative.
2- A frequency component: this gives the low-frequency component of the EEG.
3- An Oscillatory component: This represents oscillations in the EEG with a sparse representation in the time-frequency domain.
DETOKS uses an optimization problem with a convex objective function for the purpose of estimation of the above components [11].
D. Teager-Kaiser Energy Operator
Nonlinear energy operators are used for the automatic detection of K-complexes. Teager-Kaiser energy operator (TKEO) is one of these methods which has been used. It is useful for the purpose of extracting the sharp rising and falling edges. However, the performance of TKEO is highly affected by the presence of transients [11, 20].
3- K-complex detection
In this section, we describe the proposed detection algorithm, which is a combination of SST and DETOKS approaches and finalized by using TKEO and a proper threshold.
An EEG signal, say x, is modeled as
where l is the low-frequency component. In the above, y represents the sparse component with sparse first order derivative. s is sparse as well and contains oscillations. The signal w represents the residual. For a given signal x with the length N, Φ: CM×K⟶CN can be defined by
while ΦH: CN⟶CM×K is given by
ΦH is the Hermitian transpose of Φ and satisfies ΦH Φ=I. Subject Sex Age Annotatedchannel Nr. of K-complexes scored by expert1 Nr. of K-complexes scored by expert2 Nr. of K-complexes scored by expert3
1 man 20 CZ-A1 34 19 22
2 woman 23 CZ-A1 45 8 37
3 woman 47 CZ-A1 12 3 14
4 woman 24 CZ-A1 78 14 63
5 woman 23 CZ-A1 39 20 40
6 man 23 CZ-A1 28 -
-7 man 27 CZ-A1 11 -
-8 woman 46 CZ-A1 4 -
-9 man 27 CZ-A1 5 -
-10 woman 21 CZ-A1 16 -
-Table 1. Data information [5]
(6)
(7)
(8)
(9)
(10)
(11)
(12)
( )
,
( )
.
( )
,
,
∂
=
s∂
inst
s
i
W a b
f
a b
b
W a b
1, 1
2 − 2 −
− −
− +
fl fl fl fl fl fl
k s k 1
3 2
1 s k k k
f a :|f (a ,b) f |
2
1
S(f ,b)
W (a ,b)a ( a)
f
− ∆
− ≤
=
∆
∆
∑
3
ib 1 2
s
0 0
ib 1
0 0
1
ˆ
ˆ
W (a,b).a da
s( ) (a )e a da d
2
1
s( ) (a )e a da d
ˆ
ˆ
2
∞ ∞ ∞
− ξ −
−∞ ∞ ∞
ξ −
=
ξ ϕ ξ
ξ
π
=
ξ ϕ ξ
ξ
π
∫
∫ ∫
∫∫
,
, , ,
,
= + + +
∈
R
Nx l y s w l y s w
( )
1 −
Φ
c := SST
c
( )
H
Φ
x := SST x
(
)
( )
( )
( )
,
3 2 ,
,
1
,
, . . (
)
ε α
ε
ω − ω
ω =
α
α
∫
s
s s
s
A b
a b
S
b W a b
h
a da
( )
( )
, { ; , }
+
ε s = ò� s > ε
Our goal is the estimation of components l, y and a in (10). Based on the above formulation, the component s can be modeled by
where c∈CM×K is the SST coefficient matrix. The high-pass filter H is defined based on the low-pass one, i.e. L, and is obtained by
With the assumption of being zero phase, or approximately zero phase for the low pass filter, the corresponding high pass filter that has a second order zero at z=1, for a signal of length N, H has the size (N-2d)×N. Applying the high pass filter H to the signal x given in (14) results in
DETOKS uses the following unconstrained optimization problem for the purpose of estimating the components y and c for a given signal x, as well as minimizing the energy of the residual w.
where the matrix D is defined as
Using this matrix, Dy yields the first-order difference of a discrete signal y with the lenght N. The matrix D is of the size (N-1)×N. Using l1 norm in the objective function (16) improves the sparsity of the signal y, its first derivative Dy, and the SST coefficient matrix c. λ0,λ1 and λ2 are regularization parameters. H is set to be a zero phase recursive discrete time filter, given by
where A and B are banded Toeplitz matrices. When a signal of length N is filtered by the second-order high-pass filter, A and B should be of the size (N-2d)×(N-2d) and (N-2d)×N, respectively.
The convex objective function in (16) is solved by Douglas-Rachford splitting approach. It leads to alternating direction method of multipliers (ADMM). Consequently, (16) can be written as
It is obvious that (19) is equivalent to (16). Minimizing (19) is carried out using the scaled augmented Lagrangian through the following iterative procedure.
μ>0. Y and c can be minimized independently, due to the separablity of minimization in (21). Consequently, (21) can be expressed as
Using the solution to the fused LASSO problem and the soft threshold function, solutions to (24) and (25) are
where soft(∙) represents the soft threshold function for λ>0, λ∈R, and is defined by
Making the following substitutions, we will have the solution to (23) as
where u,d,y̅∈R2N. According to the above substitutions, (20) can be rewritten as
As a result, the solution to (31) is
I2N is the identity matrix with the size 2N×2N. According to the equation (18) and the perfect reconstruction property of Φ (ΦH Φ=I), one can say that
The two above equations and the matrix inverse lemma results in:
,
= Φ
s
c
(13)(14) (20) (21) (22) (23) (24) (25) (26) (27) (28) (29) (30) (31) (32) (33) (34) (15) (16) (17) (18) (19)
.
−
H := I L
(
− − Φ ≈
)
.
H x y
c
w
2
y,c 2
0 1 1 1 2 1
1
arg min { || H(x y
c ||
2
y
Dy
c }
− − Φ
+ λ
+ λ
+ λ
1 1
1 1
.
.
D :
.
.
.
.
1 1
−
−
=
−
1 −=
H A B
(
)
1← −1 1−
d d u y
(
)
2
←
2−
2−
d d
u c
2
0 1 1 1 1 1 2
arg m
2 y
in Dy µ
← λ + λ + − −
y
y u y d
2
2 1 2 2 2
arg min
c
.
2
µ
←
λ
+
− −
c
c
u c d
1 0
1 1
,
,
λ
λ
←
−
µ
µ
y
soft tvd u d
2
2 2
,
λ
←
−
µ
c
soft u d
(
, :
)
,
0.
λ
−
> λ
λ =
∈
≤ λ
C
y
y
y
y
soft y
y
y
[
1,
2]
,
[
1,
2]
=
T=
Tu
u u
d
d d
[ ]
,
,
[
,
]
=
T=
Φ
y
y c M
I
2 2
2 2
1
arg min / 2 2
← − + µ − −
u
u Hx HMu u y d
(
)
1 2
−
← T T + µ T T + µ +
N
u M H HM I M H Hx y d
(
)
12
−
= =
T T T
T
H H B AA B
MM I
(
)
1 2
2
1 2 2 0 1 1 1 , , ,
2 1 1 2
{ } 1 arg min 2 . . ,
− − Φ + λ + λ
+ λ = =
u u y c H x u u y Dy
c s t u y u c
( )
1 2
2 2
1 2 , 1 2 2 1 12 2 22
1
, arg min
2 2 2
{ µ µ }
← − − Φ + − − + − −
u u
u u H x u u u y d u c d
1 2
2 0 1 1 1 2 1 1 12 2 22 , , argmin 2 { 2 } µ µ
← λ + λ + λ + − − + − −
u u
As A and B are banded matrices, the matrix μAAT+2BBT is banded, as well. The following solution for (20) is the consequence of the combining (35) and (32).
DETOKS algorithm is obtained by combining the above routines. After calculating y and c, the other two components, i.e. s and f, will be calculated as follows.
K-complex is embedded in the low-frequency component f. K-complex detection is accomplished by applying the TKEO, i.e. T(.), to the low frequency component f. T(.) for a discrete time signal x is defined by
A binary signal is defined based on a constant threshold:
Durations of the detected K-complexes are checked with the definition of the K-complex. Durations smaller than 500 ms are rejected.
4- RESULTS
A. Evaluating SST for K-complex Detection
In [15], we proposed the method SST for the purpose of K-complex analysis due to the fact that it makes a distinctive representation of this pattern in the time-frequency plane as Figure 1 indicates.
First of all, we quantify the ability of SST in the detection of K-complex pattern. The analysis of variance (ANOVA) is used for this purpose.
As mentioned before, we use the first five signals of the database. For this part, the visual annotation made by the two experts is used. Actually, we have two sets. The first one consists of K-complexes that are scored by both experts. To generate the second set, we extracted the segments of the signals which are labeled as K-complex by either of the experts and just used the remaining parts of the signal. SST is applied to the K-complex segments. It is also applied to the same number of randomly chosen segments the non K-complex set. These segments have the random length
between 500-1500 ms. After applying SST, for each segment, the absolute value of the coefficients and the amountof instantaneous phase are calculated. Then, the mean value of the coefficients is obtained in the frequency band 0.5-2 Hz. The same is done for the instantaneous phases.
(35)
(36)
(37)
(38)
(39)
(40)
(41) (42)
(43)
(44)
(
)
(
(
)
)
(
)
(
)
1
1 1
2 2
1 2
1 2
−
− −
−
+ µ = + µ
= − µ + µ
T T T T T
N N
T T T T
N
M H HM I M B AA BM I
I M B AA BB BM
1
1 1
1
2 2
1
1 1 1 2
1
2 2 1 2
(
2
)
1
(
),
1 ,
(
),
,
.
(
)
(
)
−
−
−
−
← µ
+
←
+
+
µ
← Φ
+ +
µ
←
−
+ Φ
←
− Φ
+ Φ
T T
T T
T T
T
H T
G
AA
BB
g
B AA
Bx
y d
g
B AA
Bx
c d
u
g B G B(g
g )
u
g
B G B(g
g )
(
)
1(
)
,
−
← Φ
←
− − −
− −
s
c
f
x y s
A B x y s
( )
2( )
−
(
−
1 .
) (
+
1 .
)
T x
n:=
x n
x n
x n
( )
=
0,
1,
( )
( )
>
≤
KC
T f
c
b
t
T f
c
Fig. 1. An EEG signal containing two K-complexes (based on the expert’s scoring) and corresponding SST of the signal [15]
Fig. 2. One way ANOVA test on K-complex and non K-complex segments. Top: mean absolute values of the coefficients,
Bottom: mean instantaneous phase
ANOVA is used to investigate the ability of each of the aforementioned features. The result of the ANOVA test is represented in Figure 2, which indicates the two groups of K-complex and non K-complex are well-separated with both features.
However, as seen in Figure 2, the mean value of the absolute coefficients had a superior performance compared to the mean value of the instantaneous phases. P-values associated with the mean absolute coefficient and mean instantaneous phase are 0.00055 and 0.0198, respectively.
Figure 3 shows the result of the multi-compare test, which indicates two groups are well-separated using both features. According to the result of the above tests, the absolute values of the SST coefficients in the frequency band which correspond to the K-complex can be used for the detection of this pattern.
B. Detection results
As mentioned before, the database provided extremely different scorings by two experts. Thus, we considered the results of [19] as another expert’s scoring. We use a voting decision procedure. In other words, we use the majority for the purpose of re-scoring the data. Table 2 illustrates scorings in detail. The results given in [19] are referred to as expert 3.
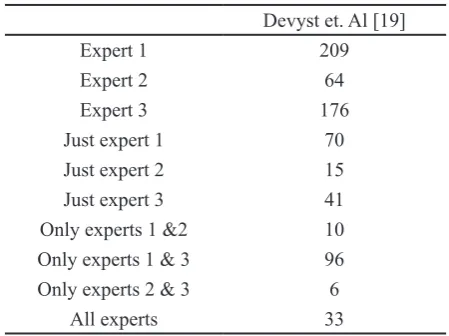
As shown in Figure 4, experts 1, 2 and 3 have scored 70, 41 and 15 K-complexes, respectively, which are not scored by any other expert. For other annotations, there are at least
two votes. Hence, based on the above decision procedure, the total number of K-complexes would be 145.
In the next step, DETOKS is applied to the signals. The following step is applying our proposed method, which was described in the previous section. Results are provided in Table 3. It contains results of applying DETOKS and also our proposed method by using CWT and SST.
Table 3 consists of the number of true positive and true negative and the number of false positive and false negative, which denoted by TP, TN, FP and FN, respectively. TN is calculated based on the following formulation [19]:
This formulation is based on the fact that there are five signals with the duration 1800 s. If the mean duration of K-complexes is considered 1 s, we would have (45) [19].
C. Statistical Analysis
In order to evaluate the results, the factors recall (sensitivity), specificity, precision, and accuracy are calculated. These factors are defined as and , respectively.
Other than the above factors, the results can be evaluated based on some more powerful measures [11, 21]. F1 is a measure of the accuracy of the test which is the harmonic mean of precision and recall in its traditional form
Matthews Correlation Coefficient (MCC) is a performance measure. It is defined by
It contains all four confusion matrix instances. Furthermore, it is a balanced measure which is applicable even if classes are of unequal sizes. MCC returns a value between -1 and 1, where -1 indicates the worst result while 1 shows the best. 0 is related to a result not better than random.
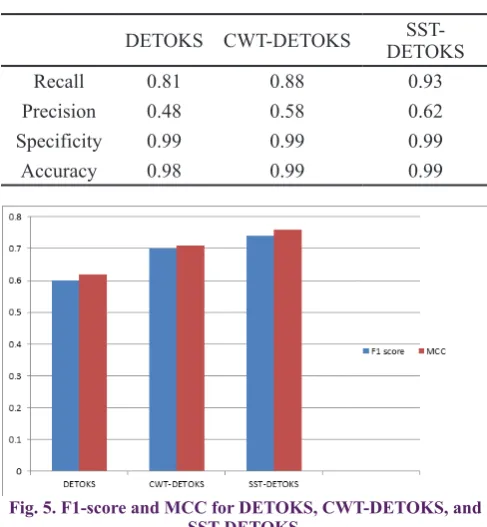
The statistical analysis results, based on the above equations, are summarized in Table 4. These results show CWT-DETOKS outperforms DETOKS and SST-DETOKS outperforms the both.
Due to the great number of TN, specificity and accuracy are not discriminative. Hence, we use F1-score and MCC to express the results. The first bars in Figure 5 are related to the F_1-score, which are 0.60, 0.70 and 0.74 and the second bars correspond to MCC, which are 0.62, 0.71 and 0.76 for DETOKS, CWT-DETOKS and SST-DETOKS, respectively.
Devyst et. Al [19]
Expert 1 209
Expert 2 64
Expert 3 176
Just expert 1 70
Just expert 2 15
Just expert 3 41
Only experts 1 &2 10 Only experts 1 & 3 96 Only experts 2 & 3 6
All experts 33
DETOKS CWT-DETOKS SST-DETOKS
TP 118 127 135
TN 8729 8764 8772
FP 126 91 83
FN 27 18 10
Table 2. Summarization of K-complex detection on the first five excerpts of dreams database
Table 3. Confusion matrix
Fig. 4. Scoring based on a voting procedure among experts
5 1800
=
−
−
−
TN
*
FP TP FN
(45)(46)
(47)
, ,
+ + +
TP TN TP
TP FN FP TN TP FP
+ + + +
TP TN TP TN FP FN
1
1
2
1
2
×
=
=
+
+
recall percision
F
recall percision
recall percision
(
)(
.)(
.)(
)
− =
+ + + +
TP TN FP FN MCC
5- Conclusion and Discussion
In this paper, we proposed a new approach for K-complex detection. In our previous work, SST was proposed for the analysis of the K-complex pattern. In this study, SST was assessed for the detection of the K-complex. Two features, including the mean absolute value of the coefficients and mean instantaneous phase in the frequency band, which correspond to this pattern, were studied. The analytic ANOVA test and the multi-compare post-test illustrate that these features are able to make a proper distinction between two groups of K-complex and non K-complex. This will support the idea of the efficiency of these features in classification-based approaches.
As mentioned earlier, disagreement among experts’ annotations is a crucial challenge in validation of K-complex detection methods. DREAMS dataset, which is used in this study, contains visual scorings made by two experts and also scorings made by an automatic method. We considered the automatic approach as the third expert and obtained the labels based on a voting approach among the three experts. Of course, asking a third expert to score the data is a better idea, if possible. It might lead to better detection results.
Our main contribution was proposing a method for K-complex detection which is a modification of DETOKS by using SST. DETOKS is a detection method based on sparse optimization. Most of the current K-complex detection methods are based on classification, which requires a quite big training set. However, recent detection methods, based on optimization, do not need this training procedure. SST is used due to its properties as a time-frequency transform is modified by reallocation methods, in addition to the previous results of applying it to biomedical signals that contain oscillation. SST is a wavelet method in its nature. Because of the semi-sinusoidal form of the oscillatory component, the wavelet transform needs a semi-sinusoidal kernel. Morlet is an appropriate choice. The morphologic appearance of the Morlet, in addition to its ability to provide a time-frequency
plane with a higher resolution than other wavelets, makes it proper for our purpose. Morlet is also used for the CWT-DETOKS.
It is noteworthy to mention that although [11] and [19] used the same database, based on the aforementioned re-scoring, it was not possible to compare results with [19]. Additionally, due to the different approaches of calculating and reporting the results in [11], it was not possible to compare our results with those. Thus, we applied DETOKS on the data. Then, as the first contribution, the effect of using CWT in junction with DETOKS is studied. As reported in the previous section, it can modify the results compared to DETOKS. Our proposed method, however, leads to the better detection results based on the results reported in the previous section. As expressed, CWT-DETOKS results in the higher number of TP and decreases the number of FN. SST-DETOKS improves these amounts compared to CWT-DETOKS. Statistical measures, especially F1-score and MCC, express the better performance of SST-DETOKS. Our goal was evaluating the proposed method. However, using some denoising preprocessings will improve the results.
6- Acknowledgment
The authors wish to express their appreciation to Professor Ankit Parekh (New York University) and Dr. Leila Ghanbari (Neurology Department, Ghaem Hospital, Mashhad, Iran) for their kind advice.
REFERENCES
[1] E. Hernández-Pereira, V. Bolón-Canedo, N. Sánchez-Maroño, D. Álvarez-Estévez, V. Moret-Bonillo, A. Alonso-Betanzos, A comparison of performance of K-complex classification methods using feature selection, Information Sciences, 328 (2016) 1-14.
[2] T. Lajnef, S. Chaibi, J.-B. Eichenlaub, P.M. Ruby, P.-E. Aguera, M. Samet, A. Kachouri, K. Jerbi, Sleep spindle and K-complex detection using tunable Q-factor wavelet transform and morphological component analysis, Frontiers in human neuroscience, 9 (2015).
[3] A.L. Pinto, I.S. Fernández, J.M. Peters, S. Manganaro, J.M. Singer, M. Vendrame, S.P. Prabhu, T. Loddenkemper, S.V. Kothare, Localization of sleep spindles, k-complexes, and vertex waves with subdural electrodes in children, Journal of Clinical Neurophysiology, 31(4) (2014) 367-374. [4] V. Kokkinos, G.K. Kostopoulos, Human non‐rapid eye
movement stage II sleep spindles are blocked upon spontaneous K‐complex coincidence and resume as higher frequency spindles afterwards, Journal of sleep research, 20(1pt1) (2011) 57-72.
[5] http://www.tcts.fpms.ac.be/~devuyst/Databases/ DatabaseKcomplexes/
[6] V. Kokkinos, A.M. Koupparis, G.K. Kostopoulos, An intra-K-complex oscillation with independent and labile frequency and topography in NREM sleep, Frontiers in human neuroscience, 7 (2013).
[7] W.O. Tatum IV, Handbook of EEG interpretation, Demos Medical Publishing, 2014.
[8] T.A. Camilleri, K.P. Camilleri, S.G. Fabri, Automatic detection of spindles and K-complexes in sleep EEG using switching multiple models, Biomedical Signal Processing and Control, 10 (2014) 117-127.
DETOKS CWT-DETOKS DETOKS
SST-Recall 0.81 0.88 0.93
Precision 0.48 0.58 0.62
Specificity 0.99 0.99 0.99
Accuracy 0.98 0.99 0.99
Fig. 5. F1-score and MCC for DETOKS, CWT-DETOKS, and SST-DETOKS.
[9] T. Babaie, S. Chawla, R. Abeysuriya, Sleep analytics and online selective anomaly detection, in: Proceedings of the 20th ACM SIGKDD international conference on Knowledge discovery and data mining, ACM, 2014, pp. 362-371.
[10] Z.R. Zamir, N. Sukhorukova, H. Amiel, A. Ugon, C. Philippe, Convex optimisation-based methods for k-complex detection, Applied Mathematics and Computation, 268 (2015) 947-956.
[11] A. Parekh, I.W. Selesnick, D.M. Rapoport, I. Ayappa, Detection of K-complexes and sleep spindles (DETOKS) using sparse optimization, Journal of neuroscience methods, 251 (2015) 37-46.
[12] I. Daubechies, J. Lu, H.-T. Wu, Synchrosqueezed wavelet transforms: An empirical mode decomposition-like tool, Applied and computational harmonic analysis, 30(2) (2011) 243-261.
[13] C. Yücelbaş, Ş. Yücelbaş, S. Özşen, G. Tezel, S. Küççüktürk, Ş. Yosunkaya, Automatic detection of sleep spindles with the use of STFT, EMD and DWT methods, Neural Computing and Applications, (2016) 1-17. [14] G. Thakur, E. Brevdo, N.S. Fučkar, H.-T. Wu, The
synchrosqueezing algorithm for time-varying spectral analysis: Robustness properties and new paleoclimate applications, Signal Processing, 93(5) (2013) 1079-1094. [15] Z. Ghanbari, M.H. Moradi, Synchrosqueezing transform:
Application in the analysis of the K-complex pattern, in: Biomedical Engineering and 2016 1st International Iranian Conference on Biomedical Engineering (ICBME), 2016 23rd Iranian Conference on, IEEE, 2016, pp. 221-225.
[16] M.M. Kabir, R. Tafreshi, D.B. Boivin, N. Haddad, Enhanced automated sleep spindle detection algorithm based on synchrosqueezing, Medical & biological engineering & computing, 53(7) (2015) 635-644.
[17] H.-T. Wu, Y.-H. Chan, Y.-T. Lin, Y.-H. Yeh, Using synchrosqueezing transform to discover breathing dynamics from ECG signals, Applied and Computational Harmonic Analysis, 36(2) (2014) 354-359.
[18] H.-T. Wu, S.-S. Hseu, M.-Y. Bien, Y.R. Kou, I. Daubechies, Evaluating physiological dynamics via synchrosqueezing: Prediction of ventilator weaning, IEEE Transactions on Biomedical Engineering, 61(3) (2014) 736-744.
[19] S. Devuyst, T. Dutoit, P. Stenuit, M. Kerkhofs, Automatic K-complexes detection in sleep EEG recordings using likelihood thresholds, in: Engineering in Medicine and Biology Society (EMBC), 2010 Annual International Conference of the IEEE, IEEE, 2010, pp. 4658-4661. [20] J.M. O’Toole, A. Temko, N. Stevenson, Assessing
instantaneous energy in the EEG: a non-negative, frequency-weighted energy operator, in: Engineering in Medicine and Biology Society (EMBC), 2014 36th Annual International Conference of the IEEE, IEEE, 2014, pp. 3288-3291.
[21] L.K. Krohne, R.B. Hansen, J.A. Christensen, H.B. Sorensen, P. Jennum, Detection of K-complexes based on the wavelet transform, in: Engineering in Medicine and Biology Society (EMBC), 2014 36th Annual International Conference of the IEEE, IEEE, 2014, pp. 5450-5453.
Please cite this article using:
Z. Ghanbari and M. H. Moradi, K-Complex Detection Based on Synchrosqueezing Transform, AUT J. Elec. Eng., 49(2)(2017)215-222.
![Table 1. Data information [5]](https://thumb-us.123doks.com/thumbv2/123dok_us/16399.2001631/3.595.53.525.87.282/table-data-information.webp)
![Fig. 1. An EEG signal containing two K-complexes (based on the expert’s scoring) and corresponding SST of the signal [15]](https://thumb-us.123doks.com/thumbv2/123dok_us/16399.2001631/5.595.309.533.142.302/signal-containing-complexes-based-expert-scoring-corresponding-signal.webp)