doi:10.4236/ojs.2011.13027 Published Online October 2011 (http://www.SciRP.org/journal/ojs)
Infant Mortality Rate Statistic Method and Difference
Analysis in China
*
Benfeng Du, Yu Zhang
Center for Population and Development Studies, Renmin University of China, Beijing, Chian E-mail: [email protected], [email protected]
Received May 31, 2011; revised June 2, 2011; accepted July 13,2011
Abstract
Infant mortality rate (IMR) has been viewed as the vital index which can be used to measure the health level of a country or a district, and also can indirectly illustrate the economic development level of the country or district. In this paper, the authors 1) introduce three calculation methods of IMR and compare the differences among them; 2) calculate the IMR using one method above, and find the IMRs recorded in China Population Statistic Yearbook (CPSY) from National Statistics Institute and in China Health Statistic Yearbook from Ministry of National Hygiene are both overestimated; 3) point out three main reasons for this overestimation: firstly, confusion of methods of calculation and concepts, secondly, inconsistent statistical caliber among different yearbooks, thirdly, flaws within the registration system.
Keywords:Infant Mortality Rate, Statistic Method, Differences Analysis
1. Introduction
The mortality rate of infant is generally higher than that of other age groups due to the fact that the immature state of infants’ organs causes infants to have a low ad- aptation level to the external environment [1]. In devel-oped regions, the infant surviving rate is comparatively high, while in less developed regions, the IMR is com-para- tively high. Hence, the IMR is often viewed as an index which is a reflection of a region’s social economics, the level health of a region’s population and health ser- vices—especially those pertaining to maternity and chil- dren. Reducing the IMR has a great influence on reduce- ing the mortality rate of the population of a whole coun- try and is regarded as a crucial condition for strengthen improving the chance of the survival and growing up of infants. Thus, because the IMR exerts a significant in-fluence on demographics of a country or region and the structure and tendencies of the population of a country or region, how to express the index exactly is a crucial problem [2].
Based on the calculation of the authors, the data from CPSY seriously overestimates the actual infant mortality
level of China. Firstly, there are many different calcula- tion models for IMR; however, the formula used in the Year Book confuses different concepts, particularly the concepts of infant mortality rate (IMR) and zero-age- group mortality rate (ZAGMR). Secondly, the statistic caliber differs between different Year Books compiled by different institutions. Hence, this paper will compare different calculation models, and also recalculate the IMR for recent years in China by the appropriate one of these models, aiming to seek the actual infant mortality level of China.
2. The Introduction of Calculation Methods
for IMR and the Comparison Analysis
2.1. IMR Statistic Method (1)
IMR = (D(t, 0)/Bt) × 1000‰ =
(D(t–1, t, 0) + D(t, t, 0)/Bt) × 1000‰ (1)
D(t–1, t, 0) is the number of babies born in the year of (t – 1)
and die in the year of t, D(t, t, 0) is the number of babies
born in the year of t and die in the year of t.
In this model, the IMR equals the number of babies who die in the year of t and is divided by the number of babies born in the year t. This model can be used when the number of births per year is stable.
*Supported by the National Natural Science Funds (NSFC) (70773116)
and Supported by the Fundamental Research Funds for the Central Universities, and the Research Funds of Renmin University of China
late the actual IMR: the infant death number of all the number of babies born in this year.
Weakness: the inconsistency between the numerator and denominator makes the model inexact. The numera- tor (the death number of infants that have failed to sur- vive one year) includes the number of babies who were born in the year of(t– 1)and die in the year of t, and that of babies who were born in the year of t and die in the year of t; however, the denominator includes the number of babies who were born in the year of t and die in this year, and also that of healthy babies who were born in this year. Thus, the correlation between the numerator and denominator is somewhat distorted, to that extent that this model can not be an accurate method to describe the IMR.
2.2. IMR Statistic Method (2)
IMR = (D(t–1, t, 0)/Bt–1 + D(t, t, 0)/Bt) × 1000‰ (2)
In this model, the IMR is the infant mortality number of infants born in the year of (t – 1) and die in the year of t, divided by the birth number in the year of (t – 1), plus the outcome of the infant mortality number who were born in the year of t and die in the same year, and di- vided by the birth number in the year of t.
Merit: This is the most accurate method to calculate the IMR. It guarantees the consistency of the correlation between the numerator and denominator by separately calculating the outcome of the two different groups of infants who were born in the year of (t – 1) and t, and then, adding them together.
Weakness: Practically, it is too difficult to get fault- less census data in practical operation. In China, the re- port data of infant deaths does not always reflect the ac- tual death number. If an infant is born in violation of family planning policy, the birth or death of such infants is often not reported. Additionally, due to the intense grief that an infant’s death can bring, many families do not immediately report deaths or perhaps do not even report the death at all. As a result, getting accurate infant mortality data becomes more difficult.
2.3. IMR Statistic Method (3)
IMR = ([D(t–1, t, 0) + D(t, t, 0)]/[aBt–1 + (1 – a)Bt]) × 1000‰ = (D(t, 0)/[aB(t–1) + (1–a)Bt]) × 1000‰3 [3] (3)
In this model, the IMR equals the infant death number of the year of t, divided by the outcome of the birth number of the year of (t – 1) multiplied by a, plus the birth number of the year of t multiplied by (1 – a). In this
model, a is an empirical coefficient, and usually a equals 1/3. In these three models, the easier method is to modu- late the denominator like the third model, calculating the denominator based on the data of the birth number of the year of t and (t – 1) while giving greater weight to the birth number of the year t in order to cater for the differ- ence in risk of death in different months of an infant’s early life. In the first 28 days after the birth, the risk of death for an infant is much higher than that of the next 11months. In the first year of an infant’s life, the further in time an infant is away from their date of birth, the lower the risk of death is.
Merit: This model according to [4],keeps the consis- tency between the numerator and denominator. Addi- tionally, as long as the death of an infant is reported within one year of the infant’s death, statistic errors often brought about by a formula that does not cater for fami- lies who do not immediately report an infant’s death can be significantly reduced [5].
Weakness: The value of the empirical coefficient is needed careful consideration and should be modulated according to different situations. Because the model in- volves the data of two years, the coefficient is available only when the birth rate is stable. If some uncertainties occur, like a baby boom, natural disaster and et cetera, the validity of coefficient becomes questionable. More- over, the tendency of development of IMR is that it will maintain a high level in early stages of monitoring, and after a time of a region undergoing economic develop- ment and subsequent progression and improvement medical standards, the IMR will gradually decrease to a comparatively low level. Thus, the validity of an invari- able empirical coefficient and its relation to the IMR over different time periods is again brought into ques- tion.
3. The Positive Analysis and the Reasons for
the Differences between Modes
In the last section, three different models for the calcula- tion of the IMR were introduced along with an analysis of merits and weaknesses of each. The data is from [6]. In the below discussion, outcomes of the Equations (1) and (3) will be com- pared in order to verify the magni-tude of the differences in results that the two equations can bring. Because the application of Equation (2) needs much more information which is difficult to collect, it is not used below.
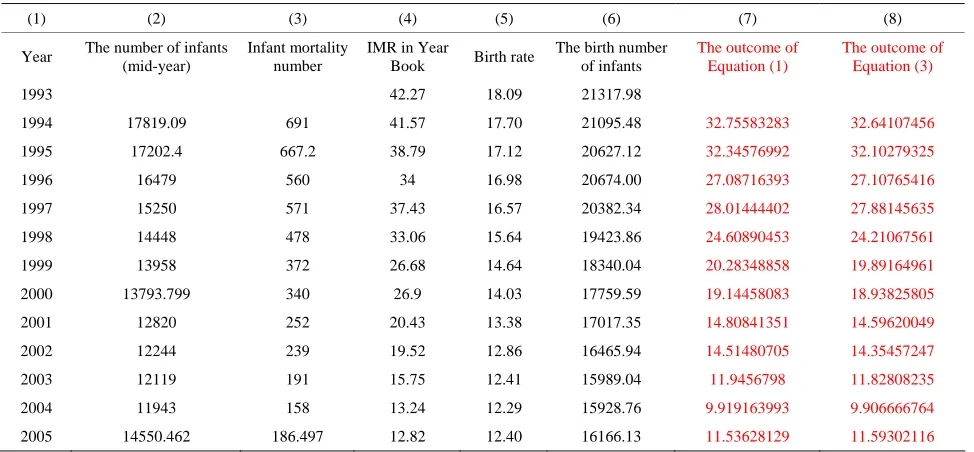
In the Table 1, column 1 - 6 illustrate the actual statis- tic data from CPSY, and column 7 and 8 indicate the writers’ calculations of the IMR using Equations (1) and (3) and using the data of column 1 - 6. Figure 1 directly contrasts the trends of the IMR over time in accordance
3Liu Zheng, Wu Cangping and Zha Ruichuan, “Demography”, Renmin
Table 1. Comparison and contrast.
(1) (2) (3) (4) (5) (6) (7) (8) Year The number of infants
(mid-year)
Infant mortality number
IMR in Year
Book Birth rate
The birth number of infants
The outcome of Equation (1)
The outcome of Equation (3)
1993 42.27 18.09 21317.98
1994 17819.09 691 41.57 17.70 21095.48 32.75583283 32.64107456
1995 17202.4 667.2 38.79 17.12 20627.12 32.34576992 32.10279325
1996 16479 560 34 16.98 20674.00 27.08716393 27.10765416
1997 15250 571 37.43 16.57 20382.34 28.01444402 27.88145635
1998 14448 478 33.06 15.64 19423.86 24.60890453 24.21067561
1999 13958 372 26.68 14.64 18340.04 20.28348858 19.89164961
2000 13793.799 340 26.9 14.03 17759.59 19.14458083 18.93825805
2001 12820 252 20.43 13.38 17017.35 14.80841351 14.59620049
2002 12244 239 19.52 12.86 16465.94 14.51480705 14.35457247
2003 12119 191 15.75 12.41 15989.04 11.9456798 11.82808235
2004 11943 158 13.24 12.29 15928.76 9.919163993 9.906666764
2005 14550.462 186.497 12.82 12.40 16166.13 11.53628129 11.59302116
Unit: Thousand people; ‰. http://annual.apabi.com/ruc/ybsearch/ybtext.aspx?FileID=ys.00340000000000000000&fromchcon=&cult=CN. Data source: China Population Statistic Yearbook (CPSY).
with Equation (1) and Equation (3). Figure 1 shows that the difference of IMRs produced by the different calcula- tions of Equation (1) and Equation (3) are minuscule, as the differently calculated IMRs essentially share the same level and trends over time. A comparison between the IMR calculated by Equation (3) and that recorded in CPSY is given below.
recorded in the CPSY that there is a significant differ- ence between the two. Figure 2 illustrates the difference between two differently calculated IMRs.
Notably, the IMR cited from CPSY is much higher than that computed by Equation (3). Based on results of applying Equation (3), the 1994 IMR of China was 32.64‰; in contrast, this index was recorded as 41.57‰ in CPSY. According to the results of applying Equation (30, the 2005 index is estimated at 11.59‰, 1.23‰ lower than that recorded in the CPSY for the same year. In the year of 2004, according to the results of applying Equa- tion (3), the IMR decreased to its lowest level—9.91‰, however, the CPSY has the IMR for the same year re- corded as 13.24‰.
3.1. Two Differently Calculated IMRs’ Difference
From Table 2, it can be seen that from 1993 to 1995, the population of China steadily increased from 1.178 billion to 1.304 billion and the IMR declined from 42.27‰ to 12.82‰, a result of the rapid development of the econ- omy and subsequent improvements in the level of health- care
We have already discussed that the accuracy of IMR is rather vital because of its sensitivity and significance. Unfortunately, as the CPSY’s IMR is totally different from the IMR calculated according to Equation (3), some IMRs although the same year have differences of more than 10% due to the different methods of calculation applied. In China, the gross population is so tremendous that 10‰ of more than 15 million new born babies per year is about 15 thousand. The fact that the CPSY re- cords excessively so many infant mortalities every year is quite shocking. Hence, it is worth pursuing the ques- tion: what causes the overestimation of IMR in the year book?
However, does the IMR cited from CPSY reflect the actual IMR of China? We can learn from the contrast between the IMR calculated by the Equation (3) and that
3.2. Difference Cause Analysis
According to the opinion of the authors of this paper,
[image:3.595.59.286.618.706.2]Table 2. Comparison between the calculated data and CPSY.
(1) (2) (3) (4) (5) (6) (7) Year The number of infants
(mid-year)
Infant mortality number
IMR in Year
Book Birth rate
The birth number of
infant The outcome of Equation (3)
1993 42.27 18.09 21317.98
1994 17819.09 691 41.57 17.70 21095.48 32.64107456
1995 17202.4 667.2 38.79 17.12 20627.12 32.10279325
1996 16479 560 34 16.98 20674.00 27.10765416
1997 15250 571 37.43 16.57 20382.34 27.88145635
1998 14448 478 33.06 15.64 19423.86 24.21067561
1999 13958 372 26.68 14.64 18340.04 19.89164961
2000 13793.799 340 26.9 14.03 17759.59 18.93825805
2001 12820 252 20.43 13.38 17017.35 14.59620049
2002 12244 239 19.52 12.86 16465.94 14.35457247
2003 12119 191 15.75 12.41 15989.04 11.82808235
2004 11943 158 13.24 12.29 15928.76 9.906666764
2005 14550.462 186.497 12.82 12.40 16166.13 11.59302116
Unit: thousand people; ‰. http://annual.apabi.com/ruc/ybsearch/ybtext.aspx?FileID=ys.00340000000000000000&fromchcon=&cult=CN. Data source: China Population Statistic Yearbook (CPSY)
Figure 2. Comparison between the calculated data and CPSY.
there are three main reasons for the overestimation of IMR in the CPSY: 1) the confusion between two similar but different concepts in calculating IMR, 2) different statistical criteria, 3) the inaccuracy of the registration of births and deaths.
3.2.1. Confusion between Different Concepts
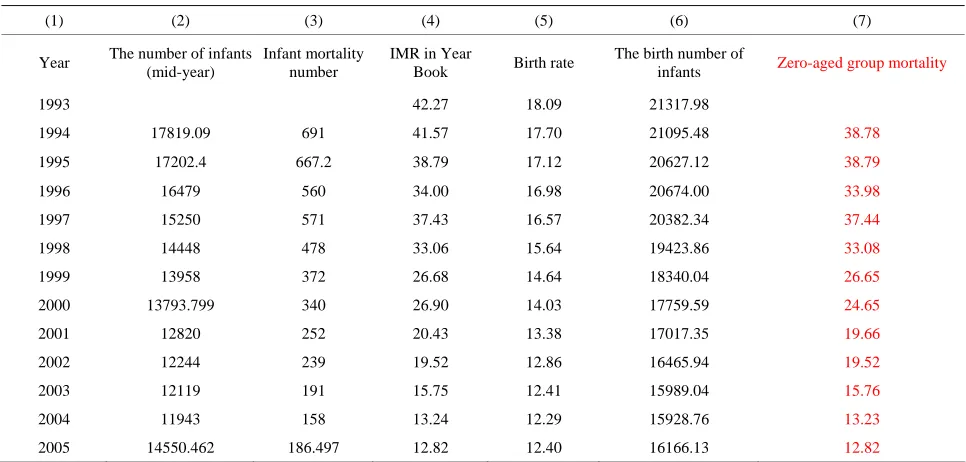
After calculations, it is found incredibly that, although the definition of IMR in CPSY is the number of infant deaths that is under one full year of life per thousand births each year, the IMR recorded in CPSY is surpris- ingly similar to the value that calculated for infants of the zero-aged group: (see Table 3 and Figure 3).
Zero - aged group mortality rate
the number of infant mortality
1000 the number of infant in mid - year
‰
(Assuming that the population of a district changes
equably) ‰
[image:4.595.115.485.365.524.2]Table 3. Comparison between the calculated zero-aged group mortality and IMR in the CPSY.
(1) (2) (3) (4) (5) (6) (7)
Year The number of infants (mid-year)
Infant mortality number
IMR in Year
Book Birth rate
The birth number of
infants Zero-aged group mortality
1993 42.27 18.09 21317.98
1994 17819.09 691 41.57 17.70 21095.48 38.78
1995 17202.4 667.2 38.79 17.12 20627.12 38.79
1996 16479 560 34.00 16.98 20674.00 33.98
1997 15250 571 37.43 16.57 20382.34 37.44
1998 14448 478 33.06 15.64 19423.86 33.08
1999 13958 372 26.68 14.64 18340.04 26.65
2000 13793.799 340 26.90 14.03 17759.59 24.65
2001 12820 252 20.43 13.38 17017.35 19.66
2002 12244 239 19.52 12.86 16465.94 19.52
2003 12119 191 15.75 12.41 15989.04 15.76
2004 11943 158 13.24 12.29 15928.76 13.23
2005 14550.462 186.497 12.82 12.40 16166.13 12.82
Unit: thousand people; ‰. Data source: China Population Statistic Yearbook (CPSY).
Figure 3. Comparison between the calculated zero-aged group mortality and IMR in the CPSY.
Measure, zero-aged group mortality is a Period Measure. There is a question: why is? Because the latter could be divided into two parts: infants who dies before one year old, and who are surviving; however, the number of zero-year old infants only includes those babies who are still alive. Additionally, according to CPSY, the number of zero-year old infants is much less than the number of births. This is because the latter includes both infants who have died before one year old and those who are still living, whereas the number of zero-year old infants only includes those babies who are still alive. Therefore, if we view zero-aged group mortality rate as the same as the IMR, the actual IMR is sure to be overestimated se- riously. Furthermore calculating the mortality of the
zero-aged group has little practical significance, whereas the IMR can be used to measure the medical and hygi- enic level of certain areas.
3.2.2. The Differences of Statistical Caliber between Different Departments
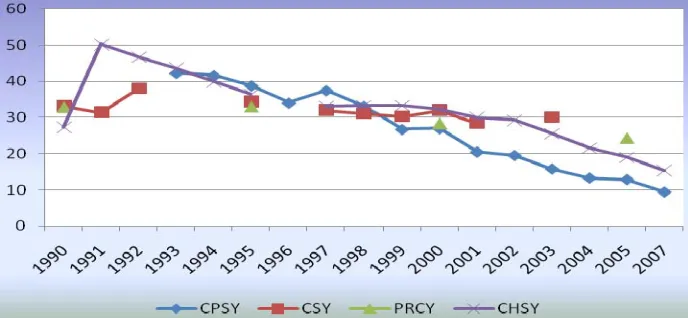
In order to show the differences of statistical caliber be- tween different departments, this paper compares the data from China Health Statistic Yearbook (CHSY) [7] with that from China Population Statistic Yearbook (CPSY), China Statistic Yearbook (CSY) [8] and The People’s Republic of China Yearbook (PRCY) [9]. Fig- ure 4 illustrates the comparison among four yearbooks.
[image:5.595.119.484.357.526.2]no similarities between the four different trends por- trayed. We can directly compare the four different IMRs from the four yearbooks for the years of 1995 and 2000: In 2000, China’s IMR in CPSY, CSY, PRCY and CHSY are 26.90‰, 32.0‰, 28.38‰ and 32.2‰. The number of infant deaths recorded in CHSY is higher than that of the CPSY by 94 thousand. But the value difference of IMR in 1995 is much larger than that in 2000. In the four yearbooks, the IMR in 1995 are 38.79‰, 34.40‰, 33.03‰ and 36.40‰ respectively. The biggest difference among the four values is 5.7‰. According to the huge popula-tion size and birth rate, we can calculate that 5.7‰ of the total births in 1995 is equivalent to 120 thousand infants. In other words, the number of infant deaths recorded in CPSY is more than that in PRCY with a difference of 120 thousand infants. Hence, it is worth exploring the cause of this difference.
It is worth mentioning that the data in China Statistics Yearbook and People’s Republic of China Yearbook are somewhat incomplete. Thus, below, the data in China Population Statistics Yearbook and China Health Statis- tics Yearbook will be used to explore the causes of dif- ferences of statistical caliber between different depart- ments.
In the data above, there are significant differences between CHSY and CPSY: in the years of 2000 and 2005; in CHSY, the IMR of the year of 2000 and 2005 are 32.2‰ and 19.0‰ respectively, however, these two numerical values in CPSY are 26.9‰ and 12.82‰ re- spectively. What causes these such differences?
The differences between each yearbooks definition of IMR needs to be considered. In the CHSY, the definition of IMR is: in one year, the ratio of the number of babies who are less than one year old to the number of living births at the same year. However, several questions about this definition can be raised:
1) The definition of “one year old” is manifold in
Chinese language. “One year old” could be defined as “one full year of life”, which means one having already had their first birthday. However, in Chinese rural areas, people are accustomed to use the “nominal age” to re- cord their true age. Thus, the baby is viewed as one year old while he or she is born. Therefore, these babies who have not been one full year old are regarded as one year old.
2) The definition of “one year” and “at the same year” is also not clear. Take the example of the data in the year of 2005. Infants who are not one full year old in 2005 should be separated into two individual parts groups: those who were born in 2005 and are not one full year old, and those who were born in 2004 and were not one full year old at the time of survey. But the term “at the same year” in the definition of IMR should be limited in the year of 2005. Otherwise, the inconsistency between the ranges of numerator and denominator and the subse- quent distortion of the correlation between the numerator and denominator leads to the inaccuracy of the calcula- tion of IMR.
3) “living births”: there is a specific definition to “liv- ing births” in CHSY that the newborns have one charac- teristic of heart beat, breath, umbilical pulse or voluntary muscle contractions, and the duration of the pregnancy for them is above 28 weeks.Because of the completeness of this definition, no linguistic ambiguities which may bring about statistical error can be found.
[image:6.595.125.469.542.701.2]Definition of the IMR in CPSY is the number of in- fants who have died before the reaching the age of one per one thousand living births every year. In this defini- tion, there is also a serious inconsistency between the ranges of the numerator and the denominator and thus a subsequent distortion of the correlation between the nu- merator and denominator. In addition, after analyzing the IMR and the zero-aged group mortality in the CPSY, the two concepts are found to be so similar that it is not pre-
Figure 4. Comparison of four different types yearbooks.
sumptuous to suspect that CPSY confuses the two con- cepts. Furthermore, CPSY does not define clearly the term “living births”. Thus definitions of “living births” in the between the two yearbooks may vary. If so, obvi- ously this difference in statistical caliber of each year- book will lead to different results for the calculated IMR.
3.2.3. The Inaccuracy of Birth and Death Registration
As a calculated index, the accuracy of IMR is utterly dependent on that of registration. On the one hand, in terms of the registration of living births, many research- ers wrongly assume that the calculation of number of births number is simple and guaranteed in accuracy. However, despite the conditions of the Family Planning Policy, the government’s stern enforcement of this and punishments for violations of the policy, having more than one child is still not uncommon. Many families manage to avoid the punishment for excess children by providing false materials at birth registration, delaying to provide materials needed for birth registration or even declining to provide materials needed for birth registra- tion; this ultimately leads to failure in registration of liv- ing births. This social phenomenon occurs more com- monly in developing areas than developed areas.
In modern society, ever more liberal views on sex and sexuality mean that living together when not legally mar- ried is much more common than before, pushing up the number of babies whose parents have not been married. However, many parents whose babies born outside of wedlock opt to shirk the registration, due to Chinese tra- ditional views on marriage and sex, and a lot of difficul- ties and awkwardness of registering babies born outside of wedlock. Additionally there are many babies aban- doned due to various congenital disabilities, who cannot be registered. Hence how to insure the accuracy of birth registration has is an urgent problem in need of being solved.
In terms of death registration, the severe grief brought about by an infant’s death often leads to families may forget register the death or simply not see the registration as important. Based on the relevant rules of birth Regis- tration, the newborn must be registered within one month after his or her birth. However, because the risk of death for a newborn is much higher within the first 28 days of the newborns life than the following 11 months, there is a strong probability that the newborn may die in the first month after his or her birth—perhaps before their birth has been registered.
Based on the positive analysis of IMR, the authors think the Equation (3) is the most suitable calculation method for Chinese IMR’s calculation. Firstly, the statis- tical data and information needed by Equation (3), like birth number and infant mortality number, can be col-
lected directly in census and sampling surveys. Secondly, in current situation, Chinese infant birth number and mortality number are stable every year, which provides an excellent environment for the use of Equation (3). In this condition, the empirical coefficient a can be esti- mated easily. Thirdly, the calculation method of Equa- tion (3) is totally different from the calculation method of zero-aged group mortality rate, which can help statisti- cian distinguish the two calculation methods, in order to avoid the confusion of the two methods. Finally but the most importantly, Equation (3) is comparatively more precise than Equation (1), which is widely used in most yearbooks of China now. As the authors prove before, Equation (3) divides the infant death number into two parts, and this division is more adapted to the reality.
To obtain the unifying and accurate IMR in the whole China, the writers put forward the following improve- ments:
First, perfect the definition of Infant Mortality Rate. In this definition, the country should make the specific definition about “Infant”, “the death time” and some other jargons. And the definition should be widely used in all the statistical departments, including State Statis- tics Bureau of China, National Family Planning Com- mission and so on.
Second, form the standardized statistical indices sys- tem and unify statistical caliber. The difference of statis- tical calibers of one index in different sampling surveys seriously exerts negative influence on the validity of the calculation of those indices. On one hand, the difference of statistical calibers leads to the distinction of the ranges of statistical object, which will results in the difference of data recorded in different yearbooks; on the other hand, the non-uniform of statistical indices system among yearbooks makes that only one yearbook is not enough to measure and describe the birth, mortality and migration level of a district. For example, CHSY does not record infant mortality number in every year, which causes inconvenience for the calculation of IMR. The statistical departments should define and unify the statis- tical indices system and ranges of those accepted indices, in order to make sure that statistical objects in censuses and sampling surveys are the same.
not only mutual coordination, but also mutual check is needed, in order to avoid the distortion of statistic data resulted from the negligence of each department. All departments should check the statistic data for each other regularly, especially establish mutual audit system in censuses, so that guarantee quality of population data.
4. Conclusions
As a significant index to judge the health level and also indirectly reflect the economic development level of a country or a district, the precision of IMR is undoubtedly crucial. However, this index is somewhat overestimated in China Health Statistic Yearbook and China Population Statistic Yearbook. The certainty of the numerator is much easier to guarantee, which means the certainty of the number of babies each year who have died before reaching the age of one year old is also easier to guaran- tee. In contrast, the certainty of the denominator is much more difficult to guarantee. This difficulty is due to the fact that the numbers of infants who die before reaching the age of one per year is divided into two categories: infants who were born in the last year, and, infants born in the current year. Therefore, this difference between the statistical range of the numerator and that of the de- nominator is a problem.
In addition, the different calculations used in different yearbooks and the different statistical ranges or calibers may lead different yearbooks using different data and producing different data results. The numerical value of IMR in CPSY, which is written by National Bureau of Statistics, differs greatly from that in CHSY, which is written by National Health Ministry. Hence, one can not help but ask the question: which one is the true IMR? Besides the calculation of IMR itself, are calculations of other also distorting the IMR calculation result? Not all citizens can check the validity of data recorded in year- books or other statistical information. The fear of the high level of IMR may mislead citizens—especially women of child-bearing age, to the extent that they are afraid of pregnancy and birth.
The government needs to perfect the birth and death registration system to assure the accuracy of statistical data. For example, in comparatively needy districts,
many citizens have not yet formed the habit of register- ing births and deaths, therefore governments need to propagate the importance of registration in order to im- prove the accuracy of statistics. Furthermore, apart from birth and death registration, perhaps many other registra- tion systems in China, such as marriage registration and migration registration, need to also be perfected further. According to the understanding of this researcher, in many traditional rural districts, a couple who has not registered for marriage can still get the approval of the inhabitants of their village as long as they have treated to their wedding banquet - despite the fact that their mar- riage is not legal under Chinese laws. This is due to the fact that many citizens in such rural areas simply no concept of registering their marriage at a civil admini- stration branch.
5. References
[1] S. Luo and Y. Wang, “Chinese Infant Mortality Rate during 1998 to 2003 and Relevant Factors Analysis,”
Maternal and Child Health Care of China, Vol. 21, No. 13, 2006, pp. 1841-1845
[2] X. Feng and X. Gu, “Chinese Infant Mortality Rate Ana- lysis,” Chinese Health Statistic, Vol. 8, No. 1, 1991, pp. 36-38
[3] Z. Liu, C. Wu and R. Zha, “Demography,” Renmin Univer- sity of China Press, Beijing, 1980, pp. 94-105, 200-212.
[4] S. Weng and S. Wang, “Chinese Infant Mortality Rate Changes Analysis,” Chinese Population Science, No. 3, 1992, pp. 23-26.
[5] J. Jiang, “Infant Mortality Analysis in Xi Cheng District from 1950 to 2004,” Chinese Health Statistic, Vol. 25, No. 3, 2008, p. 335.
[6] The Population and the Employment Statistics Division, “China Population Statistic Yearbook,” National Bureau of Statistics of China, 1994-2006.
[7] Ministry of Health of the People’s Republic of China “China Health Statistic Yearbook,” 1994-2006.
[8] National Bureau of Statistics of China, “China Statistic Yearbook,”1994-2006.