www.wjpr.net Vol 7, Issue 2, 2018. 645
DEVELOPMENT AND VALIDATION OF STABILITY INDICATING
HPTLC METHOD FOR ALBENDAZOLE
Amrapali M. Pawar* and Prof. Dr. Sunil K. Mahajan
Department of Pharmaceutical Chemistry, M.G.V’s Pharmacy College, Panchavati,
Nasik-422200, India.
ABSTRACT
Albendazole belongs to the benzimidazole class of Anthelmintic. The
present study describes degradation of Albendazole under ICH [Q1A
(R2)] prescribed stress conditions (hydrolysis, oxidation, dry heat, wet
heat and photolysis) and establishment of a stability-indicating HPTLC
method. Different degradation products were observed for Albendazole
when each was exposed to different stress conditions. For HPTLC,
aluminium plate precoated with Silica Gel 60 F254 and mobile phase
consisting of toluene: methanol: ammonia 8: 2: 0.5 v/v/v was used to
achieve separation. Quantitation was done at 244 nm. The retention
factor for albendazole is 0.41. The method exhibited good linearity
(r2>0.998) over the studied range of 200-700 ng/band. The method
was validated as per ICH Q2 R1 guidelines and results were in limit. This method was found
to be simple, specific, precise and stability indicating.
KEYWORDS: Albendazole, HPTLC, Stability Indicating Method, Validation.
INTRODUCTION
Albendazole is chemically named as Methyl
[5-(propylthio)-1H-benzoimidazole-2-yl]carbamate with molecular formula C12H15N3O2S.[13] It retains the broad spectrum activity
and excellent tolerability of its predecessor. Albendazole causes degenerative alteration in the
tegument and intestinal cells of the worm by binding to the colchicines-sensitive site of
tubulin, thus inhibiting its polymerization or assembly into microtubules.[1]
Various UV and HPLC assay methods are also reported in the literature for the estimation of
Albendazole individually and in-combination with other drugs Stability indicating RP-HPLC
Volume 7, Issue 2, 645-656. Research Article ISSN 2277– 7105
Article Received on 21 Nov. 2017,
Revised on 12 Dec. 2017, Accepted on 02 Jan. 2018
DOI: 10.20959/wjpr20182-10615
8533
*Corresponding Author
Amrapali M. Pawar
Department of
Pharmaceutical Chemistry,
M.G.V’s Pharmacy College,
Panchavati, Nasik-422200,
www.wjpr.net Vol 7, Issue 2, 2018. 646 method,[2,3] Development and validation UV method,[4-7] Rapid quantitative assay by UHPLC,[8] HPLC method.[9,10] According to literature survey there is no official method for the Forced Degradation Studies of Albendazole by HPTLC in tablet dosage form. Hence, an
attempt has been made to develop new method for Forced Degradation study of Albendazole
[image:2.595.176.426.192.254.2]in accordance with the ICH guidelines.
Fig. 1: Structure of Albendazole.[13]
The drug stability test guidelines Q1A (R2) issued by International Conference on
Harmonization (ICH) requires that analytical test procedures for stability samples should be
fully validated and the assay should be stability indicating. The aim of the present study
accordingly was to establish inherent stability of the albendazole through stress studies under
a variety of ICH recommended test conditions[11] and its validation.[12]
MATERIALS AND METHODS
For stability indicating HPTLC method development, Camag HPTLC system consisting of
Linomat-5 applicator, Camag TLC Scanner 3 and Win CATS software V 1.4.2.8121 were
used. For photo-degradation studies, UV Chamber was used Thermal degradation studies,
Hot air oven was used. All the weighing was done on Shimadzu balance (Model
AUW-120D).
Working standard of Albendazole was provided by Glaxo smithklin pharmaceutical Ltd and
used as such without further purification. Methanol HPLC grade, Toluene, ammonia, Conc.
HCl, Na OH and H2O2, H2O used were of analytical reagent grade. Marketed formulation of
albendazole was purchased from local market.
Preparation of Standard Solutions
Standard stock solution of albendazole was prepared by dissolving 10 mg of drug in 10 ml of
www.wjpr.net Vol 7, Issue 2, 2018. 647 Stress Degradation Studies
Stress degradation studies were carried under condition of acid/ base/ neutral hydrolysis,
oxidation, dry heat and photolysis. For each study, two samples were prepared: the blank
subjected to stress in the same manner as the drug solution and working standard solution
subjected to stress conditions. Dry heat and photolytic degradation was carried out in solid
state.
Degradation under Alkali Catalysed Hydrolytic Condition
Working standard solution, 1ml was mixed with 1ml of 0.01N Na OH and reflux at 600C for
15 min. Cool at RT and neutralized. The solution was spotted on TLC plate using applicator.
Degradation under Acid Catalysed Hydrolytic Condition
Working standard solution, 1ml was mixed with 1ml of 0.01N HCL and reflux at 600C for 15 min. Cool at RT and neutralized. The solution was spotted on TLC plate using applicator.
Degradation under Neutral Hydrolytic Condition
Working standard solution, 1ml was mixed with 1ml water. The solution was refluxed at
600C for 15 min. The solution was cooled to room temperature. Volume was made to 10ml.
The solution was spotted on TLC plate using applicator.
Degradation under Oxidative Condition
Working standard solution, 1ml was mixed with 1ml 3% solution of H2O2 and kept for 15
min at RT then the solution was spotted on TLC plate using applicator.
Degradation under Dry Heat
Dry heat studies were performed by keeping drug sample in oven (800C) for a period of 2 hrs. Samples was withdrawn, dissolved in methanolic glacial acetic acid and diluted to get
100μg/ml as final conc. of the solution was spotted.
Photo-Degradation Studies
Photolytic studies were also carried out by exposure of drug to UV light for 24 hrs. Sample
www.wjpr.net Vol 7, Issue 2, 2018. 648 Analytical Method Validation
1. Linearity and Range
Linearity was found for ABZ by using standard stock solution 100 µg /ml. To establish
linearity, the stock solution was applied on the plate using 100 µl syringe with the help of
Linomat V applicator, to give spots of concentrations 200-700 ng/spot for Albendazole.
Application volume 0.2, 0.3, 0.4, 0.5, 0.6, 0.7 was applied on plate using Linomat 5 to obtain
concentrations 200, 300, 400, 500, 600,700ng/spot. Plate was developed according to
proposed method. After the development, plate was scanned at 244 nm and results obtained
are shown in Table No.1 and calibration plot obtained was shown in Fig. No.3
2. Precision
Precision of the method was studied as intra – day and inter – day variations. Intra -day
variation was determined by analyzing three different concentrations for three times within a
day and Inter- day precision was assessed by three different concentrations for three different
days, over a period of week. The Intra-day and Inter-day variation was measured at three
different concentrations 200, 400, 600, ng/ band. Intraday and interday precision assures the
repeatability of test results. The % RSD found was below 2. Result of intraday and interday
precision was shown in Table No. 4 and Table No. 5 respectively.
3. Accuracy
To check the accuracy of the method, recovery studies were carried out by addition of
standard drug solution to pre-analyzed tablet sample solution at three different levels, 80%,
100% and 120%. At each levels of the amount, three determinations were performed. Results
of recovery study are shown in Table No. 6 and statistical validation is shown in Table No. 7.
Assay (Preparation of Sample Solution)
Twenty tablets of Hizole were weighed accurately and finely powdered. Powder equivalent to
10 mg of ABZ was transferred to 10 ml volumetric flask. This was sonicated with Methanolic
GAA for 5mins and the volume was made up to 10 ml with the same solvent. Resulting
solution (1ml) was further diluted to 10 ml with the same solvent to give 100µg/ml. Line
equation obtained from calibration plot was used to calculate label claim of marketed
www.wjpr.net Vol 7, Issue 2, 2018. 649 4. Limit of Detection
The detection limit of an individual analytical procedure is the lowest amount of analyte in a
sample, which can be detected but not necessarily quantitated as an exact value. Based on the
Standard Deviation of the response and the slope, detection limit (DL) may be expressed as
DL = 3.3 σ S.
5. Limit of Quantitation
The quantitation limit of an individual analytical procedure is the lowest amount of analyte in
a sample, which can be quantitatively determined with suitable precision and accuracy. Based
on the Standard Deviation of the response and the slope, the quantitation limit (QL) may be
expressed as
QL = 10 σ S Where,
σ = the standard deviation of the response for the lowest conc. in the range
S = the slope of the calibration curve
6. Specificity
For the determination of interference of excipients, Magnesium stearate were added in
concentration 300 ng to each standard stock solution of ABZ and then assayed by proposed
method and it was found that the assay results were unaffected by the presence of such
excipients. Results of specificity are shown in Table No. 9
7. Robustness
In the robustness study, the influence of small, variations in the analytical parameters on peak
area were examined. Robustness was studied by different deliberate variations. In the
chromatographic conditions like saturation time does not make any significant change.
Results are shown in Table No.8
RESULTS AND DISCUSSION
Optimization of Mobile Phase
Chromatographic separation studies were carried out on the working standard solution of
albendazole (100μg/ml). Initially, trials were carried out using various solvents. After several
trials, toluene: methanol: ammonia 8: 2: 0.5 v/v/v was chosen as the mobile phase, for
HPTLC, which resulted in good resolution and acceptable peak parameters. The retention
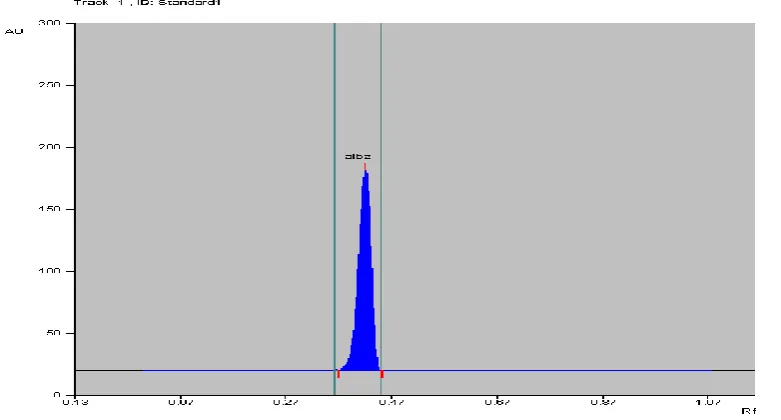
www.wjpr.net Vol 7, Issue 2, 2018. 650 Fig. 2: Typical Densitogram of Albendazole (Rf =0.41).
[image:6.595.143.454.346.609.2]
Table 1: Data for Linearity of Albendazole.
Sr. No. Conc. (µg/mL) Area
1 200 2792.63
2 300 3725.48
3 400 4553.2
4 500 5365.92
5 600 6137.88
6 700 6921.4
Fig. 3: Calibration Curve of Albendazole.
Table 2: Data for Tablet Analysis (Assay) of ABZ.
Sr. no. Brand name Conc. (ng/band)
Label claim (mg)
Amount found (mg)
% amount recovered 1
Hizole
400 400 403.6 100
2 400 400 401 100.2
www.wjpr.net Vol 7, Issue 2, 2018. 651 Table 3: Statistical Validation of Tablet Analysis.
Mean* SD %RSD SE
101% 42.85945 0.941982 24.74564
*Average of three determinations
Table 4: Data for Intraday Precision of ABZ.
Conc. (ng/band) Mean* SD % RSD SE
200 2752.62 26.91 0.997 15.54
400 4635.87 71.63 1.54 41.35
600 6410.07 79.99 1.24 46.18
[image:7.595.62.531.41.623.2]
Table 5: Data for Interday Precision of ABZ.
Conc. (ng/band) Mean* SD % RSD SE
200 2788.63 35.79 1.28 3.58
400 4608.45 21.09 0.45 2.16
600 6329.45 8.80 0.13 1.57
Table 6: Data for Recovery (Accuracy) Study of ABZ.
Level of addition Tablet drug conc. (ng/band) Standard drug added (ng/band) Total conc.(ng/band) Drug recovered (ng/band) % Recovery 80%
300 240 540 540.92 100
300 240 540 537.27 99
300 240 540 536.33 99
100%
300 300 600 595.78 99
300 300 600 598.28 99.71
300 300 600 617.17 102.8
120%
300 360 660 682.89 103
300 360 660 679.37 102.93
300 360 660 682.35 103
Table 7: Statistical Validation of ABZ.
Level of addition % Mean recovery SD % RSD SE
80% 99.33 19.87368 0.35244 0.1147441
100% 100.50 95.85837 1.552013 55.34548
120% 102.97 15.54357 0.208106 8.974349
www.wjpr.net Vol 7, Issue 2, 2018. 652 Table 8: Data for Robustness Study of ABZ.
Conc. (ng/band) Time (minutes) Mean* SD % RSD SE
200 30 2996.71 31.15 1.03 17.98
35 2834.25 14.27 0.50 8.24
400 30 4969.60 15.74 0.31 9.08
35 4829.91 23.24 0.48 13.42
600 30 6726.03 87.06 1.29 50.26
35 6418.56 65.96 1.02 38.08
*Average of three determinations
Table 9: Data for Specificity Study of ABZ.
Level of addition
Standard (ng/band)
Magnesium stearate (ng/band)
Mean
Area* SD
%
RSD SE
80%
300 240
3743.56 49.15 1.31 28.38
300 240
300 240
100%
300 300
3644.93 3.589 0.098 2.07
300 300
300 300
120%
300 360
3651.73 44.95 1.23 25.95
300 360
300 360
Stress Degradation Studies
Hydrolysis at Basic pH
Albendazole 89.13% was recovered with peak of degradation (Fig. No. 3)
Hydrolysis at Acidic pH
[image:8.595.120.464.587.740.2]Albendazole 90.71% was recovered with peak of degradation (Fig. No. 4)
www.wjpr.net Vol 7, Issue 2, 2018. 653 Fig. 5: Degradation Peak of Albendazole in Acid.
Under Neutral Hydrolysis
Albenadzole 87.97% was recovered with peak of degradation (Fig.No.5).
After Oxidative Condition
[image:9.595.155.437.393.540.2]Albendazole 90.49% was recovered with peak of degradation (Fig.No.6).
Fig. 6: Degradation Peak of Albendazole under H2O.
[image:9.595.156.435.584.741.2]www.wjpr.net Vol 7, Issue 2, 2018. 654 After the Dry Heat
[image:10.595.139.458.130.298.2]Degradation was observed for albendazole with 94.99% recovery
Fig. 8: Degradation Peak of Albendazole under Heat.
After the Photo Degradation
Degradation was observed for Albendazole with 94.05% recovery
Fig. 9: Degardation Peak of Albendazole under UV Light.
Literature survey revealed that no stability indicating HTPLC method has been reported for
the determination of albendazole. Stress degradation studies were carried out under condition
of acid/ base/ neutral hydrolysis, oxidation, dry heat and photolysis. For acidic and basic
hydrolysis various normalities was tried. The exposure to 0.01 N HCL at 600C for 15 min and 0.01N NaOH at 600C for 15 min was optimized condition for degradation. Since it resulted in % degradation not more than 20%.For neutral hydrolysis, oxidation, dry heat and photolysis
[image:10.595.127.464.399.559.2]www.wjpr.net Vol 7, Issue 2, 2018. 655 degradation of active compound.Stress degradation results are summarized in Table No.10 &
[image:11.595.45.555.141.349.2]results of method validation are given in Table No.11
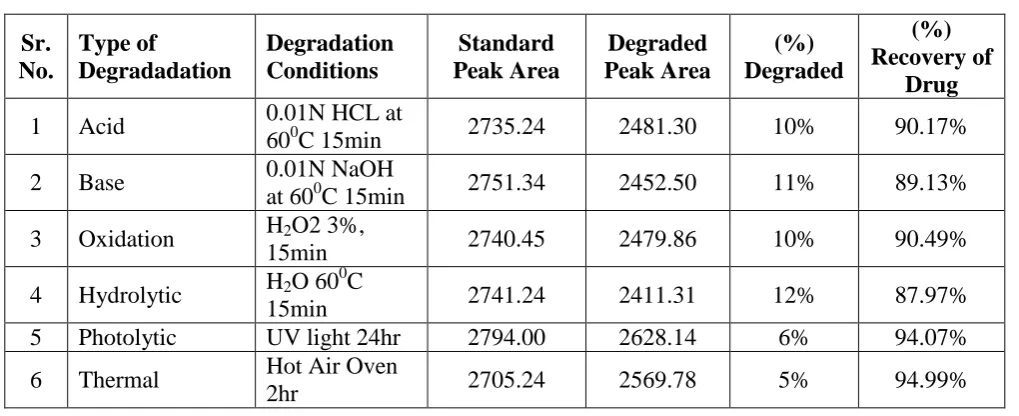
Table 10: Summary of Stress Degradation of Albendazole.
Sr. No. Type of Degradadation Degradation Conditions Standard Peak Area Degraded Peak Area (%) Degraded (%) Recovery of Drug
1 Acid 0.01N HCL at
600C 15min 2735.24 2481.30 10% 90.17%
2 Base 0.01N NaOH
at 600C 15min 2751.34 2452.50 11% 89.13%
3 Oxidation H2O2 3%,
15min 2740.45 2479.86 10% 90.49%
4 Hydrolytic H2O 60
0
C
15min 2741.24 2411.31 12% 87.97%
5 Photolytic UV light 24hr 2794.00 2628.14 6% 94.07%
6 Thermal Hot Air Oven
2hr 2705.24 2569.78 5% 94.99%
Table 11: Summary of Validation Study for Albendazole.
Sr. No. Parameters High performance thin layer
chromatography method
1 λmax (nm) 244
2 Beer's law limit (ng/band) 200-700
3 Regression equation [y] Y=8.198x + 1226.
4 Slope [m] 8.198
5 Intercept [c] 1226.
6 Correlation coefficient [r2] 0.998
7 Limit of detection (LOD) (ng/band) 48.54
8 Limit of quantitation (LOQ) (ng/band) 147.10
*RSD: Relative standard deviation, † LOD: Limit of detection, ‡ LOQ: Limit of
Quantitation.
CONCLUSION
The degradation conditions mentioned above were arrived at, after number of initial trials for
optimization of extent of degradation. Overall study comprised of stability indicating method
development for Albendazole. This method can be used for stability testing of this drug in
dosage forms. The developed method was found to be simple, sensitive and selective,
accurate, precise, and repeatable for analysis of albendazole in market formulation without
any interference from the excipients. Finally it was concluded that the method is sensitive,
www.wjpr.net Vol 7, Issue 2, 2018. 656 REFERENCES
1. K. D. Tripathi, Essential of Medical Pharmacology, sixth edition by Jaypee Brothers
Medical Publishers (P) LTD, 810.
2. Renuka jajikore, ET. Al. Stability Indicating Rp-Hplc Method Development And
Validation For The Simulataneous Estimation Of Pyrantel Pamoate And Albendazole In
Bulk And Its Tablet Dosage Form, International Journal Of Pharmacy, 2015; 5(2).
3. Patel Asmita K. ET. Al. Development and Validation of Stability Indicating RP-HPLC
Method for Estimation of Ivermectin and Albendazole in Pharmaceutical Dosage Form,
Indian Journal of Drugs, 2015; 3(3).
4. Sandhya B. Lahane Development and Validated Uv Spectrophotometric Method For
Estimation Of Albendazole In Tablet Dosage Form, World Journal Of Pharmaceutical
Research, 2014.
5. Vipin K. Agrawal, ET. Al Simple and Precise UV Spectrophotometric Method
Development for Estimation of Albendazole for Dissolution Study, International Journal
Of Pharmaceutical Sciences And drug Research, 2015.
6. Sajid Mahmood, ET. al., Method Development and Validation for the Estimation of
Anthelmintic Drug (Albendazole) in Tablet Preparations, IJPSR, 2015.
7. Nagaraju Swamy, et.al. Analytical Utility of Potassium Permanganate for the Assay of
Albendazole in Bulk Drug and Pharmaceuticals, Journal of Reports of Pharmaceutical
Science, 2015.
8. Nagaraju Swamy, et. al., Rapid Quantitative Assay of Albendazole in Bulk Drug and
Pharmaceuticals by UHPLC, Chemical Sciences Journal, 2013.
9. Z. Khalil, et.al. HPLC Method for Simultaneous Determination of Albenadzole
Metabolites in Plasma, Journal of Chemical and Pharmaceutical Research, 2014; 6(11).
10.M. S. Pathak, et. al., Development And Validation Of A High Performance Liquid
Chromatography Method For The Simultaneous Quantification Of Albendazole And
Closantel From Veterinary Formulation, International Journal Of Research In Pharmacy
And Chemistry, 2014.
11.ICH, Q1A (R2): Stability Testing of New Drug Substances and Products, International
Conference on Harmonization, Geneva, 2003.
12. ICH, Q2 (R1): Validation of Analytical procedure: Text and Methodology, International
Conference on Harmonization, Geneva, 2005.
13.Indian pharmacopoeia published by the indian pharmacopoeia commision Ghaziabad,
![Fig. 1: Structure of Albendazole.[13]](https://thumb-us.123doks.com/thumbv2/123dok_us/850199.595701/2.595.176.426.192.254/fig-structure-of-albendazole.webp)