Process Parameter Optimization of WEDM
Machining Ondie Steel-D3 for Curved Shape Cut
Using Regression Modeling Analysis
Siddharth Sharma1, Anil kumar Sharma21, 2
JIT, Jaipur.
Abstract: WEDM is the non conventional machining process to cut the work piece in high precis manner. In present study D3 Die material is used as work material and process parameters of WEDM are selected and experimentally investigated for selective response. In present research study four process parameters having each three levels, the process parameters are following: Ton, Toff, current and wire feed. The experiment tables are generate using Taguchi Method separately for both materials. In this research work three response parameters cutting time, material removal rate and surface roughness are selected. Signal to noise ratio analysis, analysis of variance and multi objective optimization is performed using stats software Mini-tab
Keywords: WEDM, TAGUCHI, ANOVA.
I. INTRODUCTION
Wire Electrical Discharge machining (WEDM) is a specialized thermal machining process capable of accurately machining parts of hard materials with complex shapes. WEDM has evolved as a simple means of making tools and dies to the best alternative of producing micro-scale parts with the highest degree of dimensional accuracy and surface finish. Copper wire is used in various applications which require very high tensile strength to provide a reasonable load carrying capacity in small diameter wire. The effect of process parameters on the material removal rate (MRR) and surface roughness is to be investigated experimentally in wire EDM. As the process depends of different parameters it is very tedious task to analyze the effectiveness of all the parameter for the process. So, different techniques are used to analyze the parameters for better utilization of the process. A Taguchi’s standard orthogonal array is chosen for the design of experiments. Signal to noise ratio analysis, analysis of variance and multi objective optimization is performed using stats software Mini-tab
II. LITERATURE REVIEW
Wanga (01, 2018) did an experimental investigation to change of micro-WEDM to accomplish the exact creation of micro rigging with unblemished tooth profile, in particular right off the bat holding a sharp corner on the apparatus teeth where the preparing deformity exists and after that evacuating it continuously handling of micro-WEDM process. The static contact between the center dance of the installation and the micro apparatus with sharp corner is hypothetically researched utilizing ABAQUS software and experimentally turned out to be in great condition on X153CrMoV12 work piece material. The attainability of procedure were confirm and repeatability of the proposed methodology, five micro apparatuses with 10 gear number, 0.1 mm module and 2 mm
tooth width were machined utilizing 50 μm distance across wire terminal, showing phenomenal similarity, machining blunder with
under 1.5 μm and surface roughness with 0.9 μm.[1] Dabade et al. (02, 2016) completed an experimental work to break down the
impact of machining parameters on MRR, Ra, Kerf and dimensional deviation amid machining on WEDM process. Inconel 718 super compound material was utilized for experiment reason. From the watched information, it was inferred that beat on time was the most noteworthy factor for MRR, SR, Kerf and Dimensional deviation.[2] Krishnan (03, 2017) introduced the work which was centered around machining of titanium combination by vibrating the wire a sidelong way with the fluctuated recurrence of
excitation to improve the material expulsion rate and to acquire the basic kerf width in Wire Electrical Discharge Machining
(WEDM) process. The examination was done on the WEDM procedure of Ti-6Al-4V with cutting wire being energized parallel way by utilizing a mechanical shaker. Surface uprightness, roughness and material expulsion rate were investigated on machined
surface. It was uncovering that a low recurrence of 100 Hz has brought about improved MRR. The white layer shaped at a
Gong et al. (04, 2016) displayed the Breakdown Voltage (BV) conduct in low speed WEDM procedure of Ti-6Al-4V material in deionized water. It was discovered that real BV is approx. 320V, however from the experiment diverse outcomes were gotten. From the experimental outcomes, it very well may be presumed that the release hole must have various air pockets and flotsam and jetsam that assumed a critical job in voltage conduct. [4]
III. EXPERIMENTALWORK
The input parameters for present study is chosen from previous literature which is discussed in chapter 2, but machine factors are also consider in this research study. Simple half circular cut is chosen for cut using WIRE EDM machine. All technical specifications of machine with limitations is considered in this chapter. Machine which is used for this study is Maxicut–e WEDM (see figure 3.1). EN-08 and Die steel D3 are chosen for experiment using WEDM machining. The machine is installed in CIPET, Jaipur. This study is based on design of experiment (DOE) method named Taguchi method. The important performance measures in WEDM are metal removal rate (MRR), cutting time and surface roughness. In WEDM operations, MRR determines the economics of machining and rate of production whereas surface roughness denotes degree of precision and dimensional accuracy.
Factor And Their Levels For Orthogonal Array
Factor Symbol Unit L-I L-II L-III
Ton A Micro sec 2 3 4
Toff B Micro sec 9 8 7
Wire Feed C Mm/sec 6 6.5 7
Current D A 6.5 7 7.5
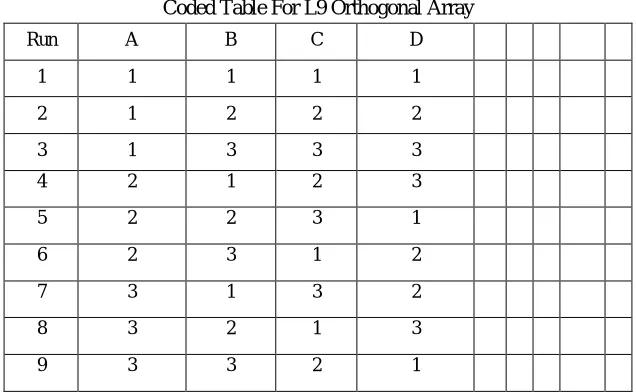
[image:2.612.147.465.532.728.2]Each three level parameter has two degree of freedom (DOF) (number of levels – 1), the total DOF required for four variables each at three levels is8(i.e.) 4× (3–1). As per Taguchi’s method the total DOF of selected OA must be greater than or equal to the total DOF required for the experiment (Roy,2001). So an L9 OA (a standard three-level OA) having 8 DOF was selected for the present analysis (Table 4.2). The typical L9 orthogonal array layout with factors is shown in Table 4.3.
Table 4.2
Coded Table For L9 Orthogonal Array
Run A B C D
1 1 1 1 1
2 1 2 2 2
3 1 3 3 3
4 2 1 2 3
5 2 2 3 1
6 2 3 1 2
7 3 1 3 2
8 3 2 1 3
Real Values For L9 Orthogonal Array
Run Ton Toff WF Current
1 2 9 6 6.5
2 2 8 6.5 7
3 2 7 7 7.5
4 3 9 6.5 7.5
5 3 8 7 6.5
6 3 7 6 7
7 4 9 7 7
8 4 8 6 7.5
9 4 7 6.5 6.5
In present chapter theory of design of experiment and its application of DOE in present thesis is present. In present research study Taguchi method is used for generating the experiments runs which is called as Orthogonal Array.
IV. RESULTANDDISCUSSION
The present research work is the experimental analysis of process parameters of wire EDM machining on two different type of Steels (Die Steel-D3 and EN-08) for three type of responses (cutting time, material removal rate and surface roughness). All experiment table are generated by taguchi method and the factor and levels are present in table 5.1 for both materials
Output Results For D3 Work Piece
RUN Ton Toff WF Current Cutting Time MRR Ra
μsec μsec Inch/sec A sec gm/min μ-m
1 2 9 6 6.5 1301 0.626 2.56
2 2 8 6.5 7 1362 0.601 3.66
3 2 7 7 7.5 1511 0.470 2.76
4 3 9 6.5 7.5 1217 0.558 2.55
5 3 8 7 6.5 1148 0.598 3.74
6 3 7 6 7 1120 0.635 3.48
7 4 9 7 7 1251 0.637 2.85
8 4 8 6 7.5 909 0.906 3.67
9 4 7 6.5 6.5 1327 0.590 3.91
In this section first of all the relation of factor and response are present in plot view and then the results are analysis using taguchi Signal to Noise ratio analysis (S/N ratio which is discussed in previous chapter 4)
A. Experimental Results of AISI D3 DIE Steel
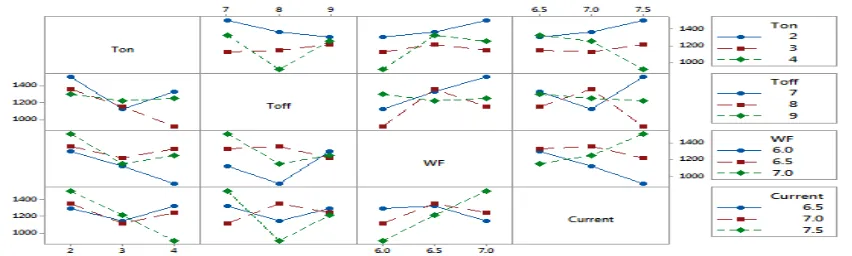
[image:3.612.94.520.584.712.2]In present section interaction plots among factors and response variables are present for test pieces D3 tool steel and the figure are present here from figure 5.1 to figure 5.3 for full interaction plots for response variable CT, MRR and surface roughness
Fig 5.2 Interaction plot for material removal rate (MRR) for Die steel-D3
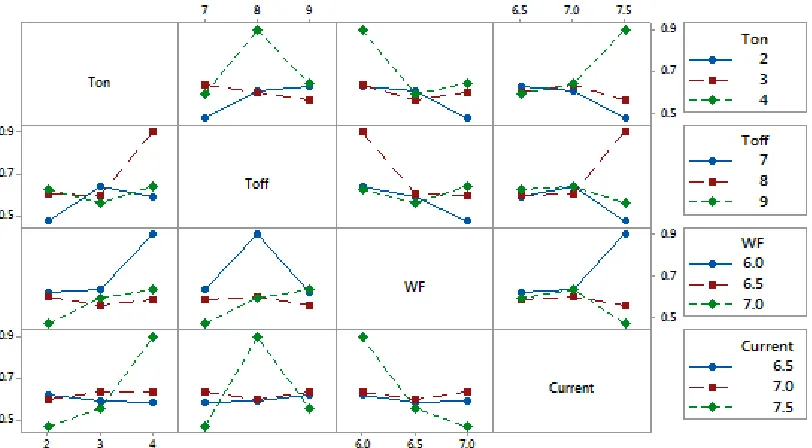
Fig 5.3 Interaction plot for Surface Roughness (Ra) for Die steel-D3
B. Analysis of Experimental Results Using Taguchi Method for AISI D3 DIE Steel
In previous chapter theory background of signal to noise ratio is discussed and in this chapter the analysis using S/N ratio is present for D3 steel test pieces and the individual S/N ratio is present in table 5.4 for CT response variable for D3 steel
S/N Ratio (Smaller Is Better) For Ct For D3 Steel
Run Ton Toff WF Current Cutting Time
S/N ratio
μsec μsec Inch/sec A sec
1 2 9 6 6.5 1301 -62.2855
2 2 8 6.5 7 1362 -62.6835
3 2 7 7 7.5 1511 -63.5853
4 3 9 6.5 7.5 1217 -61.7058
5 3 8 7 6.5 1148 -61.1988
6 3 7 6 7 1120 -60.9844
7 4 9 7 7 1251 -61.9451
8 4 8 6 7.5 909 -59.1713
“smaller is better” option is selected for this response variable and the rank identified using this S/N ratio analysis is present in table 5.5 and figure 5.4 for D3 steel work piece and response variable CT. The best ranked factor among all factors are Pulse on time whereas least ranked factor is current applied to WEDM machine.
Like cutting time, S/N ratio is calculated for MRR also using “larger is better”option. The results are present n table 5.6 for MRR S/N ratio results. The rank identification for this response variable is present in table 5.7 and figure 5.5. The results for MRR is that the best ranked factor is wire feed and least ranked factor is current
S/N Ratio (Larger Is Better) For Mrr For D3 Steel
Run Ton Toff WF Current Cutting Time S/N ratio
1 2 9 6 6.5 0.626 -4.06851
2 2 8 6.5 7 0.601 -4.42251
3 2 7 7 7.5 0.470 -6.55804
4 3 9 6.5 7.5 0.558 -5.06732
5 3 8 7 6.5 0.598 -4.46598
6 3 7 6 7 0.635 -3.94453
7 4 9 7 7 0.637 -3.91721
8 4 8 6 7.5 0.906 -0.85744
9 4 7 6.5 6.5 0.590 -4.58296
Like MRR, S/N ratio is calculated for surface roughness (Ra) also using “smaller is better”option. The results are present in table 5.8 for RA S/N ratio results. The rank identification for this response variable is present in table 5.9 and figure 5.6.
S/N Ratio (Smaller Is Better) For Ra For D3 Steel
Run Ton Toff WF Current Cutting Time
S/N ratio
1 2 9 6 6.5 2.56 -8.1648
2 2 8 6.5 7 3.66 -11.2696
3 2 7 7 7.5 2.76 -8.8182
4 3 9 6.5 7.5 2.55 -8.1308
5 3 8 7 6.5 3.74 -11.4574
6 3 7 6 7 3.48 -10.8316
7 4 9 7 7 2.85 -9.0969
8 4 8 6 7.5 3.67 -11.2933
9 4 7 6.5 6.5 3.91 -11.8435
C. Regression Modeling analysis of AISI D3 DIE Steel
Residual Error Comparison Among Linear And Non Linear Equations For Ct
Run
Ton Toff WF Current Cutting Time
Residual-Linear
Residual-Non Linear
μsec μsec Inch/sec A sec
1 2 9 6 6.5 1301 53.056 45.125
2 2 8 6.5 7 1362 9.056 -2.209
3 2 7 7 7.5 1511 53.056 30.838
4 3 9 6.5 7.5 1217 33.222 47.404
5 3 8 7 6.5 1148 -210.278 -185.605
6 3 7 6 7 1120 -53.278 -40.651
7 4 9 7 7 1251 61.889 71.220
8 4 8 6 7.5 909 -95.111 -115.743
9 4 7 6.5 6.5 1327 148.389 148.049
1) Linear Equation: CT=902-114.5Ton-31.5Toff+193WF-46Current 2) Non Linear Equation: CT=684.25Ton-0.227*Toff-0.206*WF-0.960*Current-0.249
Residual Error Comparison Among Linear And Non Linear Equations For Mrr
Run
Ton Toff WF Current MRR
Residual-Linear
Residual-Non Linear
μsec μsec Inch/sec A gm/min
1 2 9 6 6.5 0.626 -0.003889 -0.004073
2 2 8 6.5 7 0.601 0.049111 0.059196
3 2 7 7 7.5 0.470 -0.003889 0.002793
4 3 9 6.5 7.5 0.558 -0.107556 -0.111089
5 3 8 7 6.5 0.598 0.070444 0.065069
6 3 7 6 7 0.635 -0.045556 -0.050455
7 4 9 7 7 0.637 -0.004222 0.004124
8 4 8 6 7.5 0.906 0.111778 0.089312
9 4 7 6.5 6.5 0.590 -0.066222 -0.050272
Residual Error Comparison Among Linear And Non Linear Equations For Ra
Run Ton Toff WF Current Ra
Residual-Linear
Residual-Non Linear
μsec μsec Inch/sec A μ-m
1 2 9 6 6.5 2.56 -0.340556 -0.360526
2 2 8 6.5 7 3.66 0.659444 0.688265
3 2 7 7 7.5 2.76 -0.340556 -0.317966
4 3 9 6.5 7.5 2.55 -0.122222 -0.233461
5 3 8 7 6.5 3.74 0.352778 0.362075
6 3 7 6 7 3.48 -0.187222 -0.166282
7 4 9 7 7 2.85 -0.208889 -0.225699
8 4 8 6 7.5 3.67 0.331111 0.377453
9 4 7 6.5 6.5 3.91 -0.143889 -0.130970
1) Linear Equation: Ra=9.09+0.242Ton-0.365Toff-0.154WF-0.40Current 2) Non Linear Equation: Ra=92.741Ton0.205*Toff-0789*WF-0.199*Current-0.805
Optimal Solution For Die Steel (D3)
Response Ton Toff WF Current
μsec μsec Inch/sec A
Cutting Time 4 8 6 7.5
MRR 4 8 6 7.0
Ra 2 9 7 7.5
V. CONCLUSION
This paper has presented an investigation on optimization and the effect of machining parameters on surface roughness and MRR in WEDM operations. The control factors considered for the studies are Pulse-on, Pulse-off, Current and Spark voltage. Process parameters were selected based on Taguchi’s L’18 orthogonal array. ANN is used to predict the response variable viz., surface roughness,MRR. Back propagation feed forward neural network (BPNN) is used to build and train the network. The main out come of this research is that the most important factor for all three response variables are pulse on time where as other factors show different results for each response respectively. The combined result from CD function optimization for D3 steel work piece is Ton is on 4, Toff is on 9, Wire Feed is on 6 and the last factor current must be on 7.5 for combined effect of response parameters.
REFERENCES
[1] Wang, Y., Chen, X., Wang, Z., & Dong, S. (2018). Fabrication of micro gear with intact tooth profile by micro wire electrical discharge machining. Journal of Materials Processing Tech., 252, 137–147.
[2] Dabade, U. A., & Karidkar, S. S. (2016). Analysis of response variables in WEDM of Inconel 718 using Taguchi technique. Procedia CIRP, 41, 886–891. [3] Radhakrishnan, P., Vijayaraghavan, L., & Babu, N. R. (2017). Assessment of material removal capability with vibration-assisted wire electrical discharge
machining. Journal of Manufacturing Processes, 26, 323–329.
[4] Gong, Y., Su, Y., Cheng, J., Wang, C., Liu, Y., & Zhu, Z. (2016). Modeling and experimental study on breakdown voltage (BV) in low speed wire electrical discharge machining (LS-WEDM) of Ti-6Al-4V.International Journal of Advanced Manufacturing Technology, 1–16.
[5] Shakeri, S., Ghassemi, A., Hassani, M., & Hajian, A. (2016). Investigation of material removal rate and surface roughness in wire electrical discharge machining process for cementation alloy steel using artificial neural network. The International Journal of Advanced Manufacturing Technology, 82(1–4), 549– 557.
[6] Manjaiah, M., Laubscher, R.F., Kumar, A., & Basavarajappa, S. (2016). Parametric optimization of MRR and surface roughness in wire electro discharge machining (WEDM) of D2 steel using Taguchi-based utility approach. International Journal of Mechanical and Materials Engineering, 11(1).
[7] Sonawane, S.A., & Kulkarni, M.L. (2016). Experimental study and optimization of WEDM of Ti-6Al-4V using Taguchi method, 6(5), 1686–1691.
[8] Gaikwad, V., & Jatti, V. S. (2016). Optimization of material removal rate during electrical discharge machining of cryo-treated Ni-Ti alloys using Taguchi’s method. Journal of King Saud University - Engineering Sciences, 0–6.