Near Infrared Spectroscopy (NIRS) is an analyti-cal technique using a source of emitting radiation of the known wavelength (usually 800–2 500 nm, i.e. 12 500–4 000 per cm) and it enables to obtain a complete image of the organic composition of the analysed material (Van Kempen, 2001). The princi-ple of the method is the absorption or reflection of different wavelengths of incident radiation, which depends on the chemical composition of the ana-lysed sample. NIR spectroscopy has been applied in the food industry and agriculture as in the only fields since the sixties of the last century (determi-nation of water, protein, oil, fat and carbohydrate contents) (Centner, 1999). The application of NIR spectroscopy is nevertheless wider and includes determination of sensory and physicochemical pa-rameters (Rodrigez-Otero et al., 1997). Traditional methods to determine the quality of meat and its main components are relatively slow and rather expensive. The advantages of NIR spectroscopy include speed, simultaneity, non-destructive sam-ple measurement and especially a great potential
for on-line analysis. In the case of determination of components in the samples, it is nevertheless necessary to perform an accurate calibration of the NIR spectrometer using an appropriate file of cali-bration standards of the known composition, using appropriate analytical methods known as reference methods. The main disadvantage of the method is its dependence on reference methods, low sensitiv-ity to minor components, limited transmission of calibrations between various devices in some types of spectrometers and a complicated interpretation of spectral data (Büning-Pfaue et al., 2003).
In the published studies greatest attention was paid to the investigation of the NIRS ability to pre-dict the chemical composition of meat and quality of meat in different species. Nowadays, there is a number of calibrations for the chemical composi-tion of beef (Eichinger and Beck, 1992; Alomar et al., 2003; Togersen et al., 2003), pork (Togersen et al., 1999; Brondum et al., 2000) and poultry meat (Renden et al., 1986; Valdes and Summers, 1986; Abeni and Bergoglio, 2001), as well as rabbit meat (Masoero et
Application of FT NIR spectroscopy in the
determination of basic chemical composition
of pork and beef
J. Mlček, K. Šustová, J. Simeonovová
Department of Food Technology, Mendel University of Agriculture and Forestry, Brno, Czech Republic
ABSTRACT: The objective of this paper was to determine basic components of pork and beef (fat, protein, water content) using FT NIR spectroscopy. The samples were analysed on an FT NIR Nicolet Antaris device in a reflec-tance regimen. Reference results from classical analyses were used for the calibration of the device. Calibration models were created using PLS algorithm (method of partial least squares) and verified by cross-validation. High correlation coefficients (R) of calibration were calculated (fat 0.998; protein 0.976; water 0.994), and subsequently of validation as well (fat 0.997; protein 0.970; water 0.993) and very low standard deviations of the calibration and validation (SEC, SEP). No statistically significant differences between the reference and predicted values of determination were detected in Z-test. According to the published results, the NIRS method has a high potential to replace an expensive and time demanding chemical analysis of meat composition.
al., 1994) and lamb (Cozzolino et al., 2000). The meas-urement of the composition of meat mixes involving NIR spectroscopy was also used for recipe optimiza-tion methods in the control of sausage manufacture process (Reichert and Pogodda, 1993).
MATERIAL AND METHODS
Material
40 samples of fresh chilled beef and 40 samples of fresh chilled pork (retail meat and trimmings) with different ratios of fat, protein and water were used for analyses and subsequent calibration of NIR device. Approximately 300–400 g of each sample was used. The samples were obtained from various parts of carcasses and from cropping in order to achieve a different range of fat, protein and water values necessary to create calibration models for an FT NIR spectrophotometer. The samples were subsequently finely ground.
Reference methods
The contents of water, fat and protein were de-termined in ground samples of pork and beef using reference methods.
To determine the content of water, a reference gravimetric method was used representing a de-crease in weight due to drying under prescribed conditions in accordance with Czech State Standard No. 46 7092, Part 3 (1998).
The substances considered as fat are substances soluble in diethyl ether under the conditions of the method (extraction), according to Czech State Standard No. 46 7092, Part 7 (1998).
As nitrogen substances is considered the con-tent of nitrogen determined by a method accord-ing to Kjeldahl multiplied by the factor 6.25 (usaccord-ing BUCHI KJELDAL device), according to Czech State Standard No. 46 7092, Part 4 (1998).
NIR methods
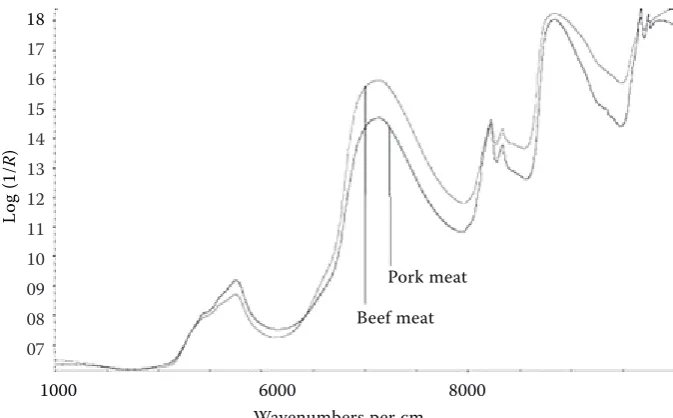
Ground meat samples were tempered to the labo-ratory temperature and simultaneously analysed with FT-NIR spectrometer Nicolet Antaris using the integration sphere with an adapter Sample Cup Spinner for sample rotation, at a resolution 8 per cm and 80 scans. The device was equipped with InGaAs detector and CaF2 beam splitter. The spec-tra were scanned within a range from 12 500 to 4 000 per cm for approximately 1 min. The spectra of meat samples (Figure 1) were measured in the reflectance regimen (the technique measuring ir-radiation after reflection from the sample layer) in a compression cuvette with the glass bottom 1 cm in diameter. Each sample was scanned twice and an average spectrum was used for calibration. Spectra were stored in a log (1/R) format. These units rep-resent the quantity of infrared energy absorbed by the sample during a reflex sampling.
Result integration software (ThermoNicolet, 2004b) was used for the measurement of spectra and
sto-18
17 16 15 14 13 12 11 10 09 08 07
Lo
g
(1
/
R
)
1000 6000 8000
Pork meat
Beef meat
[image:2.595.125.462.523.732.2]Sample No. Pork Beef
protein fat water protein fat water
1 120.6 472.8 409.5 212.0 81.6 698.7
2 147.2 349.8 500.3 216.6 93.9 708.3
3 173.0 246.2 583.2 209.7 76.8 721.4
4 153.9 299.5 543.8 211.4 72.6 733.0
5 156.9 300.3 543.5 209.4 62.7 736.7
6 177.1 133.6 682.2 221.0 63.6 722.4
7 213.7 51.1 722.1 200.9 101.7 691.8
8 213.7 54.4 717.3 206.7 109.0 684.1
9 150.5 320.7 538.4 162.2 341.6 514.1
10 145.0 386.6 477.6 188.7 217.7 607.2
11 185.7 161.5 661.2 194.1 135.6 673.3
12 185.6 151.7 658.6 208.2 74.2 716.8
13 191.0 100.6 696.9 231.8 39.7 732.6
14 138.4 409.4 464.8 226.3 65.9 713.0
15 111.7 541.0 368.3 223.2 68.0 711.7
16 183.3 169.1 647.5 222.8 94.9 685.9
17 169.9 190.1 639.0 211.6 88.0 698.4
18 208.4 115.5 678.4 172.6 274.7 567.1
19 206.2 112.0 683.4 149.5 350.2 512.8
20 190.4 74.3 728.8 174.2 270.0 563.2
21 206.8 21.2 748.6 196.0 60.7 722.1
22 148.8 354.2 504.5 210.1 121.2 663.7
23 179.0 223.4 598.5 177.5 226.3 604.5
24 213.1 39.2 746.3 182.4 171.8 647.9
25 203.5 59.4 734.4 203.1 44.3 756.6
26 214.1 46.6 734.4 192.8 92.2 710.9
27 204.1 74.8 717.7 201.6 77.0 715.9
28 191.5 132.6 677.8 195.5 118.7 685.5
29 205.0 17.8 757.8 190.8 175.7 630.8
30 178.1 172.5 652.3 196.2 156.2 652.0
31 87.0 603.7 311.0 184.4 152.4 663.6
32 110.7 482.0 405.4 204.2 92.4 693.2
33 116.7 481.1 405.9 199.2 63.4 727.0
34 112.4 474.3 408.7 189.0 244.1 568.5
35 116.8 479.8 402.1 177.3 256.2 572.6
36 129.9 433.3 444.1 218.0 61.1 729.6
37 131.3 421.0 450.7 187.3 41.8 736.8
38 190.6 92.6 710.5 200.8 225.7 582.6
39 47.6 787.2 169.2 164.1 346,3 496.1
40 53.4 781.5 174.6 157.8 123.4 694.6
min 47.6 17.8 169.2 149.5 39.7 496.1
max 214.1 787.2 757.8 231.8 350.2 756.6
x
– p 161.6 270.5 567.6 197.0 138.3 666.2
s–x 43.4 204.7 156.9 19.3 88.8 69.5
[image:3.595.63.536.115.743.2]max = maximum values; min = minimum values; x– = average values; s–= standard deviation
rage of data. Software TQ analyst (ThermoNicolet, 2004a) was used for subsequent calibration.
Statistical methods
Discrimination analysis belongs among methods analysing the relation between groups of independ-ent variables, called discriminators, i.e. columns of a source matrix on the one hand and one qualitative dependently variable on the other hand. It enables the inclusion of an object to one of the already existing classes. In the entry data are the included objects placed into primary classes according to the values of discriminators in all of the objects. Furthermore, there are non-included objects for which the inclusion to a class will be determined. The object is included to a class based on its highest similarity, e.g. shortest Mahalanobis distance.
Calibration models were created using PLS al-gorithm (method of least squares) (Haaland and Thomas, 1988a,b) and verified by cross-validation. PLS factors used in calibration models include spectral and also concentration information. Cross-validation is used in order to avoid the so-called “overfitting” of calibration models (Sanderson et al., 1997). One of the standards is always removed during this procedure and a new model is created from the remaining calibration data, which is used for the calculation of the concentration vector of the removed standard. Calculated deviations from the declared content of components of the removed standard are statistically evaluated afterwards.
Evaluation of the results was performed based on the correlation between the reference values and
the values calculated from the obtained calibra-tion formulas and based on the value of standard deviations of the calibration (SEC) and validation (SEP). An accent is put on minimal SEP because it is a deviation which is expected in future predic-tions. SEP of reliable calibration is not usually much higher than SEC. The most desirable value of both deviations is a value approaching zero.
The eligibility of the resulting model is evaluated according to correlation coefficients (R) as well. Correlation coefficient is a measure of the linear re-lation between the measured spectra and reference laboratory values. The more the R value approaches 1, the more the model is considered useful. Another measure of reliability of the model is the value of cali-bration coefficient of variation CCV and the value of prediction coefficient of variation PCV. A very reliable calibration means that the value of CCV is below 5% and the value of PCV is below 10%.
RESULTS AND DISCUSSION
Reference data
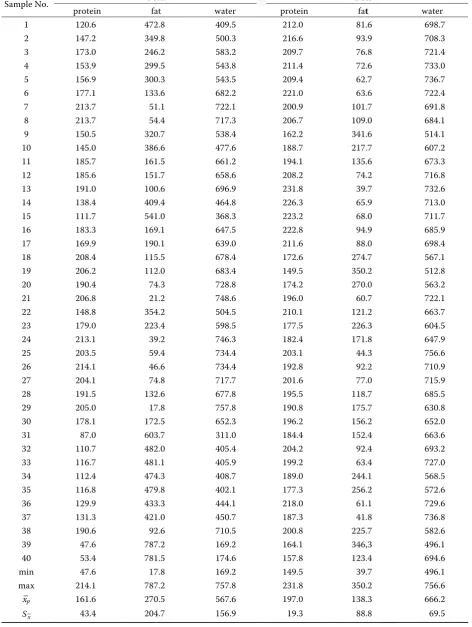
The composition of samples of fresh pork and beef is provided in Table 1. Exact reference analy-ses of the samples are the limiting factor to obtain functional calibration models (Murray, 1986). To create calibration models, samples with different content of fat, protein and water were used in order to ensure the greatest range for the needs of calibra-tion. In Table 1 we can estimate very high fatness of pork. This limiting value of fat was achieved using pork fat. Maximal values of fat in beef are
–0.0 Distance to pork meat 0.6
[image:4.595.133.456.548.739.2]–0.0 Distance to beef meat 0.6 X calibration X validation Y calibration Y validation Other calibration Other validation
given mainly by cuts from various parts of car-casses. Protein then corresponds with the content of fat in each sample. The spectra were obtained from all samples in the measurements with FT NIR device.
Discrimination analysis
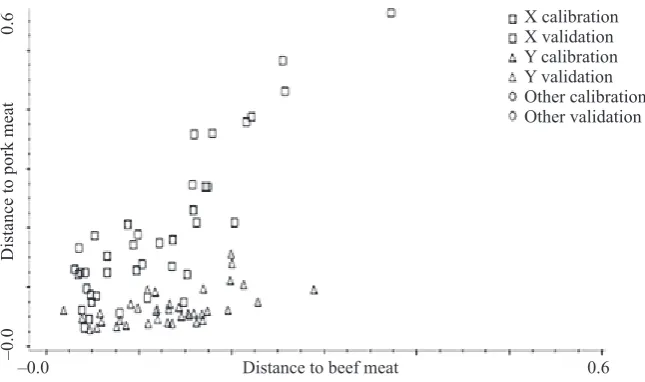
Discrimination analysis was used to determine the spectral differences. This spectral classifica-tion technique determines the class (or classes) most similar to the unknown material. The result is the name of the class (or classes) being most similar to the analysed sample. A part of the re-sult is also Mahalanobis distance, i.e. distance of the evaluated spectrum from the centre of each class.
Discrimination analysis was used to compare spectra of pork and beef samples. Due to great simi-larity (Figure 2) the spectra of 40 pork and 40 beef samples were joined together and therefore there were 80 samples used for the calibration, and/or 80 average spectra.
Creation of calibration model
The goal of our work was to determine the ba-sic components of pork and beef using the NIR method. We focused on the determination of
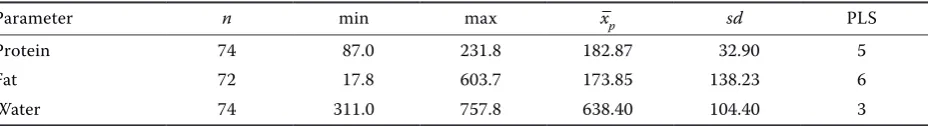
pro-tein, fat and water contents. To create a calibration model, 80 (pork and beef) samples were therefore used. The same distance results were ignored us-ing a diagnostic device (spectrum outlier). These results included those in which the reference value was not determined exactly or in which there was a deviation in the measured spectrum. These were mainly samples of pork fat, which revealed a great deviation from the other measured spectra. Exact numbers of samples used for calibration are pro-vided in Table 2. The first or second derivation of the spectrum was not performed.
Prediction of meat composition using NIR technique
Table 3 and 4 show standard deviations of cali-bration (SEC), standard deviations of validation (SEP), values of calibration coefficients of variation (CCV), values of prediction coefficients of varia-tion (PCV) and correlavaria-tion coefficients of calibra-tion and validacalibra-tion (R).
[image:5.595.67.533.101.164.2]It follows from Table 4 that the value of PCV (10%) was not exceeded in the samples, on the contrary, very low values were obtained confirming that the calibration models for the determination of the contents of water, fat and protein satisfied the con-ditions of reliable models. The value of CCV below 5% was recorded in all models as well (Table 3). All of these models may therefore be evaluated as very Table 2. Reference analytical values of pork and beef after elimination of some samples (g/kg)
Parameter n min max x–p sd PLS
Protein 74 87.0 231.8 182.87 32.90 5
Fat 72 17.8 603.7 173.85 138.23 6
Water 74 311.0 757.8 638.40 104.40 3
n = number of samples; max = maximum values; min = minimum values; x–p = average values;
[image:5.595.65.531.664.724.2]sd = standard deviation; PLS = number of factors
Table 3. Calibration results for components of pork and beef
Parameter y = bx + a SEC (g/kg) CCV (%) R
Protein 0.9532x + 8.5652 7.13 3.89 0.976
Fat 0.9965x + 0.5964 8.17 4.69 0.998
Water 0.9882x + 7.5480 11.3 1.77 0.994
reliable. As can be seen, high values of correlation coefficients in all calibrations were calculated. It is also worth paying attention that most published studies in which the chemical composition of meat was measured using the NIR technique reported also high levels of correlation coefficients (above 0.90) (Prevolnik et al., 2004). Although correlation coefficients for water and protein are rather nar-rower, they have no significant effect on the robust-ness of the model. This statement was also reported by most authors (Togersen et al., 1999; Brondum et al., 2000; Cozzolino et al., 2002; Alomar et al., 2003). All models are very robust and useful for practice. Very narrow and stable values of standard deviations of calibration and validation (SEC and SEP) were obtained.
Togersen et al. (2003) reported that the predic-tion of accuracy was influenced by varying quality of grinding: finer grinding provided higher predic-tion accuracy. A series of other trials confirmed that the prediction of chemical composition of meat was better in ground samples compared with samples that were not processed (Eichinger and Beck, 1992; Cozzolino et al., 2000; Cozzolino and Murray, 2002). We therefore ground the samples of all kinds of meat in our trials as well. Using a compression cuvette, we achieved a uniform loca-tion of the non-homogeneous sample by pressing. A spinner was used during the measurements: it is a device intended for the rotation of a sample that balances the measurements of finely and roughly ground samples. The whole surface of the sample
is then recorded during the measurement of a non-homogeneous sample and not only its part. Very good results were obtained thanks to this device as well.
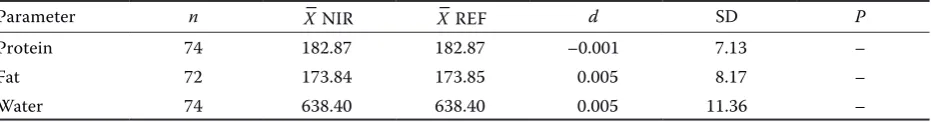
All results of reference values and NIR values were statistically verified using a parametric Z-test (Table 5). There was no statistically significant difference detected between the evaluated values (z–zt) in any of the determined parameters.
[image:6.595.65.530.102.164.2]High correlation coefficients (R) of calibration and subsequently validation, very low standard deviations of calibration and validation (SEC, SEP) were calculated. The CCV and PCV values were obtained in all calibration models. We can there-fore declare that they are models with very high reliability. The performance of the NIRS method to predict the composition of meat may be influ-enced by the accuracy of the reference method against which the calibration is performed. The use of NIRS method may be further limited be-cause it requires a demanding and difficult cali-bration. Once a reliable calibration is performed, the determination itself is very simple. Compared with traditional methods for the determination of chemical composition and quality of meat, the NIRS method enables a fast, simple and simulta-neous evaluation of more components and prop-erties of meat and all of this without the need of any chemicals. It is also a non-destructive method suitable for food evaluation even in inter-opera-tional analysis. According to the published results, the NIRS method has a high potential to replace an Table 4. Prediction results for components of pork and beef
Parameter y = bx + a SEP (g/kg) PCV (%) R
Protein 0.9431x + 10.314 7.94 4.34 0.970
Fat 0.9957x + 0.7064 9.36 5.38 0.997
Water 0.9855x + 9.3530 12.2 1.91 0.993
y = bx + a = linear regression line; SEP = standard error of prediction; PCV = prediction coefficient of variation; R= cor-relation coefficient
Table 5. Statistical evaluation of reference and NIR values by Z-test
Parameter n x– NIR –x REF d SD P
Protein 74 182.87 182.87 –0.001 7.13 –
Fat 72 173.84 173.85 0.005 8.17 –
Water 74 638.40 638.40 0.005 11.36 –
[image:6.595.65.531.226.287.2]expensive and time demanding chemical analysis of meat composition.
Acknowledgements
Special thanks to K Maso Ltd. Company and to Mr. Ing. Ladislav Tenkl from Nicolet CZ Ltd. Company.
REFERENCES
Abeni F., Bergoglio G. (2001): Characterization of differ-ent strains of broiler chicken by carcass measuremdiffer-ents, chemical and physical parameters and NIRS on breast muscle. Meat Sci., 57, 133–137.
Alomar D., Gallo C., Castaneda M., Fuchslocher R. (2003): Chemical and discriminant analysis of bovine meat by near infrared reflectance spectroscopy (NIRS). Meat Sci., 63, 441–450.
Brøndum J., Munck L., Henckel P., Karlsson A., Tornberg E., Engelsen S.B. (2000): Prediction of water-holding capacity and composition of porcine meat by com-parative spectroscopy. Meat Sci., 55, 177–185. Büning-Pfaue H. (2003): Analysis of water in food by near
infrared spectroscopy. Food Chem., 82, 107–115. Centner V. (1999): Blízká infračervená spektroskopie (NIR)
a její průmyslová aplikace. CHEMagazín, 1, 22–23. Cozzolino D., Murray I. (2002): Effect of sample
presen-tation and animal muscle species on the analysis of meat by near infrared reflectance spectroscopy. J. Near Infrared Spectrosc., 10, 37–44.
Cozzolino D., Murray I., Scaife J.R., Paterson R. (2000): Study of dissected lamb muscles by visible and near infrared reflectance spectroscopy for composition as-sessment. Anim. Sci., 70, 417–423.
Cozzolino D., De Mattos D., Martins V. (2002): Visible/ near infrared reflectance spectroscopy for predicting composition and tracing system of production of beef muscle. Anim. Sci., 74, 477–484.
Czech State Standard No. 46 7092-3 (1998): Testing methods for feeding stuffs – Part 3: Determination of moisture content.
Czech State Standard No. 46 7092-4 (1998): Testing methods for feeding stuffs – Part 4: Determination of crude protein content.
Czech State Standard No. 46 7092-7 (1998): Testing methods for feeding stuffs – Part 7: Determination of fat content.
Eichinger H., Beck G. (1992): Possibilities for improving breeding value estimation of meat quality in cattle by
using the near-infrared measurement technique. Arch. Tierzucht, 35, 41–50.
Haaland M.D., Thomas V.E. (1988a): Partial least squares methods for spectral analyses. 1. Relation to other quantitative calibration methods and the extraction of qualitative information. Anal. Chem., 60, 1193–1202. Haaland M.D., Thomas V.E. (1988b): Partial least squares
methods for spectral analyses. 2. Application to simu-lated and glass spectral data. Anal. Chem., 60, 1202– 1208.
Masoero G., Xiccato G., Zotte dalle A., Parigi Bini R., Bergoglio G. (1994): Analysis of freeze-dried rabbit meat by NIRS. Zootecnica e Nutrizione Animale, 20, 319–329.
Murray I. (1986): Near infrared reflectance analysis of forages. In: Heresign W., Cole D.J.A. (eds.): Recent Ad-vances in Animal Nutrition. Butterworths, London. 141–156.
Prevolnik M., Čandek-Potokar M., Škorjanc D. (2004): Ability of NIR spectroscopy to predict meat chemical composition and duality – a review. Czech J. Anim. Sci., 49, 500–510.
Reichert J.E., Pogodda H.J. (1993): On-Line Schnellana-lytik bei Rohstoffen: Kostenersparnis bei der Fertigung von Wurstwaren durch programmgesteuerte Rezep-turoptimierung. Fleischerei, 44, 438–440.
Renden J.A., Oates S.S., Reed R.B. (1986): Determination of body fat and moisture in dwarf hens with near in-frared reflectance spectroscopy. Poult. Sci., 65, 1539– 1541.
Rodriguez-Otero J.L., Hermida M., Centero J. (1997): Analysis of dairy products by near-infrared spectros-copy: A review. J. Agric. Food Chem., 45, 2815– 2818.
Sanderson R., Lister S.J., Dhanoa M.S., Barnes R.J., Tho-mas C. (1997): Use of near infrared reflectance spec-troscopy to predict and compare the composition of carcass samples from young steers. Anim. Sci., 65, 45–54.
ThermoNicolet (2004a): Spektroskopický software TQ Analyst. Firemní literatura, kurz 14.–15.6., Praha. 51 pp.
ThermoNicolet (2004b): Result integration. Firemní li-teratura, kurz 14.–15.6., Praha. 51 pp.
Tøgersen G., Isaksson T., Nilsen B.N., Bakker E.A., Hil-drum K.I. (1999): On-line NIR analysis of fat, water and protein in industrial scale ground meat batches. Meat Sci., 51, 97–102.
Valdes E.V., Summers J.D. (1986): Determination of crude protein in carcass and breast muscle samples of poul-try by near infrared reflectance spectroscopy. Poult. Sci., 65, 485–490.
Corresponding Author
Ing. Jiří Mlček, Department of Food Technology, Mendel University of Agriculture and Forestry in Brno, Zemědělská 1, 614 00 Brno, Czech Republic
Tel. +420 545 133 262, fax +420 545 133 190, e-mail: [email protected]
Van Kempen L. (2001): Infrared technology in animal production. Worlds Poult. Sci. J., 57, 29–48.