Visualizing semantic table annotations with TableMiner+
MAZUMDAR, Suvodeep <http://orcid.org/0000-0002-0748-7638> and
ZHANG, Ziqi
Available from Sheffield Hallam University Research Archive (SHURA) at:
http://shura.shu.ac.uk/16909/
This document is the author deposited version. You are advised to consult the
publisher's version if you wish to cite from it.
Published version
MAZUMDAR, Suvodeep and ZHANG, Ziqi (2016). Visualizing semantic table
annotations with TableMiner+. In: KAWAMURA, Takahiro and PAULHEIM, Heiko,
(eds.) ISWC-P&D 2016 : ISWC 2016 Posters & Demonstrations Track : Proceedings
of the ISWC 2016 Posters & Demonstrations Track co-located with 15th International
Semantic Web Conference (ISWC 2016). Kobe, Japan, October 19, 2016. CEUR
Workshop Proceedings . CEUR Workshop Proceedings.
Copyright and re-use policy
See
http://shura.shu.ac.uk/information.html
Sheffield Hallam University Research Archive
TableMiner
+Suvodeep Mazumdar and Ziqi Zhang
Department of Computer Science, University of Sheffield 211 Portobello, Sheffield, UK
{s.mazumdar,ziqi.zhang}@sheffield.ac.uk
Abstract. This paper describes an extension of the TableMiner+
sys-tem, an open source Semantic Table Interpretation system that annotates Web tables using Linked Data in an effective and efficient approach. It adds a graphical user interface to TableMiner+
, to facilitate the visualiza-tion and correcvisualiza-tion of automatically generated annotavisualiza-tions. This makes TableMiner+
an ideal tool for the semi-automatic creation of high-quality semantic annotations on tabular data, which facilitates the publication of Linked Data on the Web.
Keywords: Web table, Named Entity Disambiguation, Semantic Table Interpretation, table annotation, Linked Data
1
Introduction
Recovering semantics from the growing amount of tabular data on the Web is a crucial task in realizing the vision of the Semantic Web. Traditional search engines perform poorly on such data, as they fail to recover the semantics of tabular structures [1, 2]. Recent years have seen an increase in the research on Semantic Table Interpretation [1, 4, 2, 5], which annotates relational tables using schema and entities defined in a reference knowledge base. The process (1) links entity mentions in content cells to named entities; (2) annotates columns with concepts if they contain entity mentions, or properties of concepts if they contain data literals; and (3) identifies the semantic relations between columns.
TableMiner+ [6] is such a method adopting an incremental, bootstrapping
approach that starts by creating preliminary and partial annotations of a table using ‘sample’ data, then using the outcome as ‘seed’ to guide interpretation of remaining contents. It has been implemented as open-source software (as part of the STI library1
), however, the system is lacking an intuitive user interface, which has made it difficult to be used by an average person with limited technical knowledge.
This work implements a graphical user interface specifically for TableMiner+,
to make it an easy-to-use tool for annotating Web tables using Linked Data, and
1
2 Lecture Notes in Computer Science: Authors’ Instructions
also extend it by enabling users to visualize and correct the generated annota-tions and Linked Data triples. As a result, data publishers can use TableMiner+
for transforming tabular data on the Web into high-quality Linked Data, or creating gold-standard for experiment purposes.
2
Related Work
Recent years have seen an increasing number of work on Semantic Table Interpre-tation, such as Venetis et al. [3] that uses a maximum likelihood model; Limaye et al. [1] that uses a joint inference model; Mulwad et al. [2] that uses joint in-ference with semantic message passing; TableMiner [5] and TableMiner+[6] that
adopt an bootstrapping approach starting by creating preliminary annotations of a table using automatically selected ‘sample’ data in the table, followed by a message passing process that iteratively refines the preliminary annotations to create the final optimal results. These methods differ in terms of the inference models, features and background knowledge bases used. As discussed before, existing tools remains difficult to use due to the lack of a user friendly interface.
3
Description of the TableMiner
+Application Interface
We use the TableMiner+ implementation distributed as part of the STI library
as basis for this work. The STI library provides an implementation of the system introduced in Zhang [6], and a few baseline systems. The library is implemented in Java, and uses DBpedia as the knowledge base. Currently, a Web-based in-terface consisting of two components are implemented: one that lets users to define, configure and start a table annotation task; and the other that lets users to visualize and correct annotation results. In both cases, interaction is achieved via a Web browser.
3.1 Starting a table annotation process
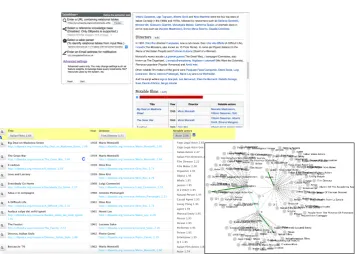
The interface for starting a Semantic Table Annotation task is illustrated in Figure 3.1 (top)2. Users firstly select a Webpage containing relational tables that
are to be annotated. A preview of the Webpage is shown and the list of tables potentially containing relational data is highlighted. The users then select the tables they wish to annotate. They can also configure the system to alter settings such as feature weights and knowledge base query constraints. The users may provide an email address to subscribe for automatic alert when the annotation task completes. When the users are satisfied with the configuration and the input, they click the button to start the task, which will create annotations in JSON format. These will be interpreted and displayed using the visualization component described below.
2 Follow https://github.com/ziqizhang/sti/tree/master/ui for a demo and on how to
Fig. 1.User interface: (top) starting an annotation task; (bottom left) annotated table; (bottom right) a graph visualisation of candidate annotations for users to select
3.2 Visualization and correction of annotations
The JSON files are then passed onto the visualization component, which consists of two interactive elements: an annotated table and a graph visualization module. The annotated table is the first point of interaction with the user, and presents the original table, annotated with the entities, concepts and relations identified by TableMiner+. The first step for the UI is to investigate the header
cells of the table - TableMiner+ creates a set of candidate concepts that best
describe the header and the data in the column. Each associated concept has a score indicating the system’s confidence. This set of candidate concepts is pre-sented as a dropdown with the scores (Figure 3.1 section B). Users can select any of the concepts to indicate a more appropriate annotation by clicking on the respective concept. Table cell annotations can be visualized in the same way. As can be seen from the figure, some entities have already been recognized, while some haven’t. In case the user can provide a URI that is appropriate for any missing annotation, this can be done by double clicking the relevant cell, which will provide a prompt for a text input. Further SPARQL queries can be triggered to the respective endpoints (based on the user customisations) that can identify any missing annotations.
4 Lecture Notes in Computer Science: Authors’ Instructions
and it’s relevant candidate concepts have been plotted as a graph in Figure 3.1. Header cells are shown as nodes labelled with the header columns (0-3), while the candidate classes are shown as nodes, linked with header elements. The most relevant class is shown with a strong link, while the others are presented as dashed lines. Clicking the dashed ones annotate the relevant header cell with the respective concept, which will then confirm the change with a strong link (here, a straight thick line). Header cells are also linked with each other with dashed lines, which is interpreted as only an indicative relation. However, if TableMiner+
creates any relations between the columns, it is reflected as straight lines as can be seen in Figure 3.1.
The proposed demo will follow the process of identifying a web page, down-loading and extracting tables and then the annotation process itself. Finally, the annotations will be visualized with the TableMiner+ UI, enabling users to
correct and provide any missing information.
4
Conclusion
This paper introduced a graphical user interface for TableMiner+to facilitate the
semi-automatic creation of high quality Linked Data and annotations on Web tables. Future work will extend the system to support, e.g., different knowledge bases, other algorithms, fine-grained task definition that enable batch processing and zoning on tables (e.g., specific columns).
Acknowledgement Part of this work is funded by ADD PROJECT HERE. We also thank the ADEQUATe3project team under the lead of Dr Tomas Knap
for contributing valuable design ideas.
References
1. Girija Limaye, Sunita Sarawagi, and Soumen Chakrabarti. Annotating and search-ing web tables ussearch-ing entities, types and relationships. Proceedings of the VLDB Endowment, 3(1-2):1338–1347, 2010.
2. Varish Mulwad, Tim Finin, and Anupam Joshi. Semantic message passing for gen-erating linked data from tables. In International Semantic Web Conference (1), Lecture Notes in Computer Science, pages 363–378. Springer, 2013.
3. Petros Venetis, Alon Halevy, Jayant Madhavan, Marius Pa¸sca, Warren Shen, Fei Wu, Gengxin Miao, and Chung Wu. Recovering semantics of tables on the web.
Proceedings of VLDB Endowment, 4(9):528–538, June 2011.
4. Jingjing Wang, Haixun Wang, Zhongyuan Wang, and Kenny Q. Zhu. Understanding tables on the web. InProceedings of the 31st international conference on Conceptual Modeling, ER’12, pages 141–155, Berlin, Heidelberg, 2012. Springer-Verlag. 5. Ziqi Zhang. Towards effective and efficient semantic table interpretation. In
Pro-ceedings of the 13th International Semantic Web Conference, pages 487–502, 2014. 6. Ziqi Zhang. Effective and efficient semantic table interpretation using tableminer+.
Semantic Web Journal, under open review with Tracking: 1339-2551.
3