Depression Prediction System Using Different Methods
Mrunal Kulkarni
1, Prof. Arti R.Wadhekar
21
M.Tech. Student (Department of Electronics and Telecommunication Engineering, Deogiri Institute of
Engineering and Management Studies, Aurangabad, Maharashtra, India)
2
Assistant Professor (Department of Electronics and Telecommunication Engineering, Deogiri Institute of
Engineering and Management Studies, Aurangabad, Maharashtra, India)
---***---Abstract -This Paper is focused on the basic survey of the methods which are used to predict depression in humans. Depression is a mental disorder which may lead to suicide if not cured at early curable stages. So it is very important to predict depression as soon as possible. Many people in the world are suffering from depression in their day to day life. Depression is of different types and can be predicted by different ways. In this paper, study about all the techniques which are used to predict depression and their relative study about techniques, methods, algorithms used to predict depression is done. Depression is a mental disorder which may lead to suicide if not cured at early curable stages. So it is very important to predict depression as soon as possible. Many people in the world are suffering from depression in their day to day life. Depression is of different types and can be predicted by different ways. So to predict depression, this system is developed which includes different techniques for diagnosing depression disorder. In this project three parts have designed, i.e., question and answer part, EEG signal processing and diagnosing part and sentiment analysis part. The system can predict the depression of the user using three different ways. Machine learning algorithms like Naïve Bayes and Neural Network are used here for classification of data. So the system tell us whether the person is depressed or not.
Key Words: Artificial Intelligence, EEG, Sentiment Analysis, NN, Python, Random Forest, Naive Bayes.
1. INTRODUCTION
Depression is a very serious disorder and it is very necessary to predict it at very early curable stage. Human Brain is a most complex part of the body. So it is very difficult to understand it’s complexity. Depression is found as a Mental disorder, so to predict depression is a very complex part. Psychiatrist says that diagnosis and cure of Depression is done mostly by using Questions and Answers and by applying various Psychometric tests and theory and by observing patient’s response to it. But Now a days, research says that there are also other methods using which we can predict depression. This methods are Depression Prediction using EEG signal Processing, Depression Prediction using Text analysis which includes sentiment analysis, etc. This methods mostly belongs to Artificial Intelligence, Machine learning algorithms in it. Following are some key points which everyone should know before learning these Depression prediction methods.
1.1 Artificial Intelligence (AI)
Artificial Intelligence (AI) is an area of computer science that emphasizes the creation of intelligent machines that work and react like humans .A machine with the ability to perform cognitive functions such as perceiving, learning, reasoning and solve problems are deemed to hold an Artificial Intelligence (AI). AI represents simulated intelligence in machines .It is a subset of Data Science. Artificial Intelligence exists when a machine has a cognitive ability .The AI includes human level concerning reasoning, speech and vision.AI is used to avoid repetitive task. AI can repeat a task continuously.AI is used in all industries, from marketing to supply chain, finance, food product, social media applications, etc.
1.2 Machine Learning(ML)
Machine Learning (ML) is a data analytics technique that teaches computers to do what comes naturally to humans and animals, i.e., learn from experience. ML algorithms use computational methods to ‘learn’ information directly from data without relying on a predetermined equation as a model. The algorithms adaptively improve their performance as the number of samples available for learning increases. ML is used when:
Hand written rules and equations are too complex as in face recognition and speech recognition.
The rules of a task are constantly changing as in fraud detection from transaction records.
The nature of data keep changing and program needs to adapt as in automated trading ,energy demand forecasting and predicting shopping trends.
1.3 Deep Learning
Deep Learning imitates the way our brain works, i.e., learn from experiences. It uses concepts of neural networks to solve complex problems. Deep learning works as follows:
Deep Learning is based on basic unit of brain called brain cell or a neuron. Inspired from a neuron, an artificial neuron or perceptron was developed.
Similarly, a perceptron receive multiple inputs, applies various transformations and functions and provides an output.
Just like how our brain contains multiple connected neurons called neural network, we can also have a network of artificial neurons called perceptrons to form a deep neural network.
An Artificial Neuron or a Perceptron models a neuron which has a set of inputs, each of which is assigned some specific weight. The neuron then computes some function on these weighted inputs and gives output.
1.4 Artificial Neural Network (ANN)
An Artificial Neural Network (ANN) is a computational model based on the structure and functions of biological neural networks. ANN is an information processing model that is inspired by the way biological nervous systems such as brain process information. Information that flows through the network affects the structure of ANN because a neural network changes or learns, in a sense-based on that input and output.ANN are considered nonlinear statistical data modelling tools where the complex relationships between inputs and outputs are modelled or patterns are found.
Advantages of ANN are:
Actually Learn from observing data sets.
ANN used as a random function approximation tool.
ANN takes data samples rather than entire data sets to arrive at solutions, which saves both time and money.
1.5 Electroencephalography
Electroencephalography is a medical imaging technique that reads scalp electrical activity generated by brain structures. The electroencephalogram (EEG) is defined as electrical activity of an alternating type recorded from the scalp surface after being picked up by metal electrodes and conductive media [1]. The EEG measured directly from the cortical surface is called electrocardiogram while when using depth probes it is called electrogram.EEG measured from the head surface is considered. Thus electroencephalographic reading is a completely non-invasive procedure that can be applied repeatedly to patients, normal adults, and children with virtually no risk or limitation.
2. LITERATURE SURVEY
In this work, mainly three techniques are used to find depression, viz., Q&A, EEG signal processing and Sentiment analysis using twitter comments. Various research paper were studied, few among them have described below.
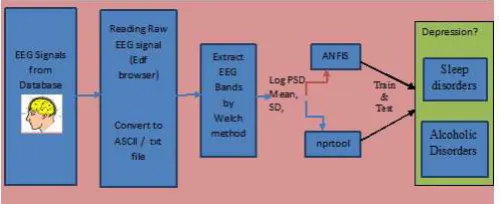
[image:2.595.308.559.321.423.2]Another technique to predict depression is by analyzing EEG signal, i.e. using EEG signal processing.Mallikarjun H. M. and Dr. H. N. Suresh in their paper, “Depression Level Prediction using EEG signal processing”[1], obtained Electroencephalogram Gram (EEG) signals from publicly available database and are processed in MATLAB. It is useful in classifying subjects with the disorders using classifier tools present in it. For classification purpose, the features are extracted from frequency bands (alpha, delta and theta).Initially EEG signals were read using EDF browser software and the signals were loaded into MATLAB to get log Power Spectral Density from EEG bands. The results obtained from MATLAB are fed into neural network pattern recognition tool and ANFIS tool box which is integrated in MATLAB. These are powerful tool are used for data classification. Relevant extracted features parameters such as mean, standard deviation, entropy are used as inputs to the ANFIS and nprtool.
Fig -2.1: EEG signal processing for classification of disorders
Renu Gautam and Mrs. Shimi S.L in their paper, “Features Extraction and Depression Level Prediction by Using EEG Signals”[2], classified the depression level of the paitents from urban and rural area. Firstly EEG data file(.edf) is converted into .wav file and further pre-processing is done in MATLAB. For the clasification, two machine learning algorithms are used ,i.e., K-Nearest Neighbor (KNN) and Regression Tree (RT).
B. Hosseinifard, M. H. Moradi and R. Rostami in their paper, "Classifying depression patients and normal subjects using machine learning techniques”[3],described their work to developed a system which can classify depressive and normal paitents using support vector machine(SVM) and logistic regression(LR) machine learning techniques for classification. For feature extraction, genetics algorithm (GA) is used and results are obtained.
M. M. Aldarwish and H. F. Ahmad in their paper, "Predicting Depression Levels Using Social Media Posts”[4] described their work to develop a webapplication which takes social media posts and questionnaire test as a input and predict output as various depression level. Naïve bayes classification algorithm is used to increase accuracy.
are some standard questionnaires used by doctors to determine the levels of anxiety and depression that a person is experiencing. One of the most commonly used test is Hospital Anxiety and Depression Scale (HADS).The HADS is a fourteen item scale that generates ordinal data. Seven of the items relate to anxiety and seven relate to depression. The item on the questionnaire consists of questions like ‘I feel tense or wound up’, ‘worrying thoughts go through my mind’, ‘I have lost interests in my appearance ’, etc. Each item on questionnaire is scored from 0-3 and this means that a person can score between 0 and 21 for either anxiety or depression [5]. The other most commonly used test by psychiatrist is BECK’s Depression Inventory (BDI). This test is used for measuring the severity of depression. In its current version BDI –II is designed for individuals aged 13 and over, and is composed of items relating to symptoms of depression such as hopelessness and irritability, cognitions such as guilt or feelings of being punished, as well as physical symptoms such as fatigue, weight loss, and lack of interest in sex.
Different Machine Learning Techniques and Algorithms [6]: There are different machine learning techniques and algorithms which are depending on the type of data used for classification. Some machine learning techniques are supervised learning, unsupervised machine learning, semi-supervised learning, reinforcement learning. Supervised learning concerned with classified data, i.e. data with label, while unsupervised learning unlabeled data. Semi-supervised learning techniques concerned with both labeled and unlabeled data. Reinforcement learning doesn’t require any data to predict output.
Based on these techniques there are algorithms used for classification and training purpose. Examples of Supervised learning algorithms are decision trees, rule-based classifiers, naïve bayesian classification, k-nearest neighbors classifiers, neural network, support vector machine. Some of the unsupervised learning algorithms are k-means clustering, hidden markov model, Gaussian mixture model.
Naïve Bayesian: To calculate the probability that an event will occur, given that another event has already occurred, Bayes Theorem is used. To calculate the probability of hypothesis(h) being true, given our prior knowledge(d), we use Bayes’s Theorem as follows:
P(h|d)= (P(d|h) P(h)) / P(d)
where: P(h|d) = Posterior probability. The probability of hypothesis h being true, given the data d, where P(h|d)= P(d1| h) P(d2| h)….P(dn| h) P(d)
P(d|h) = Likelihood. The probability of data d given that the hypothesis h was true.
P(h) = Class prior probability. The probability of hypothesis h being true (irrespective of the data)
P(d) = Predictor prior probability. Probability of the data (irrespective of the hypothesis).
This algorithm is called ‘naive’ because it assumes that all the variables are independent of each other, which is a naive assumption to make in real-world examples.
Support Vector Machines (SVM): SVM is binary classification algorithm. Given a set of points of 2 types in N dimensional place, SVM generates a (N — 1) dimensional hyperplane to separate those points into 2 groups. Say you have some points of 2 types in a paper which are linearly separable. SVM will find a straight line which separates those points into 2 types and situated as far as possible from all those points.
Fig-2.2: SVM Algorithm
3. SYSTEM DESIGN AND DEVELOPMENT
From above survey, different techniques to predict depression were studied. Here we are proposing a system to predict depression by taking reference of above survey. One website is to be developed using python language which consist of some of above techniques to measure depression. On primary basis, Q & A analysis using BECK’s depression inventory, EEG signal processing and sentiment analysis will be added on the website. The main aim to develop the system is that anyone can measure depression including doctors at any time.
Above figure 3.1 shows the overall flow of the system. The system is nothing, but the website designed to develop the depression prediction system using different techniques. The system consists of two parts, the Front End and Backend.
3.1 Front end part:
This part consists of Headline followed by HTML pages. The First page is login page consist of user id and password of the user and if the user is new then there is another option called new user which generates the registration form. All the data is stored using mySQL database system. The second page consists of three options which are nothing but the techniques used to predict depression, i.e., by using Question and Answer test (psychometric test) which has questionnaire and user have to give the answers. These answers are stored in SQL database. After calculating scores, the final score will be displayed and result, i.e., user is depressed or not will be declared.
Another option to predict depression is using EEG (Electroencephalogram) signal of the user. The EEG signal is recorded using mindwave neurosky kit or Neuro Compact Portable Neuromax -32 channel Digital EEG Machine and values from that graph is calculated and this file is given to the system which has trained using machine learning algorithm. So, result will be displayed.
Fig- 3.2 EEG Machine
The third option is sentiment analysis using twitter data of the user. In this part the users comment on social media like twitter are captured and the comment is classified as depressed or non-depressed.
3.2 Back-end part:
In this part all the backend operations like programming, training and testing of the system using one or more machine learning algorithms are done. There are three different back-end sections for three different parts of the systems.
Q&A part:
Here the psychometric test is taken by system which consists of different questions based on BECK’s inventory for psychometric tests.
EEG Signal Processing and Analysis:
In this part, EEG signal processing is done. The system is trained using the database of the depressed EEG signals and non-depressed EEG signals. This is done by using machine learning algorithm, i.e. Neural Network Algorithm. The algorithm is used to classify the database as depressed and non-depressed. After that for testing is done by giving user’s EEG data.
There are 3 phases in the system of EEG signal processing for depression measurement:
1. Preprocessing
2. Creating Neural Network
3. Training phase
4. Testing phase
Sentiment Analysis using Twitter Comments:
In this part, sentiment analysis is done using social media comments from user. It is done by using two algorithms individually, i.e., Naïve Bayes and Random Forest algorithms.
The algorithm for this part is given as follows:
1. Prepare raw tweet data
2. Print length of tweet data
3. Print length of labels
4. Preparing tweets & their labels
5. Print length of tweets
6. Transform labels from 1, 0, -1 to ‘Not Depression’, ’Neutral’, ’Depression’.
7. Frequency count
8. Apply naïve bayes model.
4. RESULT AND ANALYSIS
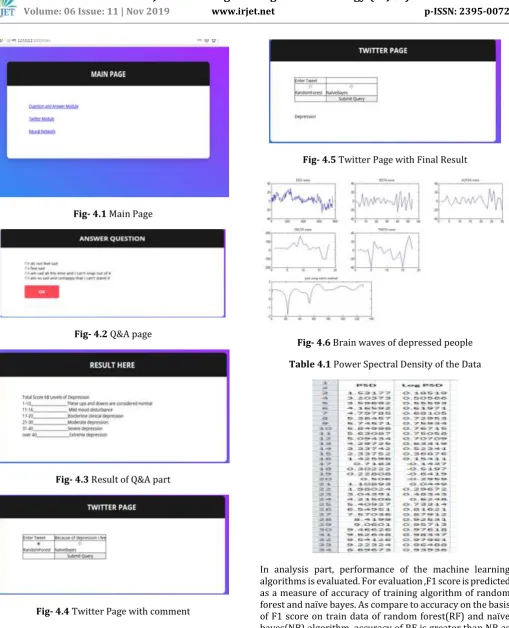
Fig- 4.1 Main Page
Fig- 4.2 Q&A page
[image:5.595.48.558.60.689.2]Fig- 4.3 Result of Q&A part
Fig- 4.4 Twitter Page with comment
Fig- 4.5 Twitter Page with Final Result
[image:5.595.361.508.438.614.2]Fig- 4.6 Brain waves of depressed people
Table 4.1 Power Spectral Density of the Data
Chart 4.1: Evaluation of Random forest
Chart 4.2: Evaluation of Naïve Bayes
Chart 4.3: Comparison Between Accuracy of Random Forest(RF) And Naïve Bayes(NB)
5. CONCLSION AND FUTURE SCOPE
This project gives the effective system to diagnose the depression. While developing this system, various technologies and machine learning concepts and programming languages have been studied. Also, the functioning of EEG machine has been studied. This system gives access remotely without going to psychiatrists and save the bills of hospitals for EEG checkup. This system would prove to be cost efficient, time saving and yet produce the results with high accuracy and quality.
Future Scope:
Can be used in hospitals
Can be used in schools and colleges and other organizations to maintain the records of students and employee’s mental health checkup by adding questionnaire based on students and employee’s life.
Can be used by psychiatrists to diagnose by using more than one technique.
Can be used to detect mental health in government programs like to detect depression among farmers by adding some more questionnaire based on farmer’s lifestyle.
REFERENCES
1] H. M. Mallikarjun and H. N. Suresh, "Depression level prediction using EEG signal processing," 2014 International Conference on Contemporary Computing and Informatics (IC3I), Mysore, 2014, pp. 928-933.
doi:10.1109/IC3I.2014.7019674
http://ieeexplore.ieee.org/stamp/stamp.jsp?tp=&arnumber =7019674&isnumber=7019573
2] Renu Gautam and Mrs. Shimi S.L, “ Features Extraction and Depression Level Prediction by Using EEG Signals” International Research Journal of Engineering and Technology (IRJET) Volume: 04 Issue: 05 , May -2017, e-ISSN: 2395 -0056 , p-e-ISSN: 2395-0072.
https://www.irjet.net/archives/V4/i5/IRJET-V4I5526.pdf
3] B. Hosseinifard, M. H. Moradi and R. Rostami, "Classifying depression patients and normal subjects using machine learning techniques," 2011 19th Iranian Conference on Electrical Engineering, Tehran, 2011, pp. 1-1. http://ieeexplore.ieee.org/stamp/stamp.jsp?tp=&arnumber =5956021&isnumber=5955412
International Symposium on Autonomous Decentralized System (ISADS), Bangkok, 2017, pp. 277-280.
doi:10.1109/ISADS.2017.41