Abstract—In most industrial solid processing operations, the separation of particles is important and designed based on the terminal settling velocity as the chief operating parameter. This settling velocity is dependent on characteristic particle properties like size, density, and shape. In this work, multi-stage separation experiments of sand and gravel have been performed using different channel velocities and mass loadings of the air. The performance has been analyzed and discussed with respect to the separation functions, and characteristic parameters as separation sharpness and product quality. Furthermore, the SMART analysis is used to evaluate different parameter configurations.
Index Terms—multi-stage separation, turbulent air
flow, zigzag apparatus
I. INTRODUCTION
HE treatment of raw materials, intermediates, products, and wastes is one of the most important processes in various process industries, which depends very much on the quality of separation. Separation by particle size is mostly done by sieving. For lower cut points (approximately d < 1 mm), air classifying performs better because fine particles often adhere to and block the openings of the sieves. One apparatus for air classifying is the zigzag air classifier which is known for a long time [1], [2], [3]. It is industrially used for classifying shredded PET bottles [4], municipal solid waste [5], or the separation of scrap cable or stalks and leaves in tea and tobacco industry [6].
The main advantage of multi-stage air classifying is the wide range of possible cut sizes in the range of micrometers to few millimeters. Sorting (separation by density) can be done within a wide density range as well. Separation is done based on the differences in the settling velocity which is the characteristic parameter and is determined by particle properties as size, density, and shape [6].
Obviously, the air velocity in the separation chamber characterizes the particle dynamics with respect to the flow direction. Due to this fact, the zigzag air classifier has a wide field of possible applications. The mass flux of one stage is between 5 and 15 t/(m∙h) which offers an increasing
Manuscript received March 05, 2014.
This work is part of the priority program SPP 1679 (Dynamiche Simulation vernetzter Feststoffprozesse” and is supported financially by the Deutsche Forschungsgemeinschaft (DFG).
H. Gloeckner (corresponding author, phone: +49-391-67-51886, e-mail: [email protected]) and J. Tomas ([email protected]) are with the chair of Mechanical Process Engineering, University of Magdeburg, 39106 Germany.
T. Hagemeier ([email protected]) is with the chair of Thermal Process Engineering, University of Magdeburg, 39106 Germany.
C. Roloff ([email protected]) and D. Thévenin ([email protected]) are with the chair of Fluid Dynamics and Technical Flow, University of Magdeburg, 39106 Germany.
throughput while using several channels in parallel. The number of stages affects the separation performance, too, since, at every stage, separation of fine and coarse (or light and heavy) particles occur as the particles flow across the air stream. Therefore, every particle which leaves the channel has been separated several times which leads to high operational efficiency. Additionally, the process can be linked to pneumatic conveying without the requirements for any additional device [6].
However, there are several disadvantages: fluctuating material properties of the feed (such as size, density, and shape) which are generated e.g. by segregation in the silo, eventually lead to local and temporal fluctuations of the mass loading of air. This affects the efficiency of the separation operation and the pressure drop in a negative way. Due to these fluctuations, pulsating air streams may be caused and may affect the process in a negative way. All in all, the unknown dynamics of the process lead to insufficient reliability of the operation and lower purity of the product than expected. Furthermore, the improved separation efficiency with an increasing number of stages causes additional pressure loss and hence leads to higher energy consumption.
Worrel and Vesilind [7] investigated the separation performance of different air classifiers containing various throat configurations. They used municipal solid waste (MSW) to separate light (paper and plastics) and heavy (aluminum and steel) materials and introduced a new concept to evaluate the performance. The total efficiency was defined as the product of the fractional recoveries of light and heavy material in the overflow and underflow. Therefore, the highest efficiency of 100 % can only be reached if 100 % of the lightweight material is discharged as light product and 100 % of the heavyweight material is delivered as heavy product.
The performance of zigzag air classifiers at low particle concentrations has been investigated by Senden [5] who used square pieces of paper and porous polystyrene spheres as test materials during the experiments. He analyzed the influence of different channels depths and bending angles (90°, 120°, 150°) and found the 150° case showing the highest separation efficiency associated with an enormous increase of particle residence time. Furthermore he developed a stochastic model to describe the separation behavior based on observations of every single stage. Rosenbrand [8] extended Senden’s model [5] for high particle using a dimensionless correlation.
Veselind and Henrikson [9] studied the influence of feed rate on separation performance in a zigzag channel with a bending angle of 120° using square-shaped plastic and aluminum pieces. It was shown that particle residence times decrease with increasing feed rate as well as the separation
Experimental Investigation on the Multistage
Particle Classification in a Zigzag Air Classifier
H. Gloeckner, T. Hagemeier, C. Roloff, D. Thévenin, J. Tomas
efficiency. Both effects were ascribed to a rising particle-particle collision frequency.
For performance comparison of different air classifiers, Biddulph and Connor [10] developed a simple test based on the estimation of effective diffusivity where good separation efficiencies are connected with low diffusivities.
Tomas and Gröger [11] [12] developed a model to describe the separation performance in a zigzag air classifier. This model agreed well with experimental data gained by separation experiments of glass beads, sand, split, and gravel at low mass loadings of the air. One important advantage of their model is the flexible application on separations by size, density, and shape. The zigzag air classifier was found to perform satisfactory to good separations at low energy consumptions.
The separation of PET flakes by particle shape in a zigzag separator has been studied by Friedländer et al. [4]. Using low mass loading of the air, the process showed good separation efficiency.
Furthermore, there are several works recorded in literature (e.g. Gillandt [13], He [14]) concerning the simulation of one- and multi-phase flows in zigzag shaped channels with no special focus on parameters influencing the separation performance.
The aim of this work is to investigate the influence of channel velocity and mass loading of the air on the classifying of sand. Therefore, several experiments at different conditions have been performed and analyzed. In order to enhance the process quality, an approach from economics is introduced to evaluate the suitability of varying channel velocities and mass loadings.
II. THEORETICAL BACKGROUND
In most solid processes, the separation of particles is designed based on the terminal settling velocity as the separation parameter. Built on the force balance of a particle, the quasi-stationary settling velocity
v 2 V ρ ρ g
c ρ A
(1)
depends on the particles cross-sectional area Ap, its volume Vp, particle density ρp, fluid density ρf, and gravity g. The drag coefficient cw depends on the fluid flow around the particle which is described by the particle Reynolds number
Re u d ρ
η . (2)
In this case, u is the relative velocity between fluid and particle, dp the particle diameter, and η the fluid viscosity. [15] [16] Using approximations like
c 24
Re 4
√Re 0.4 (3)
by Kaskas [17] or
c 24
Re 1 0.1806 Re .
0.4251
1 6880.95Re (4) by Haider and Levenspiel [18], the drag coefficient can be derived for ideal spheres in a wide range of Reynolds numbers (Re < 2∙105).
The separation function
T ξ m ,
m ,
m m
μ ,
μ , (5)
describes the particle separation quality of a separation attribute ξ. It is defined as the ratio of mass flow rate of the coarse product in the underflow and the mass flow rate of the feed. According to Tomas and Gröger [11] [12],
T d d 1 1 V V α
∙ (6)
can be used to approximate the measured separation function where V /V is the volumetric flow rate ratio of air in over and under flow containing the fine and coarse particles. The parameter α = 0.5 is characterized by the inertial (Newton) range of single particle turbulent flow-around (particle Reynolds number Rep > 103) and z is the number of separation stages (units). This stage number z is used to fit the experimental curves. Furthermore, the effective total number of stages
n 2 ∙ z 1 (7)
is derived for a symmetrical zigzag separator with similar number of stages in over- and underflow (zo = zu = z). Additionally, a so-called separation stage utilization coefficient
η n
n (8)
describes the ratio of effective and real number of stages. [11] [12]
The separation sharpness
κ d
d
z ∙ ln V
V ln 3
z ∙ ln V
V ln 3
(9)
offers another possibility to describe the goodness of separation and is influenced by the characteristic diameters d25 and d75. Depending on its value, the separation can be characterized as sufficient (0.3 < κ < 0.6), good (0.6 < κ < 0.8), very good (0.8 < κ < 0.9), and (perfect κ = 1) [11] [12]. The mass-specific energy consumption
E Δp V
m (10)
depends on the total pressure drop Δp, the volumetric air flow V, and mass flux of the feed m . It is used to compare different configurations based on the amount of used energy. According to Worrel and Vesilind [7], the total efficiency
μ μ ∙ μ 1 Q , d ∙ Q , d (11)
is a function of the product purities of overflow μo and underflow μu and can be derived from the particle size distributions of both products Q3,o(dT) and Q3,u(dT) at the cut point dT, since they describe the fraction of misplaced product.
Later on, the different alternatives will be ranked by their goodness using Edwards’ SMART (Simple Multi-Attribute Rating Technique) analysis. Using this approach, every attribute i is connected with a weight wi, while all weights have to add to unity. Via
S r r,
r, r, (12)
all derived outcomes ri are connected with a score Si. Therefore, the overall score of a alternative is given by
S w S (13)
III. DESIGNOFPILOTPLANT
[image:3.595.54.297.103.292.2]The employed zigzag separator consists of a flow channel that is parted into seven segments of uniform height h = 400 mm, width b = 200 mm and depth t = 200 mm. These segments are connected under a bending angle α = 120 ° (see Figure 1).
Figure 1: Segment/stage of the zigzag air classifier The air flows upwards and generates eddies in each corner of the channel. This leads to an additional particle dispersion and enhances separation. Each stage acts as a single cross-flow unit. Consequently, the zigzag apparatus is also known as multi-stage cross-flow classifier [11] [12].
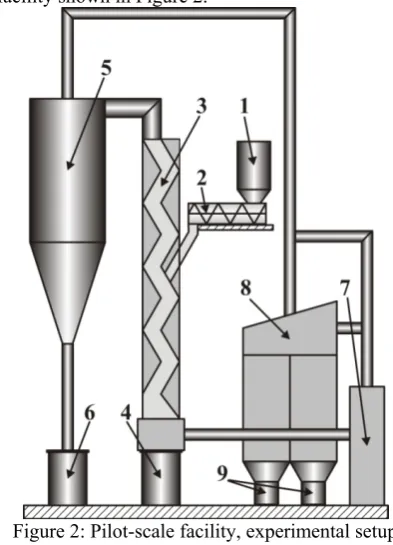
In this study, the zigzag classifier is the center of a pilot-scale facility shown in Figure 2.
Figure 2: Pilot-scale facility, experimental setup The facility components and the path of the solid material through the facility are described next. The particle feed is fed from the hopper (1) into the zigzag channel (3) via the screw feeder (2). An air flow is generated by a fan (7) and enters the zigzag channel (3) at the bottom. The air flows upwards in counter direction to the coarse/heavy particles that leave the channel at the underflow (index u). They are collected in the bottom bin (4). The air flow, loaded with the fine/light particles leaves the overflow (index o) and is fed
to the cyclone (5) where the particles are separated from the air flow. The fine particles are collected in another bin (6). In order to separate the finest particles also from the air flow cycle, the contaminated air can be filtered (8). The filter porosity can be adapted to the actual requirements and the finest particle fraction is collected in (9).
The separation experiments have been performed using fine sand (dsand = 0.1…1.2 mm) of high sphericity (Φsand = 0.89). The particle density was ρsand = 2665 kg/m3. Figure 3 shows the particle size distributions of sand.
Figure 3: Particle size distributions of used materials The channel velocities have been varied by + 10 % from the initial velocity. Additionally, the mass loading of the air has been changed by different justifications of the screw conveyor from μ = 0.1, 0.2, 0.5, and 1.0. Due to technical reasons, the occurring mass loadings differ a little bit from the wanted values. However, these values have been derived by the ratio of the mass flows of air and solid neglecting accumulation in the channel. All in all, there are twelve different parameter configurations while every configuration is repeated five times.
IV. RESULTS
In the following, the separation experiments of sand are analyzed. After the evaluation of channel velocity and mass loading of the air the most important characteristic values will be shown and described. These values are also compared to the classification results of Tomas and Gröger [11] [12].
The approximations based on equation (6) show very high agreement with the experimental data in all cases (R2 > 0.98). Therefore, only the approximated functions will be used in this work.
The evaluation by SMART analysis is done with respect to energy consumption (w1 = 0.3) describing the costs of the process, mass throughput (w2 = 0.3) as “earnings” and separation sharpness (w3 = 0.2) as well as total efficiency (w4 = 0.2) describing the product quality. On the other hand, the cut diameter is neglected in order to show how air velocity and mass loading affect the overall process.
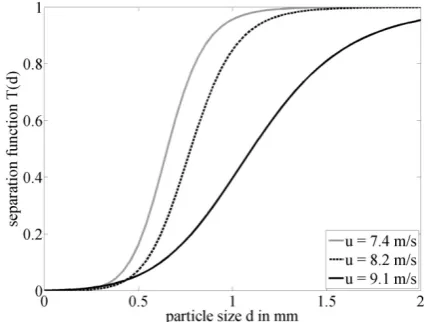
[image:3.595.322.547.182.354.2] [image:3.595.71.268.396.669.2]Figure 4: Approximated separation functions for sand at mass loadings of μ = 0.1
Figure 5: Approximated separation functions for sand at mass loadings of μ = 1.0
Due to Figure 4, the channel velocity has a strong
influence on the separation function as the separation functions for higher velocities are shifted to bigger particle sizes and also become a little less steep. Whereas the difference between the curves for u = 7.4 m/s and u = 8.2 m/s is relatively small the function at u = 9.1 m/s differs very much in position and shape. On Figure 5, the influence of the channel velocity seems to be much weaker. All curves exhibit nearly the same cut diameter of approximately 0.6 mm while an increasing air velocity affects the functions’ slope. With increasing channel velocity the slope decreases.
Therefore, the channel velocity has on important influence on position and shape of the Tromp curve as an increasing air velocity increases the cut diameter and decreases the slope of the function. On the other hand, an increasing mass loading of the air brings the cut diameter to lower values and decreases the differences between the separation functions, too.
A better view on cut diameters on different configurations is given in Figure 6.
Figure 6: Cut diameters of sand depending on mass loading
As it was shown in the previous figure, channel velocity and mass loading affect the cut diameter in an opposite way. For the highest velocity the cut diameter decreases from 1.10 mm to 0.60 mm at the highest mass loading whereas the difference for both other curves is much lower. In case of u = 8.2 m/s, cut sizes dT = 0.60…0.78 mm result while dT = 0.57…0.65 results for u = 7.4 m/s. As the right diagram shows, too, the influence of the mass loading on the separation function depends also on the channel velocity as the differences between the curves are maximized for μ = 0.1 and minimized for μ = 1.0.
In contrast to these results, much higher values are found in literature. Tomas and Gröger [11] [12] found dT = 2.1 mm for the separation of sand and split at μ = 0.3 and a channel velocity u = 7.5 m/s, which are nearly similar to the conditions of the experiments. Therefore, the cut size of Tomas and Gröger [11] [12] is approximately twice as high as the highest value in this work and three times the value approximated based on Figure 6.
[image:4.595.68.284.268.430.2]Figure 7 shows the separation sharpness for the separation of sand.
Figure 7: Separation sharpness of sand depending on mass loading
[image:4.595.323.541.522.683.2]loading decreases the separation sharpness to κ = 0.64…0.66. The worst values are found for the highest channel velocity. After a slight increase of separation sharpness (κ = 0.65…0.66) with increasing mass loading from μ = 0.1…0.2, higher mass loadings decrease the separation sharpness as the global minimum κ = 0.60 is found for μ = 1.0. Figure 7 b) shows clearly how an increase of channel velocity decreases the separation sharpness.
All values of the separation sharpness can be summarized as “good” (κ = 0.60…0.80) while an increasing channel velocity decreases the sharpness. The separation sharpness (κ = 0.75) from Tomas and Gröger [11] [12] corresponds relatively well with these results.
[image:5.595.66.284.243.404.2]The separation stage utilization for the separation of sand is shown in Figure 8.
Figure 8: Separation stage utilization of sand depending on mass loading
Due to Figure 8, the influence of channel velocity on the separation stage utilization is bigger than the influence of mass loading. An increase of channel velocity decreases the utilization while the mass loading affects this parameter the other way around. Therefore, the best values are accomplished for low channel velocities and high mass loadings. However, separation sharpness utilizations are very low (η = 0.11…0.24) in all cases. Tomas and Gröger [11] [12] reported a much bigger value of η = 0.26.
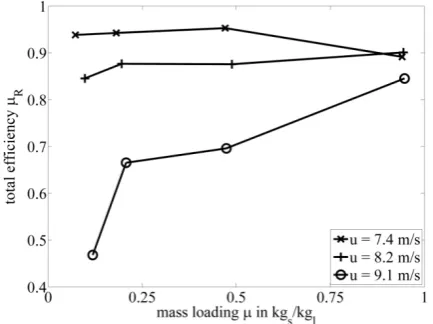
[image:5.595.324.540.346.508.2]Analogically to Worrel and Vesilind [7], Figure 9 shows the total efficiency of the single separation experiments.
Figure 9: Total efficiency for the separation of sand depending on mass loading
Depending on the air velocity, big differences between the curves emerge. In case of u = 7.4 m/s, high product purities occur for low to medium mass loadings μ = 0.93…0.95 while a high mass loading is referred to good quality μR = 0.89. For both other channel velocities, an increasing mass loading increases the total efficiency, too. For u = 8.2 m/s the product quality increases from μR = 0.85 to μR = 0.90. The worst quality is connected with u = 9.1 m/s and μ = 0.1 (μR = 0.47) whereas at high mass loading a good purity (μR = 0.85) occurs. The very low efficiency is caused by the fact that at this point a very high cut diameter is connected with the process which leads to a very high amount of fine product referred to the feed. Therefore, only a small part is derived as coarse product as small impurities have a strong effect on the total efficiency. Additionally, it is obvious that an increasing channel velocity decreases the product purity very intensely, whilst this effect is weakened with increasing mass loading of the air. At μ = 1.0 the product quality nearly becomes constant at μR = 0.85…0.90.
In literature, no report to the product quality for multi-stage air classifying in form of the total efficiency exists.
In order to evaluate the goodness of the investigated configurations, Figure 10 shows the SMART scores for all alternatives.
Figure 10: SMART score for the separation of sand depending on mass loading
In regard of Figure 10, mass loading and channel velocity have an important effect on the overall process. Low channel velocities and lower solid mass fluxes cause better results at all mass loadings (S = 37….87 %). A channel velocity of u = 8.2 m/s leads to similar SMART scores of S = 36….84 %. In case of u = 9.1 m/s the worst value (S = 13 %) occurs for the lowest mass loading but increases to sufficient values (S = 74 %) at μ = 1.0. For the highest mass loadings the best values (S = 74….87 %) are caused. Additionally, there is a gap between all curves. Furthermore, an increasing channel velocity decreases the SMART score while this effect is weakened with increasing mass loading.
[image:5.595.66.283.593.755.2]V. CONCLUSIONS
In this work, twelve different combinations of mass loading of the air and channel velocity have been investigated for the separation of sand. The results have been compared with data from the literature [11] [12].
It has been found that an increase of the channel velocity increases the cut diameter, too. Additionally, the mass loading of the air decreases this parameter while all curves nearly had the same value at the highest mass loading. Regarding the separation of sand, the influence of the channel velocity has been nearly the same value whereas the mass loading merely seemed to be of minor importance. Furthermore, the cut sizes have been found to be only half as capacious as the values proposed in the literature.
Concerning the separation sharpness, an increasing channel velocity as well as a decreasing mass loading decreases this parameter. All in all, sufficient to good values have been determined for all configurations. They also corresponded fairly well with the data found in literature.
With reference to the separation stage utilization, values less than ηT = 0.25 occurred for both materials and all configurations despite one outlier. Tomas and Gröger [11] [12] found similar low values.
Additionally, the total efficiency proposed by Worrel and Vesilind [7] was used to describe the quality of both (fine and coarse) products. The mass loading was found to be of minor importance as only one curve (separation of sand, highest velocity) was affected by it. The reason lays in the cut diameter because the increased mass loading decreased the cut diameter which had been near the upper limit of the particle size distribution. Furthermore, the product quality was found to decrease with increasing channel velocity.
Additionally, the SMART analysis by Edwards showed good appliance to give an overview of the goodness of the possible configurations. Using this technique, it was shown that high mass loadings and low channel velocities produce the best results.
All in all, the importance of turbulence on the overall process was shown as it disperses the solid fluxes. On the other hand, for higher channel velocities turbulence seemed to disturb the performance as separation sharpness and product quality decrease. Therefore, the turbulence seems to have been too high to be compensated by the mass loading of the air. Due to this reason, an optimal working point is hardly detected yet.
As the cut diameters of sand have been much to low compared with the literature data, further investigations should focus on error diagnostics. On this purpose, a study using computational fluid dynamics (CFD) may be useful to find the sources of errors.
REFERENCES
[1] Stebbins, A. H., Air classifier, US-Patent 1861248, 1930
[2] Kaiser, F., Der Zickzack-Sichter – ein Windsichter nach neuem Prinzip, Chemie-Ingenieur-Technik 1963 (35) 4, p. 273-282
[3] Fastov, B. N., Valuskii, P. F., Lebedev, V. N., Oskalenko, G. N.,
Testing of the zigzag classifier for granulated materials, Chemical
and Petroleum Engineering 1975, 11 (5), p. 477-479
[4] Friedländer, T., Kuyumcu, H. Z., Rolf, L., Untersuchung zur Sortierung von PET-Flakes nach der Teilchenform,
Aufbereitungstechnik 2006, 47 (8+9), p. 24-38
[5] Senden, M. M. G., Stochastic models for individual particle behavior in straight and zig zag air classifiers, Dissertation, Technische Universität Eindhoven 1979
[6] Furchner, B., Zampini, S., Air Classifying, Ullmann’s Encyclopedia of Industrial Chemistry, Volume 2, WILEY-VCH Verlag GmbH & Co. KgaA, Weinheim 2012, p. 215-234
[7] Worrell, W. A., Vesilind, P. A., Testing and evaluation of air classifier performance, Resource Recovery and Conservation 1979, 4, S. 247-259
[8] Rosenbrand, G. G., The separation performance and capacity of zigzag air classifiers at high particle feed rates, Dissertation,
Technische Universität Eindhove, 1986
[9] Vesilind, P. A., Henrikson, R. A., Effect of feed rate on air classifier performance, Resources and Conservation 1981, 6, p. 211-221 [10] Biddulph, M. W., Connor, M. A., A Method of Comparing the
Performance of Air Classifiers, Resources, Conservation and
Recycling 1989, 2, p. 275-286
[11] Tomas, J., Gröger, T., Mehrstufige turbulente Aerosortierung von Bauschutt, Aufbereitungs-Technik 1999, 40 (8), p. 379-386
[12] Tomas, J., Gravity Separation of Particulate Solids in Turbulent Fluid Flow, Particulate Science and Technology 2004, 22, p. 169-188
[13] Gillandt, I., Fritsching, U., Riehle, C., Zur mehrphasigen Strömung in einem Zick-Zack-Sichter, Forschung im Ingenieurwesen 1996, 62 (11/12), p. 315-321
[14] He, Y., Wang, H., Duan, C., Song, S., Airflow fields simulation on passive pulsing air classifiers, The Journal of the South African
Institute of Mining and Metallurgy 2005, 105, p. 525-532
[15] H. Schubert (Hrsg.), Handbuch der Mechanischen Verfahrenstechnik, 1. Auflage, WILEY-VCH Verlag GmbH & Co KgaA, Weinheim
2003
[16] M. Stieß, Mechanische Verfahrenstechnik – Partikeltechnologie 1, 3.
vollständig neu bearbeitete Auflage, Springer-Verlag, Berlin, Heidelberg 2009
[17] Kaskas, A. A., Schwarmgeschwindigkeiten in Mehrkornsuspensionen am Beispiel der Sedimentation, Dissertation, TU Berlin 1970
[18] Haider, A., Levenspiel, O., Drag Coefficient and Terminal Velocity of Spherical and Nonspherical Particles, Powder Technology 1989, 58
(1), p. 63-70