ORIGINAL RESEARCH
The Contributions of MRI-Based Measures of
Gray Matter, White Matter Hyperintensity, and
White Matter Integrity to Late-Life Cognition
J. He V.S.S. Wong E. Fletcher P. Maillard D.Y. Lee A.-M. Iosif B. Singh O. Martinez A.E. Roach S.N. Lockhart L. Beckett D. Mungas S.T. Farias O. Carmichael C. DeCarli
BACKGROUND AND PURPOSE: GM volume, WMH volume, and FA are each associated with cognition; however, few studies have detected whether these 3 different types of MR imaging measurements exert independent or additive effects on cognitive performance. To detect their extent of contribution to cognitive performance, we explored the independent and additive contributions of GM atrophy, white matter injury, and white matter integrity to cognition in elderly patients.
MATERIALS AND METHODS: Two hundred and 9 elderly patients participated in the study: 97 were CN adults, 65 had MCI, and 47 had dementia. We measured GM on T1-weighted MR imaging, WMH on FLAIR, and FA on DTI, along with psychometrically matched measures of 4 domains of cognitive performance, including semantic memory, episodic memory, executive function, and spatial abilities.
RESULTS: As expected, patients with dementia performed significantly more poorly in all 4 cognitive domains, whereas patients with MCI performed generally less poorly than dementia patients, though considerable overlap in performance was present across groups. GM, FA, and WMH each differed significantly between diagnostic groups and were associated with cognitive measures. In multivariate models that included all 3 MR imaging measures (GM, WMH, and FA), GM volume was the strongest determinant of cognitive performance.
CONCLUSIONS:These results strongly suggest that MR imaging measures of GM are more closely associated with cognitive function than WM measures across a broad range of cognitive and functional impairment.
ABBREVIATIONS:AD⫽Alzheimer Disease; CC⫽corpus callosum; CN⫽cognitively normal; FA⫽ fractional anisotropy; GM⫽ gray matter; ICC⫽ intraclass correlation coefficient; MCI ⫽mild cognitive impairment; MDT⫽minimum deformation template; RS⫽recruitment source; SLF-FP⫽ superior longitudinal fasciculus, frontal part; TCV⫽total cranial volume; UNC⫽uncinate fasciculus; WMH⫽white matter hyperintensity
M
R imaging– based brain volumetric measurements are widely used in clinical studies of aging, mild cognitive impairment, and dementia, particularly Alzheimer disease. Multiple reports confirm that global GM loss is significantly associated with advancing age and the onset and progression of AD.1The extent of GM loss in AD is associated with cogni-tive performance.1,2In addition, increased WMH burden on FLAIR MR imaging has been observed in both MCI3,4and clinical AD,3,5 and is associated with diminished episodic memory and executive function.6,7More recently, studies of white matter microstructural integrity using FA derived from DTI8,9have shown that FA in the temporal lobe, posterior cingulum bundle, and fornix is reduced in dementia10,11andMCI,12while FA in the corpus callosum may be reduced in CN elders.13Reduced FA in these tracts is also associated with poor memory performance.14
Prior studies, however, have generally failed to assess whether different types of MR imaging measurements exert independent or additive effects on cognitive performance. Addressing this issue could have important implications for understanding the biologic underpinnings of age-associ-ated cognitive decline, MCI, and dementia. In particular, because GM loss probably reflects injury to the neuronal soma and dendritic arborizations, whereas WMH and FA reflect injury to axonal tracts, and both aspects of brain structure are critical to higher-order cognition, each of the MR imaging measurements has the potential to be indepen-dently associated with loss of cognitive abilities. However, it is also possible that 1 of these forms of brain injury has a greater impact on brain function and thus has the greatest biologic impact.
In this study, we measured GM, WMH, and FA in a diverse population of 209 community-dwelling elders and assessed their independent strengths of association with psychometri-cally matched measures of semantic memory, episodic mem-ory, executive function, and spatial ability. We combined these 3 MR imaging measures into unified models to examine how strongly individual biologic substrates, as measured by MR imaging, are associated with cognitive function.
Received October 31, 2011; accepted after revision December 11.
From the Imaging of Dementia and Aging (IDeA) Laboratory (J.H., E.F., P.M., D.Y.L., B.S., O.M., A.E.R., S.N.L., O.C., C.D.), Departments of Neurology (V.S.S.W., D.M., S.T.F., O.C., C.D.), and Public Health Sciences (A.-M.I., L.B.), University of California, Davis; and Department of Neuropsychiatry (D.Y.L.), Seoul National University, College of Medicine, Seoul, Korea.
This research was supported by NIH grants: P30 AG10129, R01 AG010220, R01 AG 031563, R01 AG021028, and K01 AG 030514.
Please address correspondence to Jing He, Imaging of Dementia & Aging (IDeA) Labora-tory, Department of Neurology, University of California, Davis, 1544 Newton Ct, Davis, CA 95618; e-mail: [email protected]
Indicates open access to non-subscribers at www.ajnr.org
http://dx.doi.org/10.3174/ajnr.A3048
BRAIN
ORIGINAL
Materials and Methods
Participants
Participants were recruited through both memory clinic referrals and community outreach. Participants included patients with complaints of cognitive problems and cognitively normal controls. To be in-cluded in the study, participants had to be older than 60 years. Exclu-sion criteria were limited to unstable major medical illness, major primary psychiatric disorder (history of schizophrenia, bipolar disor-der, or recurrent major depression), and substance abuse or depen-dence in the last 5 years. Each of the participants signed informed consent approved by the University of California, Davis, institutional review board. The sample consisted of 209 participants. Most partic-ipants (n⫽138; 66.0%) were recruited from the community using protocols designed to enhance demographic diversity,15whereas 71
participants (34.0%) were recruited from memory clinics.
Clinical Evaluation
Each participant received a multidisciplinary clinical evaluation through the University of California, Davis, Alzheimer Disease Cen-ter, which included a detailed medical history, physical examination, and neurologic examination. All participants received a standardized neuropsychological test battery that was distinct from the outcome measures in our analyses.
Each participant was diagnosed at a consensus conference by a clinical team. Ninety-seven CN patients, 65 diagnosed with MCI and 47 diagnosed with dementia, were included in this study. Among the patients with dementia, 79.5% were diagnosed with probable AD, 11.4% were diagnosed with AD mixed with cerebro-vascular dementia, 4.5% were diagnosed with Lewy body dementia or mixed Lewy body dementia and AD, 2.3% were diagnosed with cerebrovascular dementia, and 2.3% were diagnosed with fronto-temporal lobar degeneration. Dementia was diagnosed using the
Diagnostic and Statistical Manual of Mental Disorders, 4th edition-revised criteria16for dementia, modified to exclude the
require-ment of memory impairrequire-ment. Underlying etiology was deter-mined according to standardized criteria and methods. MCI was diagnosed using a modified version of the Petersen criteria, which did not require cognitive complaints.17,18Participants were
con-sidered cognitively normal if they had no clinically significant cog-nitive impairment.
MR Imaging Acquisition
Brain imaging was obtained at the University of California, Davis, Imaging Research Center (Sacramento, California) on a 1.5T Signa Horizon LX Echospeed system (GE Healthcare, Milwaukee, Wis-consin) and an Eclipse machine (Philips Healthcare, Andover, Massachusetts) at the Veterans Affairs Medical Center, Northern California Health Care System (Martinez, California).19,20Brain
volume measures, including GM and TCV, were obtained from a T1-weighted fast-spoiled gradient recalled echo with TE⫽2.9 ms, TR⫽9 ms, and a flip angle⫽15°. Voxel size was 0.977⫻0.977⫻ 1.5 mm; WMH was determined from FLAIR imaging with TE⫽ 144 ms, TR⫽11,000 ms, TI⫽2250 ms, and a voxel size of 0.859⫻ 0.859⫻3 mm; FA was determined from DTI with TE⫽90.4 ms, TR⫽8000 ms, flip angle⫽90°, and a voxel size of 1.875⫻1.875
⫻5 mm. A rigorous protocol ensured the validity of the MR im-aging measures across differing scanners and analysts. ICCs be-tween new analysts, all previously trained analysts, and the neu-rologist were required to be above 0.95 and 0.95 for TCV and
WMH. Within-subject between-scanner agreement in TCV and WMH was strong (ICCs ⫽ 0.96, and 0.89). Within-subject agreement on the same scanner was strong (ICCs ⫽0.97 and 0.99).21
Four-Tissue Image Segmentation
Segmentation of GM, WM, and CSF was performed in native space T1-weighted images by an in-house computer program using a Bayes-ian maximum likelihood expectation-maximization algorithm.22
Tissue probabilities at each voxel were based on a combination of Gaussian intensity distributions and a Markov random field compo-nent for modeling tissue configurations within voxel neighbor-hoods.23Two in-house enhancements included 1) automatic
initial-ization via a high-dimensional image warp in which tissue probability maps in a template space were fitted to the native T1 images, and 2) edge detection to encourage homogeneous tissue labels within homo-geneous image regions. The segmentation of WMH was determined from subject FLAIR images using a semiautomated approach, as de-scribed previously.21Briefly, nonbrain elements were manually
re-moved from FLAIR images by operator-guided tracing of the dura mater in the cranial vault. The resulting corrected image was modeled as a mixture of 2 Gaussian probability functions, with the segmenta-tion threshold determined at the minimum probability between these 2 distributions, followed by a single Gaussian distribution fitted to the image data using an a priori threshold of 3.5 SD in pixel inten-sity above the mean to identify WMH. Intrarater and interrater reliability of these methods are high and have been published previously.24
Tissue Volumes and FA within ROIs
Linear alignment, followed by high-dimensional image warping, was performed to register native T1-weighted images to a MDT, as de-scribed previously.25These steps were then reversed to map
hand-traced ROIs from the space of the MDT back into native space. Global GM and WMH volumes were calculated by counting voxels within those labels throughout the brain. ICC between hand-traced brain volumes and this automatic method are greater than 0.90.
A WM probability map in the MDT space was created by labeling the WM voxels in each T1-weighted scan,26transforming the
result-ing WM masks to MDT space, and averagresult-ing the masks across the population. Thresholding this WM average map provided a binary WM mask in MDT space.
An average-young-adult FA map was also created in MDT space, as previously described,8to provide normative FA values for
compar-ison with the elderly participants in the present study. This map was made by transforming the FA images of 15 healthy young adults to MDT space (mean age⫽24.1⫾3.1 years, 60.0% male) and taking the FA average at each voxel.
FA Ratio Values
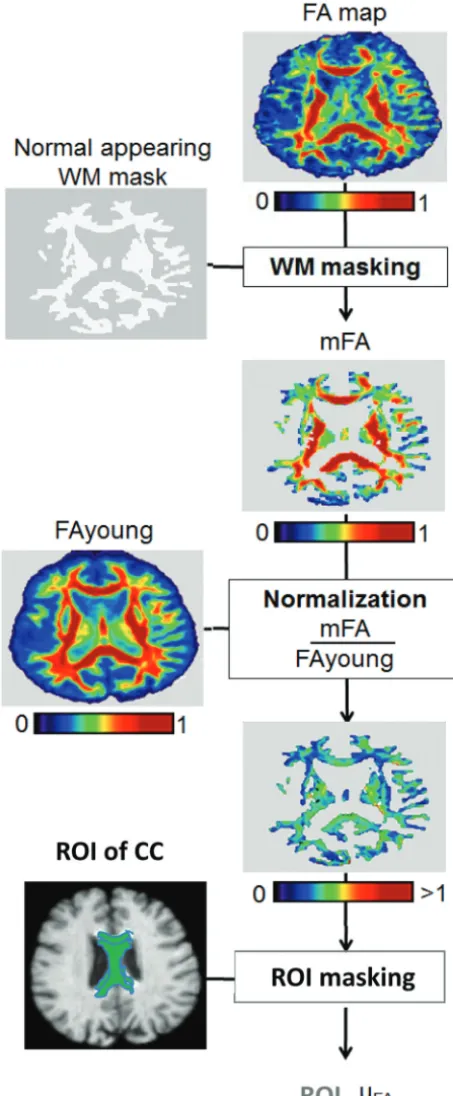
FA values were indexed against normative values to account for in-herent variability in FA that is caused by the intrinsic organization of WM tracts.8The WM mask described here was used to remove
re-gion of interest masks27to each individual FA ratio map, we
com-puted the means of FA ratio values within fornix, CC, cingulum, SLF-FP, and UNC ROIs for each subject (Fig 1).
Outcome Measures
Neuropsychological Measures.Spanish and English Neuropsy-chological Assessment Scales were used to measure 4 specific domains of cognitive functioning.28,29A subset of Spanish and English
Neuro-psychological Assessment Scales were combined using methods from item response theory to create composite measures: The semantic memory measure was based on object naming and picture association tests, the episodic memory measure was based on word list learning tests, and the spatial ability measure was based on pattern recognition and spatial localization tests. A composite executive function score was created from a set of fluency and working memory measures that have been previously developed using the same methods as the orig-inal Spanish and English Neuropsychological Assessment Scales.28
Statistical Analyses.WMH and GM volumes were divided by intracranial volume to avoid confounding effects of head size. WMH volume was also log transformed to better approximate a normal distribution for analysis, as previously described.19
Analyses of variance were used to detect diagnostic group differ-ences in demographics, cognitive performance, and MR imaging measures. Tukey-Kramer adjustment was used for post hoc analyses.
Pvalues smaller than .05 were considered statistically significant. Multiple regression models were used to examine the associations between MR imaging measures and cognitive performance, while ad-justing for the potential effects of sex, education, and recruitment source. Subject age was not used as a covariate in these adjusted mod-els because previous studies indicate that controlling for age may at-tenuate the associations between MR imaging variables and cognitive function in this sample.21,28Because there were 4 outcomes, we used
Bonferroni correction for multiple comparisons and set the␣level to .05/4.Pvalues smaller than this␣level were considered significant. All statistical analyses were performed in JMP 8 (SAS Institute, Cary, North Carolina).
Results
Diagnostic Group Differences
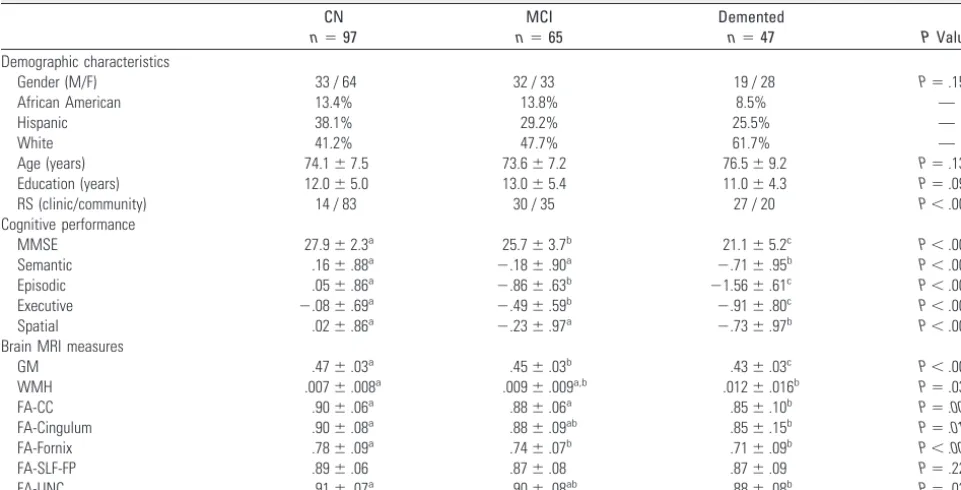
This study included 209 participants (average age 74.5⫾7.8 years). Sample sizes, demographic characteristics, composite cognitive scores, and MR imaging measures are summarized by diagnostic group in Table 1. Age (P⫽.13) and education (P ⫽.09) were not significantly different among the 3 diagnostic groups.
Cognitive Performance
Cognitive performance differed significantly across diagnostic groups (allP⬍.001) (Table 1 and Fig 2), though significant overlap in performance between groups was found. Patients with dementia, as expected, had significantly poorer cognitive performance than both CN (allP⬍.001) and MCI partici-pants (semantic,P⫽.02; spatial,P⫽.04; episodic,P⬍.001; executive,P⫽.01). MCI participants also scored significantly worse than CN participants in episodic memory and executive function (allP⬍.001) but not in spatial ability (P⫽.25) or semantic memory (P⫽.08).
Brain MR Imaging Measures
Among MR imaging measures, the GM volume differences between diagnostic groups were most pronounced (CN/De-mented and MCI/De(CN/De-mented,P⬍.001; CN/MCI,P⫽.008). Global WMH volume was significantly higher in the group Fig 1.Flow chart of FA normalization and masking of a region of interest (indicates
[image:3.594.54.281.46.595.2]with dementia compared with controls (P⫽.04). FA-CC (P⫽
.002), FA-Cingulum (P⫽.01), FA-Fornix (P⫽.002), and FA-UNC (P⫽.02) were each significantly lower in the group with dementia compared with the CN group; FA-CC was sig-nificantly lower in dementia compared with MCI (P⫽.05); and FA-Fornix was significantly lower in MCI compared with the CN group (P⫽.01). However, FA-SLF-FP did not differ significantly across diagnostic groups (Table 1 and Fig 2).
Individual MR Imaging Measures and Cognitive Performance
Diagnostic groups showed considerable heterogeneity and overlap in both cognitive performance and MR imaging mea-sures (Fig 2). Therefore, regression models controlling for sex, education, and recruitment source were used to assess the
as-sociations between continuous cognitive and MR imaging measures independent of clinical diagnosis. Models including individual MR imaging predictors suggested that poor perfor-mance in each cognitive domain was associated with smaller GM volume (semantic,b⫽6.14,P⫽.001; and episodic,b⫽
10.87; executive,b⫽6.95; spatial,b⫽7.65; allP⬍.001). Poorer episodic memory performance was associated with greater WMH volume (b⫽ ⫺.16,P⫽.006). Lower FA-Cin-gulum was associated with poor episodic memory (b⫽1.80,
[image:4.594.53.534.58.303.2]P⫽.004) and executive function (b⫽1.32,P⫽.005), and lower FA-fornix was associated with poor episodic memory (b⫽2.78,P⬍.001), executive function (b⫽1.71,P⫽.003), and spatial ability (b⫽2.10,P⫽.005). Associations between FA-SLF-FP or FA-UNC and cognitive measures were not sta-tistically significant (Table 2).
Table 1: Participant demographic characteristics, cognitive function, and MRI measures across diagnostic groups
CN
n⫽97
MCI
n⫽65
Demented
n⫽47 PValue
Demographic characteristics
Gender (M/F) 33 / 64 32 / 33 19 / 28 P⫽.15
African American 13.4% 13.8% 8.5% —
Hispanic 38.1% 29.2% 25.5% —
White 41.2% 47.7% 61.7% —
Age (years) 74.1⫾7.5 73.6⫾7.2 76.5⫾9.2 P⫽.13
Education (years) 12.0⫾5.0 13.0⫾5.4 11.0⫾4.3 P⫽.09
RS (clinic/community) 14 / 83 30 / 35 27 / 20 P⬍.001
Cognitive performance
MMSE 27.9⫾2.3a 25.7⫾3.7b 21.1⫾5.2c P⬍.001
Semantic .16⫾.88a ⫺.18⫾.90a ⫺.71⫾.95b P⬍.001
Episodic .05⫾.86a ⫺.86⫾.63b ⫺1.56⫾.61c P⬍.001
Executive ⫺.08⫾.69a ⫺.49⫾.59b ⫺.91⫾.80c P⬍.001
Spatial .02⫾.86a ⫺.23⫾.97a ⫺.73⫾.97b P⬍.001
Brain MRI measures
GM .47⫾.03a .45⫾.03b .43⫾.03c P⬍.001
WMH .007⫾.008a .009⫾.009a,b .012⫾.016b P⫽.03
FA-CC .90⫾.06a .88⫾.06a .85⫾.10b P⫽.003
FA-Cingulum .90⫾.08a .88⫾.09ab .85⫾.15b P⫽.01
FA-Fornix .78⫾.09a .74⫾.07b .71⫾.09b P⬍.001
FA-SLF-FP .89⫾.06 .87⫾.08 .87⫾.09 P⫽.22
FA-UNC .91⫾.07a .90⫾.08ab .88⫾.08b P⫽.03
Note:—Continuous variables (MRI measures, cognition scores, education years, and age) are presented as mean and SD; ethnicity data are presented as percentages across cognitive groups. Group differences determined by simple ANOVA; group differences of character variables determined bysquare. FA, ratio of young adult FA value; GM, percentage of total cranial volume; MMSE, Mini Mental State Examination.
a,b,c
Means with different superscripts indicate significant group differences after Tukey-Kramer adjustments, whereP⬍.05 was considered statistically significant.
[image:4.594.55.532.348.517.2]Correlations among MR Imaging Measures
Before including multiple MR imaging predictors into multi-ple regression models of cognitive performance, we used Pear-son correlations to assess whether colinearities among the MR imaging measures could influence their strengths of associa-tion with the cognitive outcomes. No strong associaassocia-tions among the MR imaging measures were detected (GM/WMH,
r⫽.20; GM/FA-Fornix,r⫽0.33; GM/FA-Cingulum,r⫽.26; GM/FA-CC,r⫽.25; WMH/FA-Fornix,r⫽ ⫺.31; WMH/FA-Cingulum,r⫽ ⫺.26; WMH/ FA-CC,r⫽ ⫺.37).
Multiple MR Imaging Measures and Cognitive Performance
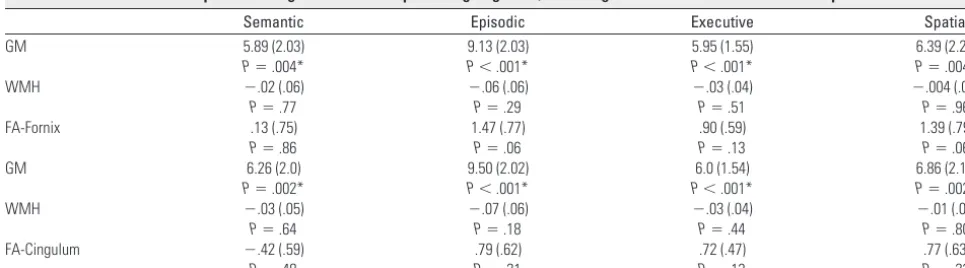
Because GM, WMH, FA-Cingulum, and FA-Fornix were each significantly associated with cognitive performance, all 3 mea-sures (GM, WMH, and FA) were added into multiple regres-sion models predicting each cognitive outcome with different models for each FA measure: FA-Fornix and FA-Cingulum. These models also included sex, education, and recruitment source as additional covariates (Table 3). In the models with GM, WMH, and FA-Fornix, smaller GM was still associated with poorer semantic memory (b⫽5.89,P⫽.004), episodic memory (b⫽9.13,P⬍.001), executive function (b⫽5.95,
P⬍.001), and spatial ability (b⫽6.39,P⫽.004), while none of the associations between these cognitive measures and FA-Fornix or WMH were statistically significant. Similarly, in the
model with GM, WMH, and FA-Cingulum, reduced GM was associated with poorer cognitive performance (semantic,b⫽
6.26,P⫽.002; episodic,b⫽9.50,P⬍.001; executive,b⫽6.0,
P⬍.001; spatial,b⫽6.86,P⫽.002), while WMH and FA-Cingulum were not significantly associated with any cognitive measures.
Discussion
[image:5.594.52.539.59.214.2]MR imaging measures of GM, WMH volumes, and FA are each independently associated with cognition.30-32However, few studies have examined whether these 3 different types of MR imaging measurements exert independent or additive ef-fects on cognitive performance. While GM atrophy, white matter integrity, and white matter injury were each individu-ally associated with cognitive performance in our study, only GM atrophy was associated with cognition in a multivariate model that included all 3 measures. Thus, while longitudinal measurement of the 3 brain injury measures and cognition are needed to fully understand their coevolution over time, our cross-sectional findings support the view that GM atrophy may be the most relevant MR imaging measurement of cogni-tive ability. We speculate that GM atrophy is more tightly tied to cognitive performance because it most specifically repre-sents neuronal injury, and neuronal injury appears to be the most important biologic process associated with cognition. We do not wish, however, to imply that injury to white matter Table 2: Results of the individual linear regression models predicting cognition for each individual MRI measure
Semantic Episodic Executive Spatial
GM 6.14 (1.90)
P⫽.001*
10.87 (1.92) P⬍.001*
6.95 (1.46) P⬍.001*
7.65 (2.07) P⬍.001*
WMH ⫺.06 (0.05)
P⫽.27
⫺.16 (.06) P⫽.0068
⫺.09 (.04) P⫽.04
⫺.08 (.06) P⫽.17
FA-CC .91 (.86)
P⫽.30
1.82 (.92) P⫽.05
1.24 (.68) P⫽.07
1.70 (.93) P⫽.07 FA-Cingulum .11 (.58)
P⫽.85
1.80 (.62) P⫽.004*
1.32 (.46) P⫽.005*
1.28 (.61) P⫽.04
FA-Fornix .83 (.70)
P⫽.24
2.78 (.75) P⬍.001*
1.71 (.57) P⬍.003*
2.10 (.74) P⬍.005*
FA-SLF .27 (.82)
P⫽.74
.67 (.89) P⫽.45
.69 (.67) P⫽.30
1.18 (.88) P⫽.18
FA-UNC 1.45 (.80)
P⫽.07
1.90 (.86) P⫽.03
1.49 (.64) P⫽.02
1.98 (.85) P⫽.02
Note:—Estimated from separate linear regression models that controlled for gender, education, and recruitment source. The␣level was set at .01 to account for the 4 outcome measures (.05/4⫽.0125). FA indicates ratio of young adults fractional anistropy value; GM, percentage of total cranial volume; WMH, white matter hyperintensities (log-transformed percentage of total cranial volume).
* IndicatesPvalues not larger than the␣level which was set at .0125.
Table 3: Results of the multiple linear regression models predicting cognition, including MRI measures as simultaneous predictors
Semantic Episodic Executive Spatial
GM 5.89 (2.03)
P⫽.004*
9.13 (2.03) P⬍.001*
5.95 (1.55) P⬍.001*
6.39 (2.21) P⫽.004*
WMH ⫺.02 (.06)
P⫽.77
⫺.06 (.06) P⫽.29
⫺.03 (.04) P⫽.51
⫺.004 (.06) P⫽.96
FA-Fornix .13 (.75)
P⫽.86
1.47 (.77) P⫽.06
.90 (.59) P⫽.13
1.39 (.79) P⫽.06
GM 6.26 (2.0)
P⫽.002*
9.50 (2.02) P⬍.001*
6.0 (1.54) P⬍.001*
6.86 (2.19) P⫽.002*
WMH ⫺.03 (.05)
P⫽.64
⫺.07 (.06) P⫽.18
⫺.03 (.04) P⫽.44
⫺.01 (.06) P⫽.80 FA-Cingulum ⫺.42 (.59)
P⫽.48
.79 (.62) P⫽.21
.72 (.47) P⫽.13
.77 (.63) P⫽.22
[image:5.594.51.534.271.405.2]is not important. In fact, multiple studies show that neurobe-havioral deficits arise both from cortical lesions and injury to fiber tracts that link cortical and subcortical regions into dis-tributed networks.33However, WMH and reduced FA repre-sent injury to fiber tracts that is probably incomplete (ie, in-jured but not transected axons), thereby impeding, but not preventing, neuronal transmission via those tracts. Further-more, because any pair of regions may be connected directly or indirectly via multiple fiber pathways,33,34injury to any indi-vidual pathway may alter or make inefficient, but not com-pletely prevent, communication between functional cortical systems. Conversely, GM atrophy probably reflects injury to neuronal soma, dendrites, and, most importantly, synapses, leading to primary impairments in the nodes of the neural networks. The importance of GM atrophy in our study is fur-ther strengthened by the fact that most of the cognitively im-paired participants exhibited clinical phenotypes suggesting the presence of AD pathology, which results in specific injury to pyramidal cell neurons in cortical layers III and IV respon-sible for cortical-cortical connectivity.35,36Again, these results should not be interpreted as suggesting that white matter in-tegrity has no direct bearing on late-life cognition; indeed, WMHs have been shown to impact cognitive function in the absence of severe GM atrophy,37and white matter injury may in fact exacerbate the gray matter atrophy that seems to drive cognitive losses.3,8,32 However, in a population spanning a range of both GM atrophy and WM injury, our data suggest that GM atrophy may represent the final common pathway to cognitive decline.
The veracity of our findings is bolstered by a number of additional observations. First, echoing previous studies, we found significant univariate associations between GM, WM measures, and cognitive performance,30particularly for per-formance in the executive and episodic memory domains.6In addition, we found significant differences in cognitive perfor-mance across all the cognitive domains comparing CN pa-tients with ones with MCI and MCI with dementia, similar to prior studies.18,38Reductions in GM and WM across syn-dromes have been similarly shown.33,39-42We believe similar-ities between our study and prior observations support the primary finding of differing strengths of association between cognition and GM, WMH, and FA.
Our study is not without limitations, however. For exam-ple, this analysis is entirely cross-sectional and therefore can-not address causality or temporal evolution. It is possible, for example, that white matter lesions may have independent ef-fects on cognition early in the course of brain injury when clinical impairment is absent or only mild37,43,44but are over-whelmed in the setting of cortical brain injury through the AD process, as suggested in pathologic studies.45In addition, this study included participants with cognitive decline of various etiologies, though most were AD associated. This may limit our ability to investigate relations between AD-related brain injury and cognition, but the more diverse cohort would have been expected to increase the effects of WMH and FA, because many of the non-AD subjects would be expected to exhibit vascular disease. In future studies, we may restrict analysis to only patients with amnestic MCI and AD to further study the specific MR imaging changes and cognition decline associated with AD.
Conclusions
These results strongly suggest that MR imaging measures of GM associate more closely with cognitive function than white matter measures do across a broad range of cognitive and functional impairment. We believe our study is among the first to comprehensively assess the relationship between vari-ous MR imaging measures of gray and white matter injury and cognitive performance. From our results, we conclude the GM injury is most important to cognitive performance among a group of older participants with various degrees of cognitive impairment. Future research will evaluate possible effects of regional differences in GM volume on longitudinal cognition and risk for transitions from normal cognitive ability to cog-nitive impairment.
Disclosures: Laurel Beckett—RELATED: Grant:NIH,* Comments: My research in cognitive aging is supported by the UC Davis Alzheimer’s Disease Center and by the Alzheimer’s Disease Neuroimaging Initiative (UC Davis subcontract for biostatistics). Sarah Tomasze-wski Farias—RELATED: Grant:NIH.* Charles DeCarli—RELATED: Grant:NIH;*Support for
Tavel to Meetings for the Study or Other Purposes:NIH;*UNRELATED: Grants/Grants
Pending:NIH;*Payment for Lectures (including service on speakers bureaus):Northwestern
University, UC Irvine, Comments: Numerous invited speaking engagements; Patents
(planned, pending, or issued):1991 – U.S. Patent Number 5262945, Method for
Quantifi-cation of Brain Volumes from Magnetic Resonance Images;*Payment for Development of
Educational Presentations:AAN educational courses. (*Money paid to institution.)
References
1. Mouton PR, Martin LL, Calhoun ME, et al.Cognitive decline strongly corre-lates with cortical atrophy in Alzheimer’s dementia.Neurobiol Aging1998;19: 371–77
2. Kopelman MD, Lasserson D, Kingsley D, et al.Structural MRI volumetric anal-ysis in patients with organic amnesia, 2: correlations with anterograde mem-ory and executive tests in 40 patients.J Neurol Neurosurg Psychiatry2001;71: 23–28
3. Yoshita M, Fletcher E, Harvey D, et al.Extent and distribution of white matter hyperintensities in normal aging, MCI, and AD.Neurology2006;67:2192–98 4. DeCarli C, Miller BL, Swan GE, et al.Cerebrovascular and brain morphologic
correlates of mild cognitive impairment in the National Heart, Lung, and Blood Institute Twin Study.Arch Neurol2001;58:643– 47
5. Scheltens P, Barkhof F, Valk J, et al.White matter lesions on magnetic reso-nance imagings in clinically diagnosed Alzheimer’s disease. Evidence for het-erogeneity.Brain1992;115:735– 48
6. Parks CM, Iosif A.-M., Farias S, et al.Executive function mediates effects of white matter hyperintensities on episodic memory.Neuropsychologia2011;49: 2817–24
7. Petkov CI, Wu CC, Eberling JL, et al.Correlates of memory function in com-munity-dwelling elderly: the importance of white matter hyperintensities.
J Int Neuropsychol Soc2004;10:371– 81
8. Lee DY, Fletcher E, Martinez O, et al.Regional pattern of white matter micro-structural changes in normal aging, MCI, and AD.Neurology2009;73:1722–28 9. Assaf Y, Pasternak O.Diffusion tensor imaging (DTI)-based white matter
mapping in brain research: a review.J Mol Neurosci2008;34:51– 61 10. Ringman JM, O’Neill J, Geschwind D, et al.Diffusion tensor imaging in
pre-clinical and presymptomatic carriers of familial Alzheimer’s disease muta-tions.Brain2007;130:1767–76
11. Takahashi S, Yonezawa H, Takahashi J, et al.Selective reduction of diffusion anisotropy in white matter of Alzheimer disease brains measured by 3.0 Tesla magnetic resonance imaging.Neurosci Lett2002;332:45– 48
12. Fellgiebel A, Mu¨ller MJ, Wille P, et al.Color-coded diffusion-tensor-imaging of posterior cingulate fiber tracts in mild cognitive impairment.Neurobiol Aging2005;26:1193–98
13. Pfefferbaum A, Sullivan EV, Hedehus M, et al.Age-related decline in brain white matter anisotropy measured with spatially corrected echo-planar dif-fusion tensor imaging.Magn Reson Med2000;44:259 – 68
14. Chang MC, Kim SH, Kim OL, et al.The relation between fornix injury and memory impairment in patients with diffuse axonal injury: a diffusion tensor imaging study.Neurorehabilitation2010;26:347–53
15. Hinton L, Carter K, Reed BR, et al.Recruitment of a community-based cohort for research on diversity and risk of dementia.Alzheimer Dis Assoc Disord2010; 24:234 – 41
16. American Psychiatric Association.Diagnostic and Statistical Manual of Mental Disorders.4th ed. Washington, DC: American Psychiatric Association; 2000 17. Petersen RC.Mild cognitive impairment as a diagnostic entity.J Intern Med
18. Petersen RC, Smith GE, Waring SC, et al.Mild cognitive impairment—Clinical characterization and outcome.Arch Neurol1999;56:303– 08
19. DeCarli C, Reed BR, Jagust W, et al.Brain behavior relationships among Afri-can AmeriAfri-cans, Whites, and Hispanics.Alzheimer Dis Assoc Disord2008;22: 382–91
20. He J, Farias S, Martinez O, et al.Differences in brain volume, hippocampal volume, cerebrovascular risk factors, and apolipoprotein E4 among mild cog-nitive impairment subtypes.Arch Neurol2009;66:1393–99
21. Carmichael O, Mungas D, Beckett L, et al.MRI predictors of cognitive change in a diverse and carefully characterized elderly population.Neurobiol Aging
2012;33:83–95
22. Dempster AP, Laird NM, Rubin DB.Maximum likelihood from incomplete data via EM algorithm.J R Stat Soc Series B Stat Methodol1977;39:1–38 23. Rajapakse JC, Giedd JN, Rapoport JL.Statistical approach to segmentation of
single-channel cerebral MR images.IEEE Trans Med Imag1997;16:176 – 86 24. DeCarli C, Massaro J, Harvey D, et al.Measures of brain morphology and
infarction in the Framingham heart study: establishing what is normal. Neu-robiol Aging2005;26:491–510
25. DeCarli C, Fletcher E, Ramey V, et al.Anatomical mapping of white matter hyperintensities (WMH): exploring the relationships between periventricu-lar WMH, deep WMH, and total WMH burden.Stroke2005;36:50 –55 26. Rajapakse JC, DeCarli C, McLaughlin A, et al.Cerebral magnetic resonance
image segmentation using data fusion.J Comput Assist Tomogr1996;20: 206 –18
27. Zhang Y, Zhang J, Oishi K, et al.Atlas-guided tract reconstruction for auto-mated and comprehensive examination of the white matter anatomy. Neuro-Image2010;52:1289 –301
28. Mungas D, Reed BR, Farias ST, et al.Age and education effects on relationships of cognitive test scores with brain structure in demographically diverse older persons.Psychol Aging2009;24:116 –28
29. Mungas D, Reed BR, Crane PK, et al.Spanish and English Neuropsychological Assessment Scales (SENAS): further development and psychometric charac-teristics.Psychol Assess2004;16:347–59
30. Mueller SG, Mack WJ, Mungas D, et al.Influences of lobar gray matter and white matter lesion load on cognition and mood.Psychiatry Res2010;181: 90 –96
31. Cardenas VA, Chao LL, Studholme C, et al.Brain atrophy associated with baseline and longitudinal measures of cognition. Neurobiol Aging2011;32: 572– 80
32. Lee DY, Fletcher E, Martinez O, et al.Vascular and degenerative processes differentially affect regional interhemispheric connections in normal aging, mild cognitive impairment, and Alzheimer disease.Stroke2010;41:1791–97 33. Schmahmann JD, Smith EE, Eichler FS, et al.Cerebral white matter:
neuro-anatomy, clinical neurology, and neurobehavioral correlates.Ann N Y Acad Sci2008;1142:266 –309
34. Schmanhmann JD, Pandya DN.Cerebral white matter— historical evolution of facts and notions concerning the organization of the fiber pathways of the brain.J Hist Neurosci2007;16:237– 67
35. Morrison JH, Hof PR.Life and death of neurons in the aging cerebral cortex.
Int Rev Neurobiol2007;81:41–57
36. Thangavel R, Sahu SK, Van Hoesen GW, et al.Loss of nonphosphorylated neurofilament immunoreactivity in temporal cortical areas in Alzheimer’s disease.Neuroscience2009;160:427–33
37. Mayda AB, Westphal A, Carter CS, et al.Late life cognitive control deficits are accentuated by white matter disease burden.Brain2011;134:1673– 83 38. Petersen RC, Morris JC.Mild cognitive impairment as a clinical entity and
treatment target.Arch Neurol2005;62:1160 – 63
39. Fox NC, Warrington EK, Rossor MN.Serial magnetic resonance imaging of cerebral atrophy in preclinical Alzheimer’s disease.Lancet1999;353:2125 40. Foundas AL, Leonard CM, Mahoney SM, et al.Atrophy of the hippocampus,
parietal cortex, and insula in Alzheimer’s disease: a volumetric magnetic res-onance imaging study.Neuropsychiatry Neuropsychol and Behav Neurol1997; 10:81– 89
41. Barber R, Scheltens F, Gholkar A, et al.White matter lesions on magnetic resonance imaging in dementia with Lewy bodies, Alzheimer’s disease, vas-cular dementia, and normal aging.J Neurol Neurosurg Psychiatry1999;67: 66 –72
42. Yoshita M, Fletcher E, Ortega M, et al.White matter hyperintensities and fractional anisotoropy are associated with corpus callosum atrophy in Alzhei-mer disease.Neurology2007;68:A62
43. Nordahl CW, Ranganath C, Yonelinas AP, et al.Different mechanisms of epi-sodic memory failure in mild cognitive impairment.Neuropsychologia2005; 43:1688 –97
44. Nordahl CW, Ranganath C, Yonelinas AP, et al.White matter changes compro-mise prefrontal cortex function in healthy elderly individuals.J Cogn Neurosci
2006;18:418 –29