Diffusion Tensor Imaging as Potential
Biomarker of White Matter Injury in
Diffuse Axonal Injury
Thierry A.G.M. Huisman, Lee H. Schwamm, Pamela W. Schaefer, Walter J. Koroshetz, Neetha Shetty-Alva, Yelda Ozsunar, Ona Wu, and A. Gregory Sorensen
BACKGROUND AND PURPOSE: Multiple biomarkers are used to quantify the severity of traumatic brain injury (TBI) and to predict outcome. Few are satisfactory. CT and conventional MR imaging underestimate injury and correlate poorly with outcome. New MR imaging techniques, including diffusion tensor imaging (DTI), can provide information about brain ultrastructure by quantifying isotropic and anisotropic water diffusion. Our objective was to determine if changes in anisotropic diffusion in TBI correlate with acute Glasgow coma scale (GCS) and/or Rankin scores at discharge.
METHODS: Twenty patients (15 male, five Female; mean age, 31 years) were evaluated. Apparent diffusion coefficients (ADCs) and fractional anisotropy (FA) values were measured at multiple locations and correlated with clinical scores. Results were compared with those of 15 healthy control subjects.
RESULTS:ADC values were significantly reduced within the splenium (⌬18%,Pⴝ.001). FA values were significantly reduced in the internal capsule (⌬14%; P < .001) and splenium (⌬16%;Pⴝ.002). FA values were significantly correlated with GCS (rⴝ0.65– 0.74;P< .001) and Rankin (r ⴝ 0.68 – 0.71; P < .001) scores for the internal capsule and splenium. The correlation between FA and clinical markers was better than for the corresponding ADC values. No correlation was found between ADC of the internal capsule and GCS/Rankin scores.
CONCLUSION:DTI reveals changes in the white matter that are correlated with both acute GCS and Rankin scores at discharge. DTI may be a valuable biomarker for the severity of tissue injury and a predictor for outcome.
Diffuse axonal injury (DAI) is identified as one of the most important causes of morbidity and mortality in patients with traumatic brain injury (TBI) (1–3). DAI refers to white matter (WM) injury induced by sud-den acceleration-deceleration and/or rotational forces. The resulting tissue injury is characterized by axonal stretching, disruption, and eventual separation of nerve fibers (4, 5).
Currently, no technique is accurate for diagnosing
and assessing the distribution and severity of DAI. CT and MR imaging are known to underestimate the extent of DAI and correlate poorly with final out-come (6, 7). This lack of sensitivity is confirmed in studies in which patients had progressive, global ce-rebral atrophy despite the fact that initial imaging failed to show pathology or revealed only discrete findings (8, 9). Consequently, there is considerable interest in developing more-sensitive diagnostic tools. Several previous studies have shown that diffusion-weighted imaging (DWI) is valuable in evaluating DAI (10–12). One study showed that DWI depicts shearing injuries that are not visible on conventional T2-/T2*-weighted or fluid attenuated inversion recov-ery (FLAIR) MR images (12). However, the clinical importance of this extra information was not studied; DWI findings were not correlated with clinical scores. Diffusion tensor imaging (DTI) represents an exten-sion of DWI that allows the quantification of WM architecture in vivo. In DTI, the degree and direc-tionality of water diffusion (anisotropy) is measured. By measuring the degree of water diffusion
anisot-Received February 14, 2003; accepted August 21.
From the MGH-NMR Center (T.A.G.M.H., N.S.-A., O.W., A.G.S.) and Departments of Neurology (L.H.S., W.J.K.) and De-partment of Radiology (P.W.S.), Division of Neuroradiology, Mas-sachusetts General Hospital and Harvard Medical School, Boston, and the Department of Radiology, University Children’s Hospital Zurich, Zurich, Switzerland (T.A.G.M.H.).
Supported by grants PHS R01NS38477 and P41-RR14075. Presented at the 40th Annual Meeting of the American Society of Neuroradiology, May 2002, Vancouver, British Columbia, Canada.
Address reprint requests to Thierry A.G.M. Huisman, MD, Uni-versity Children’s Hospital Zurich, Department of Radiology, Steinwiesstrasse 75, CH-8032 Zurich, Switzerland.
©American Society of Neuroradiology
ropy, information about the integrity of WM tracts is obtained (10, 13–16).
In the present study, we hypothesized that the de-gree of tissue abnormality, as measured with DTI, is correlated with clinical scores. Our overall goal was to extend the results of our previous study (12) by inves-tigating the potential of DTI as a biomarker of tissue injury.
Methods
Institutional review board approval was obtained for our retrospective review of patient records (including MR imaging studies).
Study Patients
Twenty patients (15 male, five female; mean age, 31 years⫾ 10) were included. Patients were selected by means of an electronic search of all radiologic reports between 1996 and 1999. Specific keywords related to head trauma were used: traumatic brain injury, cerebral trauma, head trauma, diffuse axonal injury, shearing injury, closed head injury, and traumatic cerebral hemorrhage. Initially, 107 patients were identified. Patients were excluded if the time delay between trauma and MR imaging exceeded 7 days (n ⫽26) to avoid the various changes in anisotropic diffusion related to secondary tissue injury. Patients younger than 18 years were excluded (n⫽9) to ensure that the measured changes in anisotropic diffusion were not related to ongoing brain-maturation processes. In addition, patients who had required emergency neurosurgical or surgical interventions or had experienced cardiovascular arrest (n⫽7) were excluded. In 11 patients, DWI data were missing. Review of the medical records and final radiologic reports showed that, in 28 patients, the clinical criteria for TBI were not fulfilled or that other nontraumatic cerebral pathologies (eg, cerebral stroke, hemorrhage) had been diagnosed. In six patients, ade-quate clinical records were not available. Consequently, 87 patients were excluded, leaving 20 patients for our study. The clinical records confirmed that the mechanism of trauma was consistent with DAI. All patients proved to be healthy before trauma, with no known history of other cerebral disease. Fif-teen healthy subjects with a matched age distribution served as a control group (mean age, 35 years⫾10 years).
MR Image Acquisition
Imaging was performed on a 1.5-T MR imaging unit with echo-planar imaging capabilities. All patients and control sub-jects underwent DTI averaged over three datasets for a total acquisition time of 126 seconds (TR/TE, 6000/118; field of view, 40 ⫻ 20 cm; acquisition matrix, 256 ⫻ 128; section thickness, 6 mm section;bvalues, 3 and 1221 sec/mm2) applied
in six directions at 20 section positions. The entire diffusion tensor was sampled by using a T2-weighted, spin-echo, single-shot, echo-planar imaging sequence similar to those previously published (17).
The overall translational water motion, characterized by the apparent diffusion coefficient (ADC), and the anisotropic com-ponent of water diffusion, characterized by fractional anisot-ropy (FA), was calculated on a voxel-by-voxel basis (18, 19). FA, which represents the ratio of the anisotropic component of
the diffusion tensor to the whole diffusion tensor, was used because FA has been reported to be the best rotationally invariant scalar metric for measuring diffusion anisotropy (17– 19). Rotationally invariant anisotropy metrics are advanta-geous because they are independent of the frame of reference, of the direction of the applied diffusion gradients, and of the orientation of the tissue microstructure within the voxels (11, 19). In contrast, rotationally variant scalars depend on the direction of the applied diffusion gradients and the orientation of the studied structures within the voxels. FA metrics are scalar indices ranging from 0 to 1, where 0 represents maximal isotropic diffusion as in a perfect sphere and 1 represents maximal anisotropic diffusion, as in the hypothetical case of a long cylinder of minimal diameter. FA maps are displayed as gray-scale maps. Areas with high degrees of FA (eg, corpus callosum) are bright, and areas with low degrees of FA (eg, gray matter) are dark (Fig 1A). In addition, the spatial direc-tion of the mean anisotropic diffusion gradient in each voxel can be displayed graphically by adding a color coding to the FA maps. Red indicated a predominant left-right anisotropic dif-fusion gradient; green, an anteroposterior gradient; and blue, a superior-inferior gradient (Fig 1B).
Data Analysis
The images were transferred to a personal computer (Apple Computer Inc., Cupertino, CA). ADC and FA values were measured at well-known predilection sites of DAI: the poste-rior limb of internal capsule (bilaterally) and the splenium of the corpus callosum (1, 10, 11). ADC and FA measurements in the thalamus and putamen, which are not at increased risk for shearing injuries, served as internal references. The anterior limb of the internal capsule was not measured because its small size made region-of-interest (ROI) positioning susceptible to contamination by the adjacent basal ganglia. In addition, no ROIs were measured in the brainstem because magnetic sus-ceptibility artifacts from the adjacent skull base would have made the ADC and FA measurements less reliable. ROIs were positioned by exactly identifying the anatomical structures by using image display software (Alice; Hayden Image Processing Solutions, Boulder, CO). Manually traced outlines were used for all regions, similar to the outlining published by Melhem et al (14). ROIs were positioned by anatomic guidance and not lesion guidance. This ROI positioning makes the technique less investigator-dependant. ROIs included at least nine pixels. The mean ADC and FA values, including the corresponding stan-dard deviations (SDs), were measured. All bilateral measures were averaged for each patient.
Statistical Analysis
A Wilcoxon signed-rank test was used to determine whether statistically significant differences existed between the corre-sponding left- and right-sided ROI measurements in the con-trol subjects. Subsequently, a two-tailed Wilcoxon rank-sum test was performed to evaluate for statistically significant dif-ferences between ROI measurements in patients and control subjects. To adjust for multiple comparisons, Bonferroni cor-rection was applied. APvalue less than .005 was considered to indicate a statistically significant difference between patients and control subjects. Linear regression analysis was applied to test for statistically significant correlations between the mea-sured ADC and FA values and the GCS and Rankin scores. A
statistician performed the analyses by using a SAS software package (version 8; SAS Inc, Cary, NC).
Results
Table 1 lists the results of the left-versus-right com-parison of the bilaterally measured ADC and FA values in the control subjects. There was no statisti-cally significant difference between the left- and right-sided measurements (P ⫽ .182–.890). Consequently, for further data analysis, all bilateral measurements were averaged.
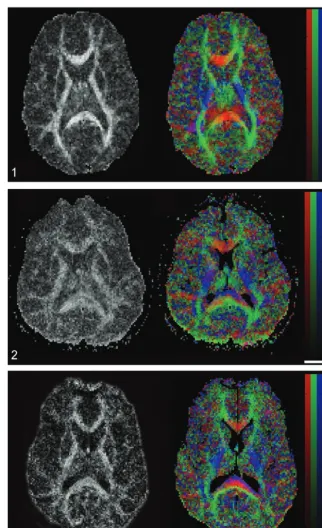
FIG 1. Axial FA map (left) and color coded map of mean diffusion direction (right) at the level of the basal ganglia, thalami and internal capsulae in a healthy control subject.Left, Gray-scale FA map displays a high degree of anisotropic dif-fusion (bright) within the internal capsule and the splenium of the corpus callosum. The cortex and the central gray matter are dark because of their low degree of aniso-tropic diffusion. Right, Color-coded im-age displays a predominant left-right-left mean diffusion direction (red) within the center of the splenium of the corpus cal-losum, an anteroposterior direction (green) within the optic radiations, and a superior-inferior direction (blue) within the posterior internal capsule.
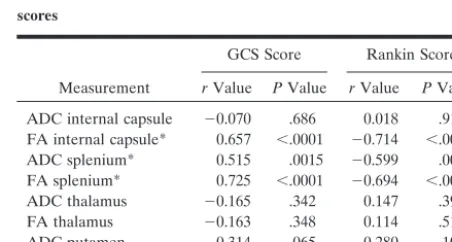
FIG 2. Images in a 24-year-old man with severe TBI. Acute GCS, 5. Rankin score at discharge, 3. Left, FA map shows a reduced FA index of the splenium of the corpus callosum (FA ⫽ 0.511 ⫾ 0.036, mean control FA ⫽0.808⫾0.060) and internal capsule (FA ⫽ 0.531 ⫾ 0.036, mean control FA⫽0.735⫾0.066).Right, Color-coded map shows that, within the center of the splenium of the corpus cal-losum, the normally predominant red vox-els are missing and replaced by a mixture of blueandgreen voxels (compare with Fig 1). This finding suggests that fiber tracts that connect both cerebral hemi-spheres are injured or disrupted within the center of the splenium.
[image:3.603.214.536.57.584.2]Table 2 lists the measured ADC and FA values for patients and control subjects. The measured ADC and FA values in the control group were similar to previously published measurements (18, 19). In the control subjects, the splenium showed the highest level of diffusion anisotropy (mean FA, 0.808 ⫾
0.060), followed by the internal capsule (mean FA, 0.725 ⫾ 0.066), the thalamus (mean FA, 0.377 ⫾
0.075), and the putamen (mean FA, 0.286⫾ 0.081). There was a statistically significant decrease in ADC for the splenium (⌬16%;P ⫽.001) in patients com-pared with control subjects. A statistically significant decrease in FA was seen in the internal capsule (⌬14%;P⬍.001) and splenium (⌬16%,P⫽0.002) in patients compared with control subjects (Table 2). No statistically significant differences were observed for the ADC and FA values in the putamen and
thala-mus. In three patients, visual inspection of the color-coded FA maps showed partial disruption of the fiber tracts oriented left to right in the central area of the splenium (Figs 2, 3).
Table 3 lists the correlation coefficients between the ADC and FA values and the GCS and Rankin scores. Our results showed that the ADC and FA values in the splenium were significantly correlated with both the acute GCS and Rankin scores at dis-charge. In addition, the FA values in the internal capsule were correlated with GCS and Rankin scores, whereas the ADC values did not show a correlation. The strongest correlation was found for the FA values in the splenium. The measured FA values showed a stronger correlation with the clinical scores than did the ADC values. There was no statistically significant correlation between ADC and FA values of the thal-amus and putamen and the clinical scores. The data are represented graphically in Figures 4 and 5.
The mean GCS score for all patients was 8.7⫾3.7, and the mean Rankin score was 3.1 ⫾ 1.5. Patients were hospitalized for a mean duration of 18 days.
Discussion
[image:4.603.54.282.70.198.2]TBI, and especially DAI, represents a major diag-nostic challenge. An early and exact identification of the extent and degree of tissue injury is essential for treatment decisions. Early identification of patients at risk for a poor outcome or severe cognitive and/or behavioral deficits is desirable. Conventional neuro-imaging, including CT and MR neuro-imaging, demon-strates many trauma-related lesions. The correlation between acute imaging findings and long-tern out-comes is, however, poor. CT and MR imaging are known to underestimate TBI, in particular DAI (6, 7, 21). A quantification of neural injury in the acute
TABLE 2: Averaged ADC and FA values for the control subjects and patients
A: ADC values, mm2/sec ROI Control Subjects,
⫻10⫺6 Patients,⫻10
⫺6 PValue
Internal capsule 674⫾81 683⫾59 .732 Splenium* 769⫾61 628⫾74 .001 Thalamus 718⫾60 719⫾62 .975 Putamen 677⫾75 707⫾55 .184
B: FA values
ROI Control Subjects Patients PValue Internal capsule* 0.725⫾0.066 0.624⫾0.072 ⬍.001 Splenium* 0.808⫾0.060 0.678⫾0.010 .002 Thalamus 0.377⫾0.075 0.401⫾0.040 .147 Putamen 0.286⫾0.081 0.307⫾0.040 .257
Note.—Table lists the mean ADC and FA values ⫾ SD for all patients and control subjects within the respective ROIs. Left- and right-sided ADC and FA values were averaged. A statistically cant ADC decrease is seen for the splenium, and a statistically signifi-cant FA decrease is seen for the internal capsule. APvalue of⬍.005 was considered to indicate a statistically significant difference. Analysis was performed by using a two-tailed Wilcoxon rank sum test.
[image:4.603.55.283.298.457.2]* Statistically significant difference.
TABLE 3: Correlation between DTI measurements and clinical scores
Measurement
GCS Score Rankin Score
rValue PValue rValue PValue ADC internal capsule ⫺0.070 .686 0.018 .914 FA internal capsule* 0.657 ⬍.0001 ⫺0.714 ⬍.0001 ADC splenium* 0.515 .0015 ⫺0.599 .0001 FA splenium* 0.725 ⬍.0001 ⫺0.694 ⬍.0001 ADC thalamus ⫺0.165 .342 0.147 .396 FA thalamus ⫺0.163 .348 0.114 .513 ADC putamen ⫺0.314 .065 0.280 .103 FA putamen ⫺0.116 .504 0.187 .281
Note.—Table lists the correlation coefficientrbetween the mea-sured ADC and FA values and GCS or Rankin score for different anatomic locations. There proved to be a statistically significant corre-lation between the ADC and FA values measured within the splenium and the GCS and Rankin score, as well as between the FA value of the internal capsule and the GCS or Rankin score. The correlation between the FA values and the GCS or Rankin score was stronger than for the corresponding ADC values. A correlation probability of P⬍ .0025 indicates a statistically significantly correlation between the measured ADC- and FA-values and the GCS/Rankin score.
* Statistically significant correlation.
TABLE 1: Averaged ADC and FA values for the control subjects
A: ADC values, mm2/sec
ROI Left⫻10⫺6 Right⫻10⫺6 PValue
Internal capsule 681⫾81 667⫾84 .642 Thalamus 715⫾62 721⫾59 .785 Putamen 684⫾80 669⫾73 .624
B: FA values
ROI Left Right PValue Internal capsule 0.731⫾0.069 0.721⫾0.077 .761 Thalamus 0.371⫾0.077 0.383⫾0.078 .182 Putamen 0.287⫾0.090 0.286⫾0.074 .890
[image:4.603.307.533.504.625.2]phase is essential for making treatment decisions, for developing and monitoring new treatments, and for providing appropriate counseling to patients concern-ing their long-term prognosis.
Currently, few imaging techniques offer reliable information that correlates with outcome in TBI. Sin-son and co-workers evaluated 30 patients with TBI by means of magnetization transfer ratio (MTR)
imag-ing and MR spectroscopy (21). They showed that MTR and MR spectroscopy can be used to quantify damage after TBI and thatN-acetylaspartate/creatine ratios may be sensitive indicators of neuronal dam-age. They correlated their results with clinical out-come scores.
Alternatively, conventional DWI that involves the use of diffusion-weighted images to calculate the FIG 4. Linear regression plots of ADC
and FA values of the splenium and internal capsule versus GCS at the time of acute MR imaging (in patients) or at time of com-parison MR imaging (control subjects, all with GCS scores of 15). A statistically sig-nificant correlation is seen between the FA values of the splenium/internal capsule and GCS, as well as between the ADC values within the splenium and GCS. GCS scores vary between 3 and 15, where 3 represents the worst score, and 15, the best score.Open rectanglesindicate pa-tients;solid rectangles,control subjects.
A, ADC splenium versus GCS. B, ADC internal capsule versus GCS. C, FA splenium versus GCS. D, FA internal capsule versus GCS.
FIG 5. Linear regression plots of ADC and FA values of the splenium and internal capsule versus Rankin score at the time of discharge (in patients) or at time of com-parison MR imaging (control subjects, all with Rankin scores of 0). A statistically sig-nificant correlation is seen between the FA values of the splenium/internal capsule and Rankin score, as well as between the ADC values of the splenium and Rankin score. Rankin scores vary between 0 and 5, where 0 represents the best score and 5, the worst score.Open rectanglesindicate patients;solid rectangles,control subjects.
ADC can be used. This method can show lesions with decreased ADC in patients with DAI, in both the acute and subacute periods after TBI (10). Further-more, DWI has been shown to be valuable in eval-uating closed-head injury because it can depict ad-ditional shearing injuries not visible on conventional T2/FLAIR or T2* MR images (12).
DTI represents a relatively new, noninvasive MR technique that quantifies isotropic and anisotropic water diffusion in tissues (13, 15, 16, 18, 19). The degree of anisotropic diffusion is related to the de-gree of directionality and the integrity of WM fiber tracts within the brain. Densely packed WM tracts show a high degree of anisotropic diffusion, whereas gray matter has a low degree of anisotropic diffusion (15, 16). WM tracts are typically disrupted in DAI. Consequently, by measuring WM anisotropy, DTI could be a diagnostic tool that quantifies the degree of tissue injury. A previous study in five patients with mild TBI showed that the degree of diffusion anisot-ropy was reduced in WM regions in the first 24 hours after TBI (11). In the present study, we extended these results by correlating the change in WM tract anisotropic diffusion with clinical scores. ROI posi-tioning was anatomically guided (predilection sites of DAI) instead of lesion guided.
Our results confirm that changes in water diffusion anisotropy occur in TBI. FA was significantly de-creased in the posterior limb of the internal capsule (mean decrease in FA, 14%) and splenium of the corpus callosum (mean decrease in FA, 16%). Fur-thermore, we found a statistically significant correla-tion between FA values and the severity of head injury, as measured with acute and subacute neuro-logic assessments (acute GCS and discharge Rankin scores) in predilection sites of DAI.
These results confirm those of previous case re-ports and studies suggesting that TBI/DAI may be associated with changes in diffusion anisotropy (11, 15, 16, 22–24). Our study extends these earlier reports by quantifying the changes in a larger cohort of pa-tients, by documenting decreases in FA in predilec-tion sites of DAI, and by suggesting that FA changes may be able to serve as predictive parameters for outcome.
While our findings need confirmation in larger, longitudinal studies and correlation with pathologic specimens, they suggest that DTI may be able to provide biologic insight into DAI and that DTI may serve as a marker of disease severity. DTI has a number of advantages as imaging biomarkers of brain injury: 1) DTI can be used to evaluate brain trauma in an unconscious or sedated patient. 2) With further validation, DTI could permit the evaluation of re-sponses to treatment even when the clinical scores are inadequate for assessing the patient. 3) The objective quantitative DTI measurements are unlikely to be tainted by adverse CNS effects of medications or intubation, unlike clinical scores. 4) DTI may be an important alternative marker, as low initial GCS scores are of limited value in predicting the prog-nosis (25).
The exact mechanisms underlying the changes in diffusion anisotropy are not yet fully understood but most probably reflect changes in the underlying mi-croscopic structure of the tissue being examined. In ordered structures like the myelin sheaths of densely packed WM tracts (as in the internal capsule and splenium of the corpus callosum), a loss of order or structural integrity of the tissue results in a reduction of FA (11, 26). The diffusion along axons decreases, while the diffusion in directions perpendicular in-creases. Given that TBI is associated with DAI changes in the internal capsule and corpus callosum, we believe that the decrease in FA confined to these WM tracts reflects tissue damage and can be used as a biomarker of TBI severity.
Our data showed that FA is not significantly changed in the deep gray matter (thalamus, puta-men). These findings parallel theoretical consider-ations that the central gray matter is less susceptible to shearing forces because of its mainly cellular con-tents and fewer fiber tracts.
Our data also showed that the degree of FA change was better correlated with the clinical scores in both the acute and subacute states than the ADC values. This finding was especially apparent for the packed, parallel-oriented fiber tracts in the internal capsule. Our data showed a statistically significant correlation between the measured FA values of the internal cap-sule and the clinical scores, whereas no correlation was observed for the corresponding ADC values.
Finally, our data showed that, in areas where a statistically significant change in ADC values was found (splenium), ADC values were decreased rather than increased. This finding make it unlikely that decreases in FA result from an increased accumula-tion of water in the interstitial space. Interstitial edema would increase the isotropic diffusion compo-nent while reducing anisotropic water diffusion.
Limitations of our study were that only a selection of WM fiber tracts were investigated, that the eigen-values/eigenvectors of the diffusion tensor were not separately studied, that the results were not corre-lated with magnetization transfer imaging or MR spectroscopic findings; that no long-term follow-up measurements were performed, and finally, that the number of patients was small.
Conclusion
be performed in unconscious or sedated patients and that FA measurements (ROI positioning) can be done with anatomic guidance instead of lesion guidance.
Acknowledgments
The authors thank Dave Tuch, PhD, and Mette Wiegell, PhD, for their help in color coding the FA images presented.
References
1. Gean AD.White matter shearing injury and brainstem. injuryIn:
Imaging of Head Trauma.New York: Raven, 1994:207–248 2. Murray JG, Gean AD, Evans SJ.Imaging of acute head injury.
Semin Ultrasound CT MR.1996;17:185–205
3. Gentry LR.Head trauma.In: Atlas SW, ed.Magnetic Resonance Imaging of the Brain and Spine.New York: Raven, 1996;611–647 4. Strich SJ.Shearing of nerve fibres as a cause of brain damage due
to head injury: a pathological study of twenty cases.Lancet1961; 2:443–448
5. Adams JH, Graham DI, Murray LS, Scott G.Diffuse axonal injury due to nonmissile head injury in humans: an analysis of 45 cases. Ann Neurol1982;12:557–563
6. Gentry LR, Godersky JC, Thompson B, Dunn VD.Prospective comparative study of intermediate-field MR and CT in the evalu-ation of closed head trauma.AJR Am J Roentgenol1988;150:673– 682
7. Kelly AB, Zimmerman RD, Snow RB, et al.Head trauma: com-parison of MR and CT-experience in 100 patients.AJNR Am J Neuroradiol1988;9:699–708
8. Gale SD, Johnson SC, Bigler ED, Blatter DD.Trauma-induced degenerative changes in brain injury: a morphometric analysis of three patients with preinjury and postinjury MR scans.J Neuro-trauma1995;12:151–158
9. Anderson CV, Wood DM, Bigler ED, Blatter DD.Lesion volume, injury severity, and thalamic integrity following head injury.J Neu-rotrauma1996;13:59–65
10. Liu AY, Maldjian JA, Bagley LJ, Sinson GP, Grossman RI. Trau-matic brain injury: diffusion-weighted MR imaging findings.AJNR Am J Neuroradiol1999;20:1636–1641
11. Arfanakis K, Haughton VM, Carew JD, Rogers BP, Dempsey RJ, Meyerand ME.Diffusion tensor MR imaging in diffuse axonal injury.AJNR Am J Neuroradiol2002;23:794–802
12. Huisman TAGM, Sorensen AG, Hergan K, Gonzalez RG, Schaefer PW.Diffusion-weighted imaging for the evaluation of diffuse ax-onal injury in closed head injury.J Comput Assist Tomogr2003;27: 5–11
13. Pierpaoli C, Jezzard P, Basser PJ, et al. Diffusion tensor MR imaging of the human brain.Radiology1996;201:637–648 14. Melhem ER, Itoh R, Jones L, Barker PB.Diffusion tensor MR
imaging of the brain: Effect of diffusion weighting on trace and anisotropy measurements.AJNR Am J Neuroradiol2000;21:1813– 1820
15. Pfefferbaum A, Sullivan EV, Hedehus M, Lim KO, Adalsteinsson E, Moseley M.Age-related decline in brain white matter anisotropy measured with spatially corrected echo-planar diffusion tensor imaging.Magn Reson Med2000;44:259–268
16. Papadakis NG, Martin KM, Mustafa MH, et al.Study of the effect of CSF suppression on white matter diffusion anisotropy mapping of healthy human brain.Magn Reson Med2002;38:394–398 17. Sorensen AG, Wu O, Copen WA, et al.Human acute cerebral
ischemia: detection of changes in water diffusion anisotropy by using MR imaging.Radiology1999;212:785–792
18. Basser PJ, Pierpaoli C.Microstructural and physiological features of tissues elucidated by quantitative-diffusion-tensor MRI.J Magn Reson B1996;111:209–219
19. Pierpaoli C, Basser PJ.Toward a quantitative assessment of diffu-sion anisotropy.Magn Reson Med1996;36:893–906
20. Lai SM, Duncan PW.Evaluation of the American Heart Associa-tion Stroke Outcome ClassificaAssocia-tion.Stroke1999;30:1840–1843 21. Sinson G, Bagley LJ, Cecil KM, et al. Magnetization transfer
imaging and proton MR spectroscopy in the evaluation of axonal injury: Correlation with clinical outcome after traumatic brain injury.AJNR Am J Neuroradiol2001;22:143–151
22. Wieshmann UC, Symms MR, Clark CA, et al.Blunt-head trauma associated with widespread water-diffusion changes.Lancet1999; 10:353:1242–1243
23. Ulug AM, Moore DF, Bojko AS, Zimmerman RD.Clinical use of diffusion-tensor imaging for diseases causing neuronal and axonal damage.AJNR Am J Neuroradiol1999;20:1044–1048
24. Wieshmann UC, Clark CA, Symms MR, et al.Reduced anisotropy of water diffusion in structural cerebral abnormalities demonstrated with diffusion tensor imaging.Magn Reson Imaging1999;17:1269–1274 25. Brain Trauma Foundation.The American Association of
Neurolog-ical Surgeons: The joint section on neurotrauma and critNeurolog-ical care—Glasgow coma scale score.J Neurotrauma2000;17:563–571 26. Yang Q, Tress BM, Barber PA, et al.Serial study of apparent