Systems biology
Inferring transcriptional logic from multiple
dynamic experiments
Giorgos Minas
1,2,*, Dafyd J. Jenkins
2, David A. Rand
1,2and B
arbel Finkenst
€
€
adt
3,*
1
Mathematics Institute,
2Zeeman Institute, Systems Biology and Infectious Disease Epidemiology Research and
3Department of Statistics, University of Warwick, Coventry, CV4 7AL, UK
*To whom correspondence should be addressed. Associate Editor: Oliver Stegle
Received on November 30, 2016; revised on June 2, 2017; editorial decision on June 19, 2017; accepted on June 27, 2017
Abstract
Motivation:
The availability of more data of dynamic gene expression under multiple experimental
conditions provides new information that makes the key goal of identifying not only the
transcrip-tional regulators of a gene but also the underlying logical structure attainable.
Results:
We propose a novel method for inferring transcriptional regulation using a simple, yet
bio-logically interpretable, model to find the logic by which a set of candidate genes and their
associ-ated transcription factors (TFs) regulate the transcriptional process of a gene of interest. Our
dynamic model links the mRNA transcription rate of the target gene to the activation states of the
TFs assuming that these interactions are consistent across multiple experiments and over time. A
trans-dimensional Markov Chain Monte Carlo (MCMC) algorithm is used to efficiently sample the
regulatory logic under different combinations of parents and rank the estimated models by their
posterior probabilities. We demonstrate and compare our methodology with other methods using
simulation examples and apply it to a study of transcriptional regulation of selected target genes of
Arabidopsis Thaliana from microarray time series data obtained under multiple biotic stresses. We
show that our method is able to detect complex regulatory interactions that are consistent under
multiple experimental conditions.
Availability and implementation:
Programs are written in MATLAB and Statistics Toolbox Release
2016b, The MathWorks, Inc., Natick, Massachusetts, United States and are available on GitHub
https://github.com/giorgosminas/TRS and at http://www2.warwick.ac.uk/fac/sci/systemsbiology/
research/software.
Contact:
giorgos.minas
@
warwick.ac.uk or b.f.finkenstadt
@
warwick.ac.uk
Supplementary information:
Supplementary data are available at
Bioinformatics
online.
1 Introduction
Elucidating the structure of gene regulation from biological data is a key task of systems biology with applications spanning across biol-ogy and biomedicine (Levine et al., 2014;Marbachet al., 2010). Rapid development of a range of high-throughput technologies is giving rise to the generation of genome-wide time course mRNA measurements, while public repositories permit the wide distribution and sharing of these data (Hecker et al., 2009). Due to the
advancement of experimental protocols and techniques facilitating perturbations at both the cellular and whole organism level, genome-wide data can be collected under a range of conditions. Hence, researchers now have access to an unparalleled level of infor-mation regarding gene expression and network dynamics under mul-tiple experimental conditions (Godaet al., 2008;Hickmanet al., 2013;Kilianet al., 2007;Ou-Yanget al., 2017). Moreover, high-throughput technologies such as yeast-one-hybrid (Y1H, Ouwerkerk and Meijer, 2001), ChIP-chip and ChIP-seq, DNase-seq
VCThe Author 2017. Published by Oxford University Press. 3437
This is an Open Access article distributed under the terms of the Creative Commons Attribution License (http://creativecommons.org/licenses/by/4.0/), which permits doi: 10.1093/bioinformatics/btx407
and ATAC-seq (Meyer and Liu, 2014) can identify protein-DNA interactions and thus putative transcription factors (TFs) for target genes.
On the methodological side, a substantial literature of mathem-atical, statistical and computational approaches often termed re-verse-engineeringornetwork inference methodsfocus on inferring interactions between a large number of genes from high-throughput expression profiles (seeKianiet al., 2016;Heckeret al., 2009). They employ a number of different methodological approaches including co-expression and clustering algorithms (Faith et al., 2007; Margolinet al., 2006), Boolean logic models (Bornholdt, 2008;Han
et al., 2014), Bayesian networks (Thorne and Stumpf, 2012; Yu
et al., 2004) and differential equation models (Madaret al., 2010; Titsiaset al., 2012;Yipet al., 2010). Differential equation models can potentially describe mechanistic relations between target genes and their TFs but they often use large numbers of parameters and face model identifiability issues (Heckeret al., 2009). Boolean logic models can describe complex regulations of target genes including AND, OR, XOR co-regulations but require a preprocessing step of discretization of the continuous scale expression profiles to typically binary (ON/OFF) levels.
When dealing with datasets from multiple experimental condi-tions, most of the currently available methods derive one network structure for each experimental condition or even replicate of the same experiment. The exceptions are the approach inPenfoldet al.
(2012)that combines a hierarchical structure of the network with a set of global ‘average regulators’ extracted in addition to local regu-lators and the approach inWanget al.(2006),Weberet al.(2013) andOu-Yanget al.(2017)that attempts to extract consistent net-works across conditions. We follow the latter approach.
We introduce the transcriptional regulation switch (TRS) model that employs ordinary differential equations (ODEs) linking the transcription of the target gene to the observed activation states of a set of potential regulators by means of a piecewise linear transcrip-tion rate functranscrip-tion which jumps to a different value when at least one regulator in the set changes its activation (ON/OFF) state. This form of transcription function is a simple and flexible model that can also be seen as an approximation of the commonly used S-shaped (e.g. Hill type) functions (Alon, 2014; Klippet al., 2016). The number and identity of the regulators as well as the logic of the regulation are unknown and need to be estimated. Each of the observed activa-tion states of the set of regulators is associated with a single value of the transcription rate of the regulated gene across experimental con-ditions and over time. This constrains the parameterization and em-powers the method to identify consistent regulatory connections between a regulated gene and its TFs that hold under multiple condi-tions as inWanget al.(2006),Ou-Yanget al.(2017)andWeber
et al.(2013).
The latter studies describe the target transcription rate using lin-ear or non-linlin-ear regression models (also used inMadaret al., 2010 andYipet al., 2010) that can at most capture additive TF effects. This modelling approach substantially limits the regulatory inter-actions that can be derived. For example, interactive co-regulations such as the simple regulation of a target gene with two TFs A and B where B suppresses the activation caused by A cannot be captured by those models as we discuss in more detail later. Such an inter-action is experimentally observed e.g. the homeotic gene fushi tarazu (ftz) related to the development of Drosophila melanogaster (Latchman, 2005). Auto-regulation cannot be captured either as it cannot be distinguished from mRNA degradation.
We will show that TRS can detect these types of interactive regu-lations while Boolean type reguregu-lations such as AND, OR and XOR
activations and repressions (seeBornholdt, 2008;Hanet al., 2014) can be derived without the need of arbitrary data discretization. Despite the complexity of these regulation models and because our approach limits the estimation of transcription rates to only those values that are associated with activation states that are observed in the given dataset, the parameter identifiability issues that com-plex mechanistic models often face (seeHecker et al., 2009) are avoided.
Bayesian statistical methodology is used for the inference on model parameters including the number and identity of the most likely regulators, their action as activators, repressors and/or co-regulators and the logic of this regulation. Our approach for infer-ence is implemented through a trans-dimensional reversible jump Markov chain Monte Carlo (RJMCMC) algorithm (Green, 1995; Jenkinset al., 2013). An advantage of this approach is that it returns all plausible regulation models along with their posterior probabil-ities. Therefore, the search and selection between possible sets of regulators is done during the MCMC run and no additional post-processing computationally expensive scoring or selection steps are needed.
Two simulation examples are used to illustrate the approach. An artificial repressed activation network is considered along with a published regulation model related to the flowering time ofA. thali-ana(Leal Valentimet al., 2015). Our results are compared with the outcomes of GRNInfer tool inWanget al.(2006);Ou-Yanget al.
(2017). The methodology is then applied to study the transcriptional regulation of two chosen target genes ofA. thalianaunder multiple biotic stresses.
2 Methods
2.1 TRS model
Consider the regulation of the mRNA transcription of a target gene by an unknown setU¼ f/1;/2;. . .;/gof TFs. As in the temporal
transcriptional switch model ofJenkinset al.(2013)we assume that the joint mRNA expression of the target gene over a population of cells may be described by a piece-wise linear ODE where mRNA transcription is decoupled from mRNA degradation and allowed to change orswitchbetween different states. The mRNA expression, M(t), of the target gene is hence described by
dM
dt ¼sð Þ t dM tð Þ; t2½0;L (1)
wheredis the mRNA degradation rate and sð Þt the transcription rate (TR) function. This is piece-wise constant with jumps at (un-known) time-pointssi,i¼1;2;. . .;m, where the transcription rate moves from some value,si1, to a higher (lower) valuesi, which we
will refer to as activation (deactivation).
Extending the univariate approach ofJenkinset al.(2013), the transcriptional switches in our model occur when the TF level, P/ð Þt;t2ð0;LÞ, of a regulator /2 U crosses a threshold, q/,
to change between active and inactive states. Furthermore, the TRs,
si, i¼0;1;. . .;mare linked to the activation states of the regula-tors in U such that each state of the activation function
að Þ ¼t ða1ð Þt;. . .;að ÞtÞ, where, forj¼1;. . .; ;t2½0;L,
ajð Þ ¼t
0; P/jð Þt < q/j /jis inactive
;
1; P/jð Þ t q/j /jis active
;
8 > < > :
observed states ofað Þt fortin 0½ ;L, then the TR function in (1) can be written as sð Þ ¼t Pqi saiIai; where Iai the indicator function Iai¼Iðað Þ ¼t aiÞ.
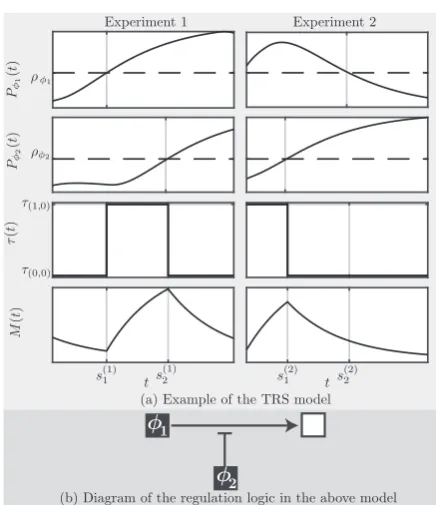
Figure 1displays a simple example of the TRS model with two regulators, namely an activator and a repressor of this activation, observed under two experimental conditions. Note that, as we dis-cuss in Sect. 1 of SI, the additive linear and non-linear models of transcription, such as inWanget al. (2006), cannot deduce such regulatory interactions.
For given threshold levels,qU¼ ðq/1;. . .;q/Þ, of the regulators inU, the time intervalsIak½0;L;Iak6¼1can be obtained and the general solution of the model in 1ð Þcan be written as
M tð Þ ¼Mð Þ0 edtþs a1e
dtÐ
0;t
½ \Ia1e dudu
þ þsaqe dtÐ
0;t
½ \Iaqe
dudu; (2)
which implies that, for fixedqUand degradation rated, the ODE
so-lution of our model has the form of a linear regression with coeffi-cientsM(0),sa1;. . .;saq. The number of regressors depends on the activation function of the regulators. Our methodology described below can accommodate a variable number of regulators and ex-periments and provides a probabilistic classification of the posterior credibility of the corresponding logics of interaction (see alsoFig. 2).
2.2 Bayesian inference
The aim is to identify the subsetUof the set of all candidate regula-tors,F ¼ ff1;f2;. . .;fNg, that explains the observed expression of
the target gene and to provide a description of the estimated regula-tory associations.
Lety¼ðykð ÞtiÞ, be the observed mRNA expression of a target
gene observed at time points t1;t2;. . .;tnk for experiments k¼1;. . .;K. A natural probabilistic assumption is that the observed time series are normally distributed with meanMkð Þt, equal to the
ODE solution path in (1), and standard deviationrkð Þ ¼t rkvkð Þt.
Herevkð Þ ¼t ðwkð ÞtÞwkwherewkð Þt is a fixed time-dependent
func-tion andwk2½0;1is an unknown parameter (Gelmanet al., 2004).
The resulting log-likelihood function for the parameter set
H¼ fU;qU;d;Mkð Þt0;skð Þt;t2½0;Lk;rk;wk;k¼1;2;. . .;Kgis
logLðH;yÞ ¼ 1 2
XK
k¼1 Xnk
i¼1
log 2 pr2kð Þti þ
ykð Þ ti Mkð Þti
ð Þ2
r2
kð Þti
: (3)
We note that different modeling assumptions, such as, for example the use of a different distribution of the measurement error, can be accommodated through other appropriate formulations of the likeli-hood function (see for exampleStrimmer, 2003).
To address the trans-dimensional nature of our model, we de-veloped a reversible jump Markov chain Monte Carlo (RJMCMC) al-gorithm based onGreen (1995)that allows for the Bayesian inference algorithm to move between models with a different numbers of regu-lators. Suppose that at a given iteration of the chain the value of the parameter vector isH. The next value,H0, is then derived as follows: 1. Draw and perform one of the following moves with probabilities
pM,pS,pBandpD, respectively, wherepMþpSþpBþpD¼1.
M Move a threshold: randomly draw/2 Uand replaceq/with
q0
/pðq0/jq/Þ;
S Swap a regulator: randomly draw/2Uandf02 F nUand set
U0¼Unf/g [ ff0gandq
f0pðqf0Þ;
B Add a regulator (Birth): randomly drawf02 F n Uand setU0
¼U[ ff0gandq
f0pðqf0Þ;
D Remove a regulator (Death): randomly draw/2Uand set
U0¼Un/.
2. Compute the likelihoodLðH0;yÞby the following steps: a. Use the updated regulator set and threshold levels to derive
the observed activation statesa0
1;. . .;a0q0 and the associated time intervalsIa0
j;j¼1;. . .;q 0.
b. Use least squares to estimate the transcription functions0
kð Þ
and initial conditionsM0
[image:3.612.70.289.53.306.2]kð Þt0 as inEq. (2).
Fig. 1.Example TRS model. The two top panels of Figure (a) display the
pro-files (solid lines),P/1andP/2, of regulators,/1and/2, and their threshold
lev-els (dashed lines),q/1andq/2, in two experiments (left and right). The 3rd
and 4th rows respectively show the TR functionsð Þt and the mRNA expres-sion profileM(t) of the target under the TRS model in each experiment. The activation of/1at times
1 ð Þ
1 of the experiment 1 produces the ‘on’ switch of the TRsð0;0Þ!sð1;0Þ. This activation is repressed in experiment 2 where the
sð0;1Þ!sð1;1Þswitch ats2ð Þ2 does not change the TR (sð0;1Þ¼sð1;1Þ). The activa-tion of/2ats
1 ð Þ
2 ands
2 ð Þ
1 produced the ‘off’ switchsð1;0Þ!sð1;1Þ. This sug-gests that/2inhibits the activation of the target by/1. The regulatory states a1¼ð1;0Þanda2¼ð1;1Þare observed in multiple time intervals constraining constrainingsð Þt to be equal tosð1;0Þfort2 sð Þ11;s
1 ð Þ 2
h i
[ 0;sð Þ2 1
h i
andsð1;1Þfor t2 s2ð Þ1;L
1 ð Þ
h i
[ sð Þ12;s 2 ð Þ 2
h i
. Figure (b) displays a diagram of the logic of the regulation model with!indicating activation andasuppression
Fig. 2.Graphical representation of the parameters of the TRS model. The
pro-files of the TFs,P/ðkjÞ, and their thresholds,q/j, define their activation
func-tions,aðjkÞðtÞ, and these in turn the observed activation statesa1;a2;. . .;aqand the associated time-intervals,Iaiand TRs,sai, which along with the initial
[image:3.612.319.547.55.141.2]c. Compute the updated mRNA expression,M0
kð Þt, of the target
in each experiment,k¼1;. . .;KusingEq. (2)and the likeli-hoodLðH0;yÞusingEq. (3).
3. Compute the acceptance ratio
aðH;H0Þ ¼pH 0 ð Þ
pð ÞH
LðH0;yÞ LðH;yÞ
pðHjH0Þ
pðH0jHÞ;
wherepð ÞH denotes the prior probability ofHandpðH0jHÞdenotes the probability of the moveH! H0. SetH¼H0with probability minf1;aðH;H0Þg.
4. Proposed0p dð 0jdÞand accept with probability minf1;aðd;d0Þg where
aðd;d0Þ ¼p d 0 ð Þ
p dð Þ Lðd0;yÞ Lðd;yÞ
p dð jd0Þ
p dð 0jdÞ
5. Drawr0
kandw0kfrom their full-conditional posterior
distribu-tionsp r0
kjy;Hnfrkg
andp w0
kjy;Hnfw0kg
k¼1,. . .,K.
Steps 4 and 5 are standard Metropolis Gaussian random-walk and Gibbs steps, respectively, while the moves in step 1, which sample the regulatory associations, constitute trans-dimensional jumps. The first two moves in step 1, i.e. moving threshold (M) and swapping regulator (S), keep the same number of regulators, while the last two moves, adding (B) and removing (D) a regulator, change the number of regulators by 1.
2.2.1 Proposal distributions
FollowingGreen (1995), we set the move probabilities in step 1 as
pBð Þ ¼ cmin 1; pðþ1Þ
pð Þ
;pDð Þ ¼ cmin 1; pð Þ pðþ1Þ
;
wherecis a constant set as large as possible subject topBð Þ þ pDð Þ pBD2ð0;1Þfor all numbers of regulators¼1;2;. . .; max N.
The latter ensures thatpBð Þ andpDð Þ satisfy the balance equation pð ÞpBð Þ ¼ pðþ1ÞpDðþ1Þ, for all < max, while they are set
as large as possible subject to their sum never exceeding a boundary
pBDset to control the number of attempted trans-dimensional moves during MCMC sampling. The probabilities of (M) and (S), respect-ively, are chosen as pMð Þ ¼ ~pð1pBð Þ pDð ÞÞ and pSð Þ ¼ð1~pÞð1pBð Þ pDð ÞÞ with p~2ð0;1Þ controlling how we
split the probability of model moves in the same-dimension between regulator swaps and threshold moves.
A truncated normal distribution is used for the proposal prob-ability of the regulator threshold levelpðq0
/jq/Þin move (M) with
mean equal to the current valueq/, variancer2qtuned to control the
magnitude of the jumps and truncation bounds restricting the jumps within the range,R/, of the profile of/across experiments. The
truncation ensures that no regulator inUis redundant. A uniform distribution on the profile range R/ for the unconditional
pro-posal probabilityp q0
/ is used for the newly sampled TFs in moves
S and B.
To derive the initial valuesMkð Þt0 and transcription rate
func-tionsskð Þt;k¼1;2;. . .;Kin step 2, we follow Denisonet al.(1998)
andJenkinset al.(2013)and use least squares estimation on the lin-ear model in Eq. 2ð Þ that substantially increases computational speed over a full Bayesian regression estimation while the differences in results, at least for our application, are indistinguishable. More specifically, here we apply the parametric weighted least squares method (seeGelmanet al., 2004) with weightswkð Þt set equal to the
inverse of a smoothing spline kernel estimateMbkð Þt of the target
mRNA expression. The parameter wk2½0;1 sampled in step 5
tunes estimation from ordinary least squares (wk¼0) to weighted
least squares (wk¼1) to allow for higher noise levels associated
with higher expression levels.
2.2.2 Prior distributions
A natural conjugate choice of prior distribution for the error vari-ancer2kis the scaled inverse-v2distribution withnk;0degrees of free-dom and scaler2
k;0, while a continuous uniform prior,Uð½0;1Þ, can be used for the parameterwk. The latter results in a full conditional posterior distributions that can be numerically computed. Alternatively, a full conditional least squares estimate ofwkcan be derived (see SI section 4). A gamma prior distribution is used for the degradation rated, while the number of regulators,, is assumed to be Poisson with parameterk.
Prior distributions are also formulated for the set of transcription factors, U, and their threshold levels, q/. Here, we consider two
scenarios motivated by the real data examples discussed below, but we emphasize that in principle any other proper distribution formu-lated based on external knowledge can be used. In the first scenario we assume that there is very little prior information and use uniform prior distributions for the set of regulators and for the threshold levels. The second scenario assumes that transcriptional switches are more likely to be caused by substantial changes in the TF levels. Hence, the overall dynamics of any candidate regulator, as quantified by the range of its (smoothed) profile across experiments, are used to compute the prior for the set of TFs and the temporal dynamics, as quantified by the gradient of the smoothed profile, are employed for the prior of the threshold levels (see SI section 3 for details).
3 Simulation studies
3.1 Repressed activation network
In this simulation study, a target gene is assumed to be observed sim-ultaneously with six candidate TFs in two experimental conditions over a period ofL¼10 hours with measurements recorded every about 0.5–1.5 hours and 4 replicates per experiment to reflect a real-istic sample size scenario. The simulated profiles of the TFs and the target gene are the sum of a deterministic profile,Xh tð Þ(X¼103), and normal measurement error with standard deviationr¼20pffiffiffiffiX
imposing slightly higher noise levels compared to the real data con-sidered in the next section.
The regulation of the target gene is the repressed activation shown inFigure 1. The profiles,h(t), of the first two candidate TFs, f1andf2, are the same as inFigure 1, but four alternative TFs and
the target gene itself are also considered here as candidate TFs. The third candidatef3has the same profile asf2in experiment 2, but
un-likef2, its profile is also the same in experiment 1. The fourth TFf4
has constant low levels in the first experiment and constant high lev-els in the second experiment and could potentially explain differ-ences between all transcription rates of the target gene of each experiment. Candidatef5is a reflection off2and thus it provides an
alternative regulation model in whichf1andf5are AND activators
(i.e. both are present for activation) of the target. Finally, the profile off6has a similar form tof1but with a smaller range.
The profiles,h(t), described above are derived as solutions of an ODE system with transcription of the target being regulated byf1
andf2through Hill Functions of the nuclear concentration of the TF
apply the TRS methodology to these datasets, it is necessary to ap-proximate the protein profiles of the candidate TFs from their mRNA expression levels. We do this by fitting splines to derive a continuous mRNA expression profile and using Wild bootstrap (Wu, 1986) to characterize the noise levels around the smoothed ex-pression. Then, an ODE model could be used to derive the protein profiles from the smoothed expression profiles, but this requires knowledge of the translation and protein degradation rate. Another approach is based on the standard assumption in reverse engineering that the TF protein level is a delayed or linear function of its mRNA expression level. Supplementary Figure S1–S2 in SI provide exam-ples of the derivation of the expression profilePfð Þt using both of
these methods. This issue is discussed further in SI section 2. Informative prior distributions are constructed as described above (see SI Supplementary Fig. S6). The RJMCMC algorithm is run for 1M iterations with execution time about 1.25 hours (2.5-GHz Intel Core i7 processor). The algorithm appears to quickly converge (see SI Supplementary Fig. S8). The result of the posterior inference using our RJMCMC algorithm are summarized below.
The algorithm assigns the largest posterior probability 0.79 to models with two TFs and a probability of 0.18 to models with three TFs. The estimate of the posterior probability of TFf1to be inUis
approximately 0.72 with its alternative TFf6given a smaller
prob-ability 0.30 as it is a priori less preferable (if no prior information is imposed on the TF set, the probabilities are 0.44 and 0.37 see SI Supplementary Fig. S11). The inhibitorf2has posterior probability
near 1, with its alternativef5being much less sampled as it has a
more noisy profile. The other candidatesf3andf4as well as the
tar-get (autoregulation) have much smaller posterior probabilities. The setff1;f2ghas the biggest posterior probability (0.56), whileff2;f6g has probability 0.23 and other regulation sets much smaller proba-bilities. The fit of the TRS model to the simulated data under these regulation sets is excellent (see SI Supplementary Fig. S9).
Results for the case of non-informative priors applied to the same choice of TF and their threshold and for a Poisson prior on the number of TFs with larger mean parameter (k¼1) are given in the SI. They demonstrate the importance of using a small parameter value for the Poisson prior to avoid overfitting and the use of in-formative priors on the TF set and their thresholds for attaining more robust results.
We also apply the GRNInfer tool (Wanget al., 2006) to the same simulated data. The tool runs extremely fast, with computa-tional time a few seconds, and provides estimates for the regression coefficients for each of the candidate TFs which constitutes more limited information than this provided in TRS. In this study, the GRNInfer tool detects the activation of the target but picksf6, the
alternative of the true regulator f1, as the activator (coefficient
0.85). A large coefficient (–1.3) is allocated to the target gene, but the tool cannot conclude whether this is due to degradation or self-regulation. The tool also fails to detect the repression of this activa-tion caused byf2with all coefficients except for the target andf6in
0:05;þ0:05
ð Þ(see also SI Sect. 5.1.7).
3.2 SOC1 transcription regulation
We also consider the complex regulation of the SUPPRESSOR OF OVEREXPRESSION OF CONSTANS (SOC1) gene in the system related to flowering time published inLeal Valentimet al.(2015). The gene SOC1 is regulated by five TFs, while three more genes are part of the network (seeFig. 3).
In a similar fashion to the example in the previous section, we simulate data in four experimental conditions where the system is
assumed to be observed for 10 days with 0.5–1.5 days observation frequency. The simulated profiles are again the sum of Xh tð Þ (X¼103), whereh(t) corresponds to solutions of an ODE system (see SI sect. 5.2) and normal measurement error withr¼20pffiffiffiffiX. The simulated mRNA expression levels of all genes are used to ap-proximate the TF profiles using splines and the Wild bootstrap method as above. Informative prior distributions are constructed and the TRS RJMCMC is run for 1M iterations in about 2.5 h. The increased execution time compared to the first simulation study is due to the larger amount of data and the larger regulation sets.
The algorithm detects the true TFs with very high probabilities with some of the other genes also being sampled. The most likely model is the true regulator set with the regulator set that does not in-clude SOC1 also receiving higher probability (0.43 and 0.20, re-spectively) than other regulator sets. The true interactions can be correctly deduced from the TRS algorithm and the data fit is again excellent (see SI Supplementary Fig. S21).
We also apply the GRNInfer tool to the same data. The tool in-correctly allocates the largest coefficient (1.59) to the FD gene that is not a TF. The repressor SVP and AP1, which is not a TF, receive a relatively large negative coefficient (–0.42 and –0.43, respectively). The other genes receive smaller coefficients with exception the target gene SOC1 (–0.80), but the tool is unable to infer whether this is due to auto-suppression or degradation (see also SI Sect. 5.2.4).
The two simulation studies clearly demonstrate that the TRS algo-rithm is well able to detect the correct regulation model, along with possible alternative regulation models, under realistic noise levels and sample sizes compatible with our observed data forA.thaliana.
4 Application to
Arabidopsis thaliana
Microarray technology was used to extract mRNA expression pro-files of the response ofA.thalianato multiple biotic stresses, namely Botrytis cinerea (Windram et al., 2012), P.syringae hrpA and P.syringaeDC3000 (Lewiset al., 2015). The response to Botrytis was observed in 4 replicates every 2 hours over a period of 48 hours, while forP.syringaehrpA and DC3000 the period was 13.5 hours, with observation frequencies ranging from 1 to 2.5 hours.
[image:5.612.358.507.56.158.2]We focus on two target genes of interest, namely Arabidopsis NAC 092 (ANAC092, ORE1) (Duet al., 2014) and SCARECROW-LIKE 3 (SCL3, Heo et al., 2011), which were differentially ex-pressed in the observed stresses. A number of potential TFs were identified through Y1H technology. Specifically, twenty candidate regulators were identified for ANAC092, among them three from the TCP family, two from the ERF family and three from the Arabidopsis NAC family. For SCL3, fifteen regulating genes were identified, which include three from the TCP family and two from the ERF family. All gene names and GST IDs are derived from CATMA database (Croweet al., 2003) and provided in SI Sect. 6.1.
Fig. 3.Diagram of the flowering time ofA. thalianasystem (Leal Valentim
To approximate the protein profiles of the candidate TFs from their mRNA expression observed in the microarray experiments, we fitted splines and used the wild bootrstap method as above (see SI sect. 2). We constructed informative prior distributions, as described in previous sections (see SI Supplementary Figs S22–S26), for the set of transcription factors and their threshold levels. In both cases a Poisson prior (k¼0:15) is used for the number of tran-scription factors, a vaguely informative scaled v2 distribution (nk;0¼0:001;r2k;0¼0:001) is used as a prior for the precisionr2k
and an informative Gamma distribution with mean 0.345 corres-ponding to an approximate half life of 2his used to specify the
degradation rated(sd 0.1543). The trans-dimensional MCMC algo-rithm described in earlier sections is run for 1M iterations (execution times 2.6 and 3.2 hours).
The following results were obtained for posterior inference. For gene ANAC092 (seeFig. 4) the posterior probability of having 4 regula-tors,pð¼4jyÞ, out of 20 candidates was estimated to be 0.47, while
pð¼3jyÞ 0:17 andpð¼5jyÞ 0:25. The candidates GBF6 and AT1G25550 received high posterior probabilities to be regulators, while TCP21, ANAC025, ANAC064, Rap2.6L and AT5G58900 also received higher posterior probabilities than the rest of the candidates (0:77;0:70;0:36;0:30;0:30;0:29;0:28, respectively). The pair of can-didates GBF6 and AT1G25550 have much larger posterior probability (0.52) to be part of the regulators compared to other pairs ( 0.25), with AT1G25550 activating the target both inBotrytisandP.syringae DC3000 and GBF6 acting as a repressor. The candidates TCP21, ANAC025, ANAC064, Rap2.6L are sampled alternatively to block the repression caused by GBF6. Such hypothesized interactions could be tested by biologists in additional experiments.
[image:6.612.69.293.196.586.2]Regarding the SCL3 gene (seeFig. 5), the posterior probability of having 5 regulators, pð¼5jyÞ, out of 15 candidates was
Fig. 4.Posterior inference for the TRS model of the target gene ANAC092.
[image:6.612.320.542.293.680.2](a) The smooth protein profiles (solid line) along with the estimated threshold (dotted line) of the TFs AT1G25550 (AT1), ANAC064 (A64), GBF6 (G), Rap2.6L (R) under two of thea posteriorimost likely models (red and green colors) are displayed in the first four rows of the three panels on the left (Botrytis, P. syringaehrpA and DC3000, respectively). The right panel shows the esti-mated posterior density (first 4 rows) for the threshold level of each TF with units linking to the level of threshold in the other panels and the posterior prob-abilities for the number of TFs (fifth row) and for the candidate to be involved in any regulation model (last row). The three panels on the left of the fifth row give the estimated transcription profiles of the target gene and in the bottom row the observed (crosses) and fitted (red solid and green dashed line) mRNA profile of the child gene under the two most likely models. (b) The regulation diagram summarizes the logics of these TRS models (Color version of this figure is avail-able atBioinformaticsonline.)
Fig. 5.Posterior inference of the TRS model of the target gene SCL3. The
estimated to be 0.43, while pð¼6jyÞ 0:32. High posterior probabilities were estimated for the candidates TCP23, Rap2.6L, ERF10 and ABF4 (0:93;0:77;0:68;0:62, respectively) to be regu-lators. The couple of regulators TCP23 and Rap2.6L are part of the regulator set with probability 0.74, while the triplet that also includes ERF10 with probability 0.42. The most likely regula-tion logics suggest that ERF10 is a repressor, while Rap2.6L and ABF4 are activators with their activation being repressed by TCP23. ORA59 is also a repressor on the second most likely regu-lation logic.
5 Discussion
In this study we suggest the use of the TRS model as a simple bio-logically interpretable model to draw inference about possible regu-latory logics between a set of putative TFs and a gene of interest. Assuming that any interactions are consistent across different ex-periments and over time imposes constraints that, in principle, allows us to identify the set of regulatory TFs and to deduce their dy-namic regulation logic. The algorithm for Bayesian inference on the TRS model parameters is trans-dimensional and is efficiently solved by the suggested RJMCMC. The advantage of this methodology is that different combinations of parents are sampled within the algo-rithm allowing us to identify a set of all plausible regulation models that are compatible with the data and to rank them according to their posterior model probabilities.
We showed that the methodology works well for two simula-tion studies with realistic sample sizes and noise levels, and pre-sent results of its application to the transcriptional regulation of two target genes of Arabidopsis Thaliana under multiple biotic stresses. The algorithm indeed suggests a few alternative regulation models and it is clear that despite its simplicity it can infer regula-tion logics to a greater degree of complexity than existing methods.
We note that further checks against a potentially much larger set of parents can be carried out to see if other potential TFs exist, which may not have been included in the set of candidate parents and which may have similar transcription profiles across experi-ments. Such genes can be identified by performing a cluster analysis across experiments as, for example, suggested inPolanski
et al. (2014). In the case of our A. thalianadata examples the clusters of interest only contained very few TFs with jointly similar profiles and most of them could be ruled out on the basis of other biological information. However, if combined with a cluster analysis of the TFs across experiments as a pre-processing step, the TRS methodology has the potential to be applied to very large sets of putative TFs.
In order for the methodology to work well it is essential that the magnitude of the observations between experiments has comparable scales. In cases where the measurements are not comparable, an add-itional computation is necessary to bring them to some relative measurement unit.
Finally we note that an extension to a network methodology with multiple targets considered simultaneously is within reach and can be built on the suggested TRS approach.
Acknowledgements
We thank the PRESTA consortium for high-resolutionA. thalianamicroarray and motif data. We also thank S. Calderazzo, K. Hassall and H. Momiji for discussions on the methodology.
Funding
This work was supported by the Biotechnology and Biological Sciences Research Council [BB/F005806/1, BB/K003097/1], the Engineering and Physical Sciences Research Council [EP/C544587/1 to DAR] and the European Union Seventh Framework Programme (FP7/2007-2013) under grant agreement n305564.
Conflict of Interest: none declared.
References
Alon,U.S. (2014)An Introduction to Systems Biology: design Principles of Biological Circuits. Chapman & Hall/CRC, Boca Raton, FL.
Bornholdt,S. (2008) Boolean network models of cellular regulation: prospects and limitations.J. R. Soc. Interface,5, S85–S94.
Crowe,M.L.et al. (2003) CATMA: a complete Arabidopsis GST database. Nucleic Acids Res.,31, 156–158.
Denison,D.G.T.et al. (1998) Automatic Bayesian Curve Fitting.J. R. Stat. Soc. Ser. B Stat. Methodol.,60, 333–350.
Du,J.et al. (2014) Nitric oxide induces cotyledon senescence involving co-operation of the NES1/MAD1 and EIN2-associated ORE1 signalling path-ways in Arabidopsis.J. Exp. Bot.,65, 4051–4063.
Faith,J.J.et al. (2007) Large-scale mapping and validation ofEscherichia coli tran-scriptional regulation from a compendium of expression profiles.PLoS Biol.,5, e8. Gelman,A. et al. (2004) Introduction to regression models. Chapter 14. Bayesian Data Analysis. 2nd ed. Chapman & Hall/CRC, Boca Raton, FL. Goda,H.et al. (2008) The AtGenExpress hormone and chemical treatment
data set: experimental design, data evaluation, model data analysis and data access.Plant J.,55, 526–542.
Green,P.J. (1995) Reversible jump Markov chain Monte Carlo computation and Bayesian model determination.Biometrika,82, 711–732.
Han,S.et al. (2014) A Full Bayesian Approach for Boolean Genetic Network Inference.Plos One,9, e115806.
Hecker,M.et al. (2009) Gene regulatory network inference: data integration in dynamic models-a review.Biosystems,96, 86–103.
Heo,J.-O.et al. (2011) Funneling of gibberellin signaling by the GRAS tran-scription regulator SCARECROW-LIKE 3 in the Arabidopsis root.Proc. Natl. Acad. Sci. USA,108, 2166–2171.
Hickman,R.et al. (2013) A local regulatory network around three NAC tran-scription factors in stress responses and senescence in Arabidopsis leaves. Plant J.,75, 26–39.
Jenkins,D.J.et al. (2013) A temporal switch model for estimating transcrip-tional activity in gene expression.Bioinformatics,29, 1158–1165. Kiani,N.A.et al. (2016) Evaluating network inference methods in terms of
their ability to preserve the topology and complexity of genetic networks. Semin. Cell Dev. Biol.,51, 44–52.
Kilian,J.et al. (2007) The AtGenExpress global stress expression data set: protocols, evaluation and model data analysis of UV-B light, drought and cold stress responses.Plant J.,50, 347–363.
Klipp,E.et al. (2016).Systems Biology a Textbook. Wiley-VCH, Weinheim. Latchman,D.S. (2005)Gene Regulation: A Eukaryotic Perspective, Taylor &
Francis, New York.
Leal Valentim,F. et al. (2015) A quantitative and dynamic model of the Arabidopsis flowering time gene regulatory network.Plos One,10, e0116973. Levine,M.et al. (2014) Looping back to leap forward: transcription enters a
new era.Cell,157, 13–25.
Lewis,L.A.et al. (2015) Transcriptional dynamics driving MAMP-triggered immunity and pathogen effector-mediated immunosuppression in Arabidopsis leaves following infection with pseudomonas syringae pv to-mato DC3000.Plant Cell,27, 3038–3064.
Madar,A.et al. (2010) DREAM3: network inference using dynamic context likelihood of relatedness and the inferelator.Plos One,5, e9803.
Marbach,D.et al. (2010) Revealing strengths and weaknesses of methods for gene network inference.Proc. Natl. Acad. Sci. USA,107, 6286–6291.
Meyer,C.A. and Liu,X.S. (2014) Identifying and mitigating bias in next-generation sequencing methods for chromatin biology.Nat. Rev. Genet.,
15, 709–721.
Ou-Yang,L.et al. (2017) Identifying differential networks based on multi-platform gene expression data.Mol. BioSystems,13, 183–192.
Ouwerkerk,P.B. and Meijer,A.H. (2001) Yeast one-hybrid screening for DNA-protein interactions. Curr. Protoc. Mol. Biol., Chapter 12, Unit 12.12.
Penfold,C.A.et al. (2012) Nonparametric Bayesian inference for perturbed and orthologous gene regulatory networks. Bioinformatics, 28, i233–i241.
Polanski,K. et al. (2014) Wigwams: identifying gene modules co-regulated across multiple biological conditions. Bioinformatics,30, 962–970.
Strimmer,K. (2003) Modeling gene expression measurement error: a quasi-likelihood approach.BMC Bioinformatics,4, 1–10.
Thorne,T. and Stumpf,M.P.H. (2012) Inference of temporally varying Bayesian networks.Bioinformatics,28, 3298–3305.
Titsias,M.K.et al. (2012) Identifying targets of multiple co-regulating tran-scription factors from expression time-series by Bayesian model compari-son.BMC Syst. Biol.,6, 1–21.
Wang,Y.et al. (2006) Inferring gene regulatory networks from multiple micro-array datasets.Bioinformatics,22, 2413–2420.
Weber,M. et al. (2013) Inference of dynamical gene-regulatory networks based on time-resolved multi-stimuli multi-experiment data applying NetGenerator V2.0.BMC Syst. Biol.,7, 1.
Windram,O.et al. (2012) Arabidopsis Defense against Botrytis cinerea: chron-ology and regulation deciphered by high-resolution temporal transcriptomic analysis.Plant Cell,24, 3530–3557.
Wu,C.F.J. (1986) Jackknife, bootstrap and other resampling methods in re-gression analysis.Ann. Stat.,14, 1261–1295.
Yip,K.Y.et al. (2010) Improved reconstruction of in silico gene regulatory net-works by integrating knockout and perturbation data.Plos One,5, e8121. Yu,J.et al. (2004) Advances to Bayesian network inference for generating