Use of an Improved Piezoelectric Biosensor
Marco Bisoffi,aVirginia Severns,a,cDarren W. Branch,bThayne L. Edwards,bRichard S. Larsonc
Department of Biochemistry and Molecular Biology, University of New Mexico Health Sciences Center, Albuquerque, New Mexico, USAa; Sandia National Laboratories, Biosensor Program, Albuquerque, New Mexico, USAb; Department of Pathology, University of New Mexico School of Medicine, Albuquerque, New Mexico, USAc
Disasters can create situations in which blood donations can save lives. However, in emergency situations and when resources are depleted, on-site blood donations require the rapid and accurate detection of blood-borne pathogens, including human munodeficiency virus types 1 and 2 (HIV-1 and HIV-2). Techniques such as PCR and antibody capture by an enzyme-linked im-munosorbent assay (ELISA) for HIV-1 and HIV-2 are precise but time-consuming and require sophisticated equipment that is not compatible with emergency point-of-care requirements. We describe here a prototype biosensor based on piezoelectric ma-terials functionalized with specific antibodies against HIV-1 and HIV-2. We show the rapid and accurate detection of HIV-1 and HIV-2 in both simple and complex solutions, including human serum, and in the presence of a cross-confounding virus. We re-port detection limits of 12 50% tissue culture infective doses (TCID50s) for HIV-1 and 87 TCID50s for HIV-2. The accuracy, pre-cision of measurements, and operation of the prototype biosensor compared favorably to those for nucleic acid amplification. We conclude that the biosensor has significant promise as a successful point-of-care diagnostic device for use in emergency field applications requiring rapid and reliable testing for blood-borne pathogens.
I
t is readily appreciated that in disaster situations, the efficiency of the emergency medical response can be greatly hampered by factors that can overwhelm or eliminate medical care resources, such as having a larger-than-expected number of trauma victims in need of untainted blood products or, on the positive side, hav-ing a larger-than-expected number of donors whose blood needs to be tested rapidly for the presence of potential blood-borne pathogens, including HIV (1). However, guidelines for which technologies are most reliable in such situations are lacking, and sophisticated laboratory equipment and aseptic conditions for the detection of HIV are not amenable for use in emergency situa-tions, such as on-site medical care sites or rudimentary field lab-oratories and hospitals. Thus, there is a great need for robust, simple, reliable, and rapid point-of-care detection devices for emergency conditions (1,2).Typical detection methods for the diagnosis of blood-borne pathogens, such as HIV, as established widely in medical labora-tories, include the enzyme-linked immunosorbent assay (ELISA) and nucleic acid amplification by PCR. However, ELISAs and PCRs require specific reagents, such as special buffers and en-zymes, and sophisticated, large, and costly pieces of equipment, not all of which are amenable to field application. Furthermore, analyte preprocessing is often necessary for obtaining optimal re-sults with these technologies (3–6). In contrast, mass detection devices based on piezoelectric materials capable of generating sur-face acoustic waves (SAW) that can be applied to biological sam-ples have long been recognized to yield relatively simple, robust, and rapid measurements in a real-time mode (4,6–10). In partic-ular, this technology has the potential to enable label-free, rapid, cost-effective, and sensitive detection of pathogens under chal-lenging conditions, including emergency situations.
We previously reported on a lithium tantalate (LiTaO3)-based acoustic wave biosensor that has undergone extensive technical development in our laboratories. The first version, operating at 103 MHz, was used to detect bacterial spores ofBacillus
thurin-giensis, a pathogen simulant for Bacillus anthracis, at or below
inhalational infectious levels (11). A second version, operating at 325 MHz, was adapted to detect viruses, including the category A bioagent Sin Nombre virus (SNV), a member of the genus
Han-tavirus, familyBunyaviridae(12). We have further optimized the
chip fabrication and design and report here on its use for the detection of HIV and the differentiation between the two different serotypes, HIV-1 and HIV-2, in complex matrices such as human blood.
MATERIALS AND METHODS
Fabrication and functionalization of biosensor chips.A new generation of sensor chips with altered physical dimensions and an increased area occupied by the interdigital transducers (IDTs) was prepared as wafers by lithographic deposition and patterning of the IDT and the silicon dioxide (SiO2) waveguide layers, followed by cutting of the final format of the 4-lane chips as described previously (12). To prepare the chips for anti-body functionalization, they were coated with 90% toluene and 10% 3-glycidyloxypropyl trimethoxysilane in an oven at 60°C for 90 min, fol-lowed by rebaking at 100°C for 60 min. Each lane was individually coated with antibodies at a concentration of 10g/ml in phosphate-buffered saline (PBS). We used mouse monoclonal antibodies (IgG1 isotype) spe-cific for recombinant HIV-1 glycoprotein (gp) gp24 (a capsid antigen) and HIV-2 gp39 (an envelope glycoprotein) (catalog no. sc-57811 and sc-73301, respectively; Santa Cruz Biotechnology, Santa Cruz, CA), mouse IgG1 antibody isotype control [F(ab)2 fragment], and mouse monoclonal anti-hepatitis C virus (E2 protein) control (ab20852; Abcam, Cambridge, MA). For the reusability tests, analytes were washed in high-salt buffer (0.5 M NaCl) for 15 min and then washed in PBS multiple times
Received21 November 2012Returned for modification21 December 2012
Accepted11 March 2013
Published ahead of print20 March 2013
Address correspondence to Marco Bisoffi, [email protected]. V.S. and M.B. contributed equally to this article.
Copyright © 2013, American Society for Microbiology. All Rights Reserved. doi:10.1128/JCM.03041-12
on May 16, 2020 by guest
http://jcm.asm.org/
before refunctionalization. Typically, two lanes were functionalized with antibodies specific for the targeted analyte, and two lanes were function-alized with isotype control antibodies (called reference lanes).
Provenance and handling of HIV-1 and HIV-2.HIV-1 and HIV-2 samples, consisting of solutions containing intact and infective viruses, as well as fragmented viral particles, were obtained from the National Insti-tutes of Health (NIH) AIDS Research and Reference Reagent Program (Germantown, MD). The concentrations of the HIV samples obtained from the NIH AIDS Research and Reference Reagent Program were pro-vided in 50% tissue culture infective doses (TCID50s)/ml. This is an end-point measurement for live virus, which is a measure of importance for point-of-care use (13). HIV-1 samples of different viral concentrations were sent to TriCore Reference Laboratories (Albuquerque, NM) and subjected to nucleic acid amplification by reverse transcriptase quantita-tive PCR using the Cobas AmpliPrep TaqMan approach as described pre-viously (14). The Cobas AmpliPrep TaqMan test is intended for use in conjunction with clinical presentation and other laboratory markers of disease progress for the clinical management and prognosis of HIV-1-infected patients and determines RNA copies per milliliter (RNA cp/ml). This analysis revealed a conversion factor of 562.53 (i.e., 1 TCID50⫽ 562.53 RNA copies). This number is divided by a factor of 2 to determine the number of viral particles due to the fact that the HIV virus carries 2 RNA copies. A similar conversion was not possible for HIV-2, as there is no validated PCR assay for this serotype. All solutions containing intact and fragmented HIV particles were stored and handled under biosafety level 2 (BSL2) conditions per state and federal laws and University of New Mexico guidelines. HIV samples were stored in aliquots of 50l in screw-cap safety microtubes at⫺80°C until they were ready to be used. When ready to be tested, the samples were thawed on ice and supplemented with phosphate-buffered saline (PBS) (137.0 mM NaCl, 2.7 mM KCl, 10.0 mM Na2HPO4·2H2O, 2.0 mM KH2PO4[pH 7.4 with HCl]), a physiological buffer in which viral particles are stable, or human serum (obtained from healthy volunteers per the University of New Mexico [UNM] Health Sci-ences Center institutional review board [IRB]-approved protocol). All HIV samples were prepared fresh for each experiment.
Virus detection by biosensor.Detection of HIV was conducted in BSL2-certified biosafety cabinets. Data expressed as phase (mass) shift (⌬) were recorded with the LabVIEW (National Instruments, Austin, TX) program as described previously (12). All measurements represent multiples of at least three. Viruses were diluted in 100l of PBS or PBS containing 50% human serum and applied to the biosensor. All measure-ments were taken at 5 min after addition of the agent.
Statistics.All statistical analyses and graphic displays of data were generated with GraphPad Prism software version 5.01 (GraphPad Soft-ware, Inc., La Jolla, CA). All phase shift (⌬) data points for individual detections were generated in at least duplicate lanes and on at least three different chips unless indicated otherwise. Each data point presents the mean⫾the standard error of the mean (SEM). The statistical differences between groups of mean phase shifts (⌬) were determined using the Studentttest;Pvalues of⬍0.05 were considered to be statistically signif-icant.
RESULTS
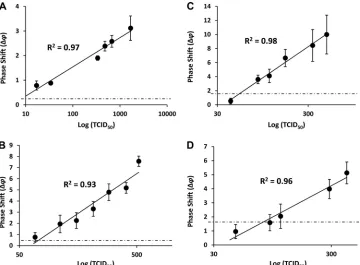
Quantitative detection of HIV-1 and HIV-2 in defined buffer.In analogy to our previous report on the detection of coxsackievirus B4 and the category A hantavirus Sin Nombre virus (SNV) (12), we functionalized the biosensor with antibodies raised against the surface glycoproteins gp24 and gp39, specific for HIV-1 and HIV-2, respectively. HIV-1 and HIV-2 were first detected in a defined buffer solution, i.e., phosphate-buffered saline (PBS). HIV-1 was applied in a range of 17 to 1,680 TCID50s. Phase shift (⌬) measurements were taken over a period of 10 min, although the maximal signal was reached typically between 1 and 5 min. The⌬value was recorded in quadruplicate at 5 min for each
concentration of HIV-1 and resulted in a dose-dependent in-crease, with⌬values ranging from 0.78⫾0.18 to 3.11⫾0.49 (Fig. 1A). There was a linear relationship between the TCID50and the⌬value for this range of viral particles, with a correlation coefficient (R2) of 0.97. A limit of detection (LOD) of 12 TCID
50s was calculated for HIV-1 by linear regression and using a back-ground ⌬ value of 0.45 ⫾ 0.44 (value observed with buffer alone). HIV-2 was applied in a range of 68 to 520 TCID50s. As with HIV-1, the maximal⌬values were typically reached between 1 and 5 min. The⌬value was recorded in quadruplicate at 5 min for each concentration of HIV-2 and resulted in a dose-dependent increase, with⌬values ranging from 0.76⫾0.41 to 7.57⫾0.46 (Fig. 1B). Similar to that for HIV-1 detection, there was a linear relationship between the TCID50and the⌬value for this range of viral particles, with a correlation coefficient (R2) of 0.93. An LOD of 87 TCID50s was calculated for HIV-2 by linear regression and using a background⌬value of 0.55⫾0.51 (buffer alone).
Collectively, these results indicate that the biosensor rapidly detects HIV-1 and HIV-2 in defined buffers with a high linearity of detection.
Quantitative detection of HIV-1 and HIV-2 in human serum. To determine the capability of the biosensor to detect HIV viruses under more realistic conditions, we spiked HIV-1 and HIV-2 par-ticles into PBS containing 50% human serum. As with the detec-tions in buffer, maximal phase shifts were reached within 5 min of the addition of virus. HIV-1 was applied in a range of 42 to 480 TCID50s. Quadruplicate measurements at 5 min resulted in a dose-dependent increase, with⌬values ranging from 0.53⫾ 0.40 to 9.99⫾2.76 (Fig. 1C). There was a linear relationship between the TCID50and the⌬value for this range of viral par-ticles, with a correlation coefficient (R2) of 0.98. An LOD of 54 TCID50s was calculated for HIV-1 by linear regression and using a background⌬value of 1.68 ⫾0.83 (buffer or serum alone). HIV-2 was applied in a range of 46 to 406 TCID50s. Quadruplicate measurements at 5 min resulted in a dose-dependent increase, with⌬values ranging from 0.96⫾0.50 to 5.13⫾0.77 (Fig. 1D). There was a linear relationship between the TCID50and the⌬ value for this range of viral particles, with a correlation coefficient (R2) of 0.96. An LOD of 79 TCID
50s was calculated for HIV-2 by linear regression and using a background⌬value of 1.62⫾0.47 (buffer or serum alone).
Collectively, these results indicate that the biosensor rapidly detects HIV-1 and HIV-2 in the presence of human serum with a high linearity of detection.
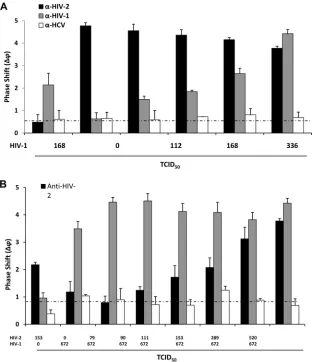
Detection of HIV-1 and HIV-2 in the presence of a cross-confounding virus.To determine the specificity of HIV detec-tion, we conducted a series of experiments in which we function-alized different lanes of the sensor with antibodies against HIV-1 (anti-gp24), HIV-2 (anti-gp39), or the unrelated hepatitis C virus (HCV) (anti-E2 protein) and applied buffer solutions containing both HIV-1 and HIV-2 particles. Increasing amounts of HIV-1 (0 to 672 TCID50s) in the presence of a constant load of HIV-2 (520 TCID50s) were applied, and quadruplicate measurements were taken at 5 min. A dose-responsive⌬value of 0.63⫾0.27 to 4.42 ⫾0.18 resulted from the lane functionalized with the HIV-1 an-tibodies, while a constantly high average⌬value of 4.32⫾0.38 resulted from the lane functionalized with the HIV-2 antibodies. The influence of the cross-confounding viral presence was esti-mated by determining the responses for 168 TCID50s of HIV-1 (equivalent to 47,252 viral particles) in the absence or presence of
on May 16, 2020 by guest
http://jcm.asm.org/
520 TCID50s of HIV-2. The⌬values of 2.14⫾0.52 and 1.84⫾ 0.06 were measured in the absence and the presence of HIV-2, respectively, which represents only a 14% difference in signal. Fur-thermore, 520 TCID50s of HIV-2 in the absence of HIV-1 did not activate the lane coated with antibodies against HIV-1 above the signal obtained with buffer alone (⌬value, 0.60⫾0.20). The lane coated with the anti-HCV antibodies resulted in a value that was consistently low and barely above the buffer background⌬ value of 0.68⫾0.08 under all conditions tested (Fig. 2A). Further-more, in the presence of confounding HIV-2, there remained a linear relationship between the HIV-1 TCID50and the⌬value, with a correlation coefficient (R2) of 0.94. Under these conditions, an LOD of 74 TCID50s (similar to that in the single-detection mode in serum [Fig. 1C]) was calculated for HIV-1 by linear re-gression.
Similarly, increasing amounts of HIV-2 (0 to 520 TCID50s) in the presence of a constant load of HIV-1 (672 TCID50s) were applied, and quadruplicate measurements were taken at 5 min. Dose-responsive⌬values of 1.18⫾0.38 to 3.77⫾0.09 resulted from the lane functionalized with the HIV-2 antibodies, while a constantly high average⌬value of 4.13⫾0.37 resulted from the lane functionalized with the HIV-1 antibodies. When both HIV-1 and HIV-2 were present, a higher phase shift was recorded, most likely due to the added mass (Fig. 2B). The influence of a cross-confounding viral presence was estimated by determining the re-sponses for 153 TCID50s of HIV-2 in the absence or presence of 672 TCID50s of HIV-1.⌬values of 2.18⫾0.09 and 2.08⫾0.35 were measured in the absence and the presence of HIV-1, respec-tively, and represent only a 5% difference in signal. Furthermore,
672 TCID50s of HIV-1 in the absence of HIV-2 did not signifi-cantly activate the lane coated with antibodies against HIV-2 above the signal obtained with buffer alone (⌬value, 0.83 ⫾ 0.18). The lane coated with the anti-HCV antibodies resulted in values that were consistently low and barely above the buffer back-ground ⌬ value of 0.82 ⫾ 0.26 under all conditions tested (Fig. 2B). Furthermore, in the presence of confounding HIV-1, there remained a linear relationship between the HIV-2 TCID50 and the⌬value, with a correlation coefficient (R2) of 0.98. Under these conditions, an LOD of 70 TCID50s (similar to that in the single-detection mode in serum [Fig. 1D]) was calculated for HIV-2 by linear regression.
Collectively, these results indicate that the biosensor rapidly and differentially detects HIV-1 and HIV-2 in the presence of the other virus type.
Precision and accuracy of HIV-1 and HIV-2 detection.Our long-term plan is to develop biosensors, such as the one presented in this work, for professional point-of-care use for the rapid and accurate diagnosis of HIV infections in the clinical setting. There-fore, we conducted experiments to determine the precision and accuracy of its performance. In these investigations, we deter-mined both “interchip” and “intrachip” variability; intrachip vari-ability was based on the fact that the chips utilized herein featured 4 lanes that were differentially functionalized with different anti-bodies. Our experiments included the use of different and alter-nating lanes as the reference or the probe. Typically, the same two lanes were used as references, and the same two lanes were used as probes on each chip. For all measurements, the readings of⌬ values were taken at 5 min after the addition of virus. Representa-FIG 1Detection of HIV-1 and HIV-2 in PBS buffer and human serum. Quadruplicate measurements (mean⫾standard error) were taken at 5 min after the addition of virus. Thexandyaxes indicate viral load in the TCID50(logarithmic scale) and phase shifts (⌬), respectively. (A) HIV-1 in defined buffer (PBS); (B)
HIV-2 in defined buffer (PBS); (C) HIV-1 in 50% human serum; (D) HIV-2 in 50% human serum. The solid lines represent the best-fit models and correlation coefficients (R2) for⌬values as a function of viral load. The horizontal dotted lines represent the background signals obtained with buffer or serum without
virus.
on May 16, 2020 by guest
http://jcm.asm.org/
[image:3.585.113.473.66.331.2]tive data for different loads of HIV-1 and HIV-2 in PBS buffer solutions, each determined on 5 individual chips, are shown in
Table 1. The data represent coefficients of variation (CVs) as per-centages, defined as the standard deviation divided by the mean for all phase shifts (⌬) measured in these experiments. The lane
variations ranged from 10.2%⫾0.6% to 19.3%⫾5.1% and from 13.9%⫾4.5% to 18.0%⫾1.8% for HIV-1 and HIV-2 at three different viral loads, respectively. The overall variations across all lanes on all chips for three different viral loads were 16.43%⫾ 5.7% and 15.8%⫾2.9% for HIV-1 and HIV2, respectively. Sim-FIG 2Detection of increasing amounts of HIV-1 in the presence of a constant amount of HIV-2 (A and B) or vice versa (C and D). (A and C) Viral loads are indicated in the TCID50s below thexaxis; theyaxis indicates phase shifts (⌬). Each bar represents quadruplicate measurements (mean⫾standard error) taken
at 5 min after the addition of virus. Gray bars represent lanes coated with anti-HIV-1 (gp24) antibodies, black bars represent lanes coated with anti-HIV-2 (gp39) antibodies, and white bars represent lanes coated with anti-HCV (E2) antibodies. (B and D) Data are displayed as the⌬values (yaxis) as a function of viral load (increasing HIV-1 [B] or HIV-2 [D] in the presence of a constant amount of the other virus; logarithmic scale,xaxis). The solid lines represent the best-fit models and correlation coefficientsR2for the⌬values as a function of viral load. The horizontal dotted lines represent the background signals obtained with buffer
[image:4.585.136.450.66.428.2]without virus. All measurements in panels A to D were made in defined buffer (PBS).
TABLE 1Precision and accuracy of HIV-1 and HIV-2 detection for different viral loads and with different lanes of the biosensor chipsa
HIV type
Load (TCID50s)b
CV (%)c
Mean⫾SD
Overall mean⫾SD
Lane 1 Lane 2
HIV-1 672 9.8 10.6 10.2⫾0.6 16.4⫾5.7
480 16.4 22.8 19.6⫾4.5
224 15.7 22.9 19.3⫾5.1
HIV-2 406 10.7 17.1 13.9⫾4.5 15.8⫾2.9
289 19.3 16.7 18.0⫾1.8
160 14.9 16.1 15.5⫾0.8
a
Data were obtained from 5 chips (each with 2 lanes coated with HIV-1 or HIV-2 antibodies and 2 lanes coated with control antibodies). All measurements were taken at 5 min after the addition of virus.
b
The viral loads shown for HIV-1 are equivalent to 189,010, 135,007, and 63,003 viral particles, respectively.
cCV (%), the percent coefficient of variation, is defined as the standard deviation divided by the mean for all phase shifts (⌬) measured.
on May 16, 2020 by guest
http://jcm.asm.org/
[image:4.585.40.543.588.687.2]ilar results were obtained when lanes were alternated for refer-ences (functionalized with unspecific IgG antibody) and at vari-ous other viral loads (data not shown).
Collectively, these results indicate that the biosensor detects HIV-1 and HIV-2 with a precision and an accuracy of approxi-mately 15% CV.
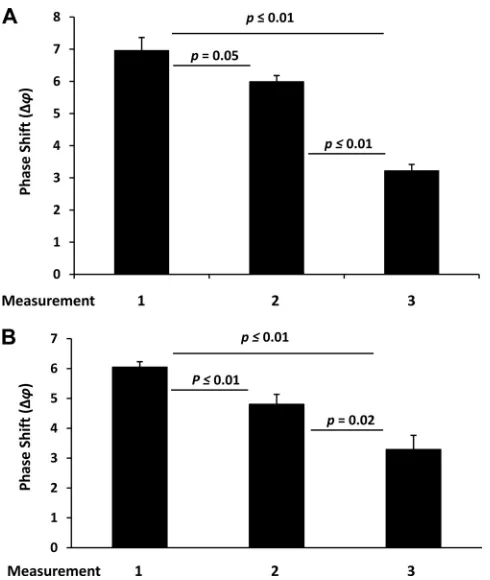
Reusability of sensor chips for HIV-1 and HIV-2 detection. An envisaged use of the biosensor tested in this study is its point-of-care application under suboptimal conditions in disaster/ emergency situations, such as in a field laboratory. For this, one important aspect with respect to its performance is the reusability of the sensor chips. We tested reusability in a series of experiments using 3 identical chips with antibody-functionalized lanes. After the first measurement, the antibodies were eluted in high-salt buf-fer, and the lanes were recoated with new antibody solutions, fol-lowed by a second measurement of newly added virus. This pro-cedure was repeated a second time for a total of 3 measurements on each of the 3 chips for HIV-1 (Fig. 3A) and HIV-2 (Fig. 3B). HIV-1 was applied at 672 TCID50s. The sensitivities of the first, second, and third measurements were compared to each other by combining the data and determining the means and standard er-rors. The first, second, and third use resulted in⌬ values of 6.96⫾0.45, 5.99⫾0.19, and 3.22⫾0.19, respectively. By this analysis, the sensitivity of the sensor was gradually and, for the most part, significantly (P⬍0.05) reduced by approximately 14%
and 54% after the first and second use, respectively, with a remain-ing sensitivity of approximately 46% compared to that in the first use (Fig. 3A). The findings for the reusability at lower viral loads were similar (data not shown). Similarly, HIV-2 was applied at 520 TCID50s. The sensitivities of the first, second, and third mea-surements were compared to each other by combining the data and determining the means and standard errors. The first, second, and third use resulted in⌬values of 6.05⫾0.18, 4.18⫾0.33, and 3.29⫾0.47, respectively. By this analysis, the sensitivity of the sensor was gradually and significantly (P⬍0.05) reduced by ap-proximately 21% and 46% after the first and second use, respec-tively, with a remaining sensitivity of approximately 54% com-pared to that in the first use (Fig. 3B). Findings for the reusability at lower viral loads were similar (data not shown).
Collectively, these results show an expected loss of sensitivity of the sensor for viral detection after repeated antibody elution and reuse. However, the reported sensitivity losses provide guidance for technical improvement of the reusability of the biosensor un-der adverse conditions.
Validation of HIV-1 accuracy by biosensor in comparison to nucleic acid amplification (PCR).Random dilutions of an HIV-1 sample in PBS buffer were analyzed on the biosensor. At 5 min after virus addition, the phase shifts (⌬) were recorded and ranged from 1.87⫾0.29 to 4.17⫾0.18. Aliquots of the samples were analyzed by reverse transcriptase quantitative PCR and yielded a range of viral RNA copy numbers of 572 to 34,400, which translates to a TCID50range of 1 to 560. The values for RNA copies and TCID50s were plotted against each other, which resulted in a linear relationship between the two units for this range of viral particles, with a correlation coefficient (R2) of 0.99 (data not shown).
DISCUSSION
According to the World Health Organization, HIV infection is a global pandemic contributing to approximately 2 million deaths and 2.7 million new infections each year. In addition, the current global estimate of people infected with HIV is approximately 33 million (15). HIV is a lentivirus that causes AIDS, a condition in which progressive failure of the immune system can become life-threatening (16). Infection with HIV occurs by the transfer of blood, semen, vaginal fluid, pre-ejaculate, or breast milk. In blood, HIV is present as a virus within infected immune cells and as free virus particles. The latter form is of importance in emer-gency situations, either man-made or naturally caused, when do-nors are requested to help victims in need of blood and especially when prescreened resources are exhausted (1). Additional impor-tant requirements under such conditions are accuracy and speed of detection to avoid any delay in immediate attempts to save human lives. The matter is further complicated by the fact that HIV exists as two serotypes, HIV-1 and HIV-2. While HIV-2 is primarily endemic in West Africa, global travel has greatly en-hanced the geographical distribution of this serotype, including the spread to Europe and the United States (17,18). The distinc-tion between HIV-1 and HIV-2 is important for several reasons. First, the clinical course of the infection and the development of AIDS differ, with HIV-2 being initially slower but in later stages causing a number of severe ailments in a very short span of time. Second, most commonly used antiretroviral drugs, including in-hibitors of the viral reverse transcriptases and proteases, were de-veloped for HIV-1 and have been shown to be less effective against FIG 3Reusability of biosensor chips for HIV-1 (A) and HIV-2 (B) detection
at 520 and 672 TCID50s, respectively. Measurements (2 per lane on three lanes,
5 min after the addition of virus) were taken on 3 chips after the first coating (measurement 1), after the first antibody elution (measurement 2), and after the second antibody elution (measurement 3). The⌬values (yaxis) for measurements 1 to 3 are shown. Bars represent the means (n⫽6) with stan-dard errors. The differences were calculated for significance (Pvalues) using
thettest.
on May 16, 2020 by guest
http://jcm.asm.org/
[image:5.585.42.287.64.354.2]HIV-2 (19,20). Third, if an HIV vaccine becomes a reality, it will be important to know the exact type of infection to predict effi-cacy, as it might not be protective against both types of HIV (21). Here, we report on a piezoelectric material-based prototype biosensor capable of rapidly detecting HIV-1 and HIV-2. The limit of detection (LOD) (experimental sensitivity) was 12 TCID50s for HIV-1 (approximately 3,000 viral particles) in de-fined buffers. The LOD for HIV-2 was 87 TCID50s in defined buffers. The values for both HIV-1 and HIV-2 were slightly higher in human serum. As expected, these LODs are higher than those obtained by another direct detection assay, i.e., the nucleic acid amplification-based PCR, which typically features detection limits as low as 50 to 100 copies of viral RNA/ml (22,23). This translates to an LOD as low as 10 to 20 viral particles/ml. However, it is important to emphasize that PCR involves massive amplification of the original input material, which can compromise specificity in complex backgrounds. In contrast, the biosensor featured in this study has the potential for enhanced specificity, as shown by the differential detection of the HIV-1 and HIV-2 serotypes. Fur-thermore, the detection limits reported herein are currently purely experimental and might be influenced by technical limita-tions, such as the site density of antibodies tethered to the detec-tion lanes. If after further development the LOD can be improved, this platform would have the potential to reach sensitivities and specificities competitive with those of other technologies. Fur-thermore, in comparative experiments with PCRs (data not shown), we found that the linearity of detection within similar ranges of viral loads is comparable to that of PCRs, often reaching correlation coefficients (R2) of⬎0.95. In addition, the overall co-efficients of variation of approximately 15% for both HIV-1 and HIV-2 detections compete favorably with those for other more established technologies; this is a value that can be lowered further with technological improvement. One area of improvement in particular should be addressing the different sensitivities dis-played between chips fabricated on different wafers, which ex-plains the different phase shifts that can be observed at the same viral inputs.
Our work reflects a continuation of previous pioneering re-ports, in which the principle of using SAW generated in piezoelec-tric materials for the detection with and of large biomolecules (proteins, antibodies, etc.) that are intended for medical applica-tions was introduced. For example, Wessa and colleagues used a polyclonal antibody to detect the enzyme glucose oxidase with detection limits of 2.7 nmol/liter (24). Welsh and coworkers used SAW at 345 MHz to detect immunoglobulins in PBS in a flow-through manner and achieved detection limits of 35 pg (25). Rupp and colleagues used antibodies in extensive cross-recognition ex-periments to validate sensitivity and specificity and also reported on the effect of serum on these parameters (26). Similarly, Sheikh and coworkers studied the interactions between biotin and avidin in a real-time and label-free manner on self-assembling monolay-ers (27). Pertinent to the application reported herein, Sheikh and colleagues have previously reported on the detection of HIV-2 antibodies in serum using a label-free approach on an ultra-high-frequency acoustic wave sensor at 1.06 GHz (28). Although the setting of this study was different in that the self-assembly mono-layer (non-LiTaO3) sensor surfaces were coated with virus-spe-cific undecapeptide sequences to capture antibodies in serum, the study clearly shows the potential of this technology to attain sen-sitive and highly specific detection of HIV in complex solutions
and at concentrations nearing those of clinical applications (28). Our present study adds to these successful efforts.
We point out the following additional advantages of acous-tic wave technologies for the detection of HIV. (i) The first advantage is direct detection. In contrast, standard HIV detection, as performed in most reference laboratories associated with health care systems, is of the indirect type, usually by the enzyme-linked immunosorbent assay (ELISA) technology (29). While high sen-sitivities and specificities of⬎99% are reported for these assays, the ELISA operates via a sandwich-type procedure in which spe-cific antibodies against HIV in the blood are detected by capturing them with plate-immobilized antigens. Since immune responses to HIV infections take time to develop (16), this means that recent HIV infections might be missed, which is incompatible with emergency situations. (ii) The second advantage of acoustic wave technology is time of detection. Most other technologies, while reasonably fast, require 30 to 60 min to detect a potential infec-tion. In contrast, the biosensor used in this study indicates the presence of the virus by or in less than 5 min, including the differ-entiation between HIV-1 and HIV-2. In emergency situations, the ability to have clinically correct diagnoses in such short times might be a great benefit. (iii) The third advantage is the ease of operation. Nucleic acid amplification, the ELISA, and the more experimental technology of plasmon surface resonance (PSR) tend to require either additional prepreparatory steps (e.g., the isolation of nucleic acids for PCR) and/or rather sophisticated and thus expensive technology platforms (e.g., thermocyclers and plate readers). In contrast, the biosensor featured in this study has the capacity to operate in an almost complete absence of prepreparatory steps, which allows the direct analysis of sim-ple and comsim-plex solutions, including blood and plasma. Fur-thermore, the biosensor is small and light and thus is highly portable. It operates in conjunction with a portable laptop computer and is powered by batteries. We are currently im-proving this level of portability even further by developing cost-effective cartridge-like chips featuring improved levels of reusability that can be used in size-optimized handheld devices resistant to adverse conditions and independent of gravita-tional influences (i.e., capillary format). We are also currently adopting software that is compatible with small personal digi-tal assistants and are initiating the development of wireless communication capabilities for fast data transmission over both short and long distances. Finally, our data indicate the potential for conditional reusability of the sensor, which is in agreement with its intended use as a point-of-care diagnostic device in emergency-type situations.
In summary, we present in this study a piezoelectric prototype biosensor that, when functionalized with specific antibodies, is highly adaptable to the detection of multiple bioagents in complex fluids. We have previously used this type of sensor to detect po-tentially harmfulBacillus anthracisbacteria and Sin Nombre han-taviruses (11,12), and we show here accurate, rapid, and specific detection of the blood-borne pathogenic viruses and human im-munodeficiency-causative agents HIV-1 and HIV-2. We are cur-rently testing the clinical sensitivity and specificity of this proto-type biosensor using larger cohorts of HIV-infected patient sera in blinded case-control studies. In addition, we are developing a manufacturable design, which should yield further improvements in limits of detection, precision, and accuracy.
We conclude that this prototype biosensor, after further
on May 16, 2020 by guest
http://jcm.asm.org/
dation and testing, has the potential to be developed into a device superior to other technologies, specifically for the point-of-care use in emergency-driven field applications that require rapid and reliable testing for potential HIV infections in blood donors.
ACKNOWLEDGMENTS
This work was supported by the University of California at Davis Point of Care Technologies Center grant UCD-POCTC-08 and National Science Foundation grant NSF IIS-0434120 (to R.S.L.).
We acknowledge Pattie Curran and Becky Welch, grant coordinators at the University of New Mexico School of Medicine, Department of Pa-thology, for excellent administrative support. We thank Stephen Young, scientific director of infectious diseases, for the analysis of HIV at TriCore Reference Laboratories (Albuquerque, NM) using the Cobas AmpliPrep TaqMan test. We also thank Stephen Casalnuovo, manager of the biosen-sor program at Sandia National Laboratories, for providing organiza-tional support for the present work.
REFERENCES
1.Kost GJ, Tran NK, Tuntideelert M, Kulrattanamaneeporn S, Peung-posop N.2006. Katrina, the tsunami, and point-of-care testing: opti-mizing rapid response diagnosis in disasters. Am. J. Clin. Pathol.126: 513–520.
2.Subbarao I, Steinbrecher R, Tan L, Peleg K, Zeiger J, James JJ.2007. Postexposure immunization and prophylaxis of bloodborne pathogens following a traumatic explosive event: preliminary recommendations. Di-saster Med. Public Health Prep.1:106 –109.
3.Black V, von Mollendorf CE, Moyes JA, Scott LE, Puren A, Stevens WS.
2009. Poor sensitivity of field rapid HIV testing: implications for mother-to-child transmission programme. BJOG116:1805–1808.
4.Gronewold TM.2007. Surface acoustic wave sensors in the bioanalytical field: recent trends and challenges. Anal. Chim. Acta603:119 –128. 5.Niemz A, Ferguson TM, Boyle DS. 2011. Point-of-care nucleic acid
testing for infectious diseases. Trends Biotechnol.29:240 –250. 6.Rocha-Gaso MI, March-Iborra C, Montoya-Baides A, Arnau-Vives A.
2009. Surface generated acoustic wave biosensors for the detection of pathogens: a review. Sensors9:5740 –5769.
7.Länge K, Rapp BE, Rapp M.2008. Surface acoustic wave biosensors: a review. Anal. Biol. Chem.391:1509 –1519.
8.Mascini M, Tombelli S. 2008. Biosensors for biomarkers in medical diagnostics. Biomarkers13:637– 657.
9.Sheikh S, Blaszykowski C, Thompson M. 2008. Acoustic wave-based detection in bioanalytical chemistry: competition for surface plasmon res-onance? Anal. Lett.41:2525–2538.
10. Voiculescu I, Nordin AN.2012. Acoustic wave based MEMS devices for biosensing applications. Biosens. Bioelectron.33:1–9.
11. Branch DW, Brozik SM.2004. Low-level detection of a Bacillus anthracis simulant using Love-wave biosensors on 36 degrees YX LiTaO3. Biosens.
Bioelectron.19:849 – 859.
12. Bisoffi M, Hjelle B, Brown DC, Branch DW, Edwards TL, Brozik SM, Bondu-Hawkins VS, Larson RS.2008. Detection of viral bioagents using a shear horizontal surface acoustic wave biosensor. Biosens. Bioelectron.
23:1397–1403.
13. Tamalet C.2005. Isolation and quantification of HIV from lymph nodes. Methods Mol. Biol.304:87–94.
14. Sizmann D, Glaubitz J, Simon CO, Goedel S, Buergisser P, Drogan D, Hesse M, Kröh M, Simmler P, Dewald M, Gilsdorf M, Fuerst M, Ineichen R, Kirn A, Pasche P, Wang Z, Weisshaar S, Young K, Hab-erhausen G, Babiel R.2010. Improved HIV-1 RNA quantitation by COBAS AmpliPrep/COBAS TaqMan HIV-1 Test, v2.0 using a novel dual-target approach. J. Clin. Virol.49:41– 46.
15. UNAIDS/WHO.2008. Report on the global AIDS epidemic. UNAIDS/ WHO, Geneva, Switzerland.
16. Douek DC, Roederer M, Koup RA.2009. Emerging concepts in the immunopathogenesis of AIDS. Annu. Rev. Med. 60:471– 484. 18947296.
17. Centers for Disease Control and Prevention.2011. HIV-2 Infection Surveillance—United States, 1987-2009. MMWR Morb. Mortal. Wkly. Rep.60:985–988.
18. Torian LV, Eavey JJ, Punsalang AP, Pirillo RE, Forgione LA, Kent SA, Oleszko WR.2010. HIV type 2 in New York City, 2000-2008. Clin. Infect. Dis.51:1334 –1342.
19. Camacho RJ.2012. Special aspects of the treatment of HIV-2-infected patients. Intervirology55:179 –183.
20. Peterson K, Rowland-Jones S.2012. Novel agents for the treatment of HIV-2 infection. Antivir. Ther.17:435– 438.
21. Hodges-Mameletzis I, De Bree GJ, Rowland-Jones SL.2011. An under-estimated lentivirus model: what can HIV-2 research contribute to the development of an effective HIV-1 vaccine? Expert Rev. Anti Infect. Ther.
9:195–206.
22. Ferns RB, Garson JA.2006. Development and evaluation of a real-time RT-PCR assay for quantification of cell-free human immunodeficiency virus type 2 using a Brome Mosaic Virus internal control. J. Virol. Meth-ods135:102–108.
23. Mens H, Kearney M, Wiegand A, Shao W, Schonning K, Gerstoft J, Obel N, Maldarelli F, Mellors JW, Benfield T, Coffin JM.2010. HIV-1 continues to replicate and evolve in patients with natural control of HIV infection. J. Virol.84:12971–12981.
24. Wessa T, Rapp M, Sigrist H.1999. Immunosensing of photoimmobilized proteins on surface acoustic wave sensors. Colloids Surf. B Biointerfaces
15:139 –146.
25. Welsh W, Klein C, O¨ ksüzoglu RM, von Schickfus M, Hunklinger S.
1997. Immunosensing with surface acoustic wave sensors. Sensors Actu-ators A Phys.62:562–564.
26. Rupp S, von Schickfus M, Hunklinger S, Eipel H, Priebe A, Enders D, Pucci A.2008. A shear horizontal surface acoustic wave sensor for the detection of antigen-antibody reactions for medical diagnosis. Sensors Actuators134:225–229.
27. Sheikh S, Chih-Chieh Sheng J, Blaszykowski C, Thompson M.2010. New oligoethylene glycol linkers for the surface modification of an ultra-high frequency acoustic wave biosensor. Chem. Sci.1:271–275. 28. Sheikh S, Blaszykowski C, Thompson M.2011. Label-free detection of
HIV-2 antibodies in serum with an ultra-high frequency acoustic wave sensor. Talanta85:816 – 819.
29. Pumarola T, Freeman J, Saxton E, Dillon P, Bal T, van Helden J.2010. Performance evaluation of the ADVIA Centaur®HIV Ag/Ab Combo
as-say. J. Virol. Methods170:16 –20.