Benjamin P. Lutkoski. A Content Analysis of North Carolina State Agency Twitter Feeds. A Master’s Paper for the M.S. in I.S degree. April, 2011. 50 pages. Advisor: Paul Jones
Twitter is the world’s most popular micro-‐blogging service. Since 2005 the number of individual and organizational users has expanded dramatically. This study examines Twitter use by ten North Carolina State Government Agencies. Using the principles of grounded theory, a content analysis of these ten feeds was conducted in an attempt to define Twitter use and user intention. Tweets are categorized by Information Type and Subject. Most tweets were found to announce an activity or event. The study also identified a distinct division between Agencies who used Twitter as a tool for conversation and those who did not. Tweets were found to primarily broadcast information in contrast to the typical individual user described by several scholars.
Headings:
North Carolina – Politics and Government
by
Benjamin P. Lutkoski
A Master’s paper submitted to the faculty of the School of Information and Library Science of the University of North Carolina at Chapel Hill
in partial fulfillment of the requirements for the degree of Master of Science in
Information Science.
Chapel Hill, North Carolina
April 2011
Approved by
Introduction
In the five years since Twitter was introduced to the public in 2006, it has
become the world’s most popular micro-‐blogging service. Twitter allows users to
post 140 character messages using their mobile phone, smart phone, or computer.
Through their messages, or “tweets,” users can create a social network by choosing
to follow others and by attracting others to follow them. Users have developed a
coding system that has become widely adopted by other internet and social media
sites: “@username” allows users to direct messages to specific individuals or
groups, “RT” (re-‐tweet) passes along information posted by others, and “#” indicates
subjects or topical categories. The Pew Internet and American Life Project (2009)
estimates that 19% of Internet users tweet or use similar status updating services,
an increase of 8% over their last survey in 2008.
Reaction to Twitter in the media has ranged from ebullient and effusive to
crass and dismissive. In a survey of Twitter press coverage, Arceneaux and Weiss
(2010) found that the media response generally conforms to historical trends of
press reactions to new technology. The two authors sampled traditional and new
media coverage of Twitter from 2006 through 2009 and found that most reporting
was primarily explanatory, emphasizing the perceived benefits of Twitter in
commercial, civic, and personal settings. A minority of coverage was negative and
spaces. When examining reports of Twitter by civic organizations, the authors
found that many articles emphasized the ability of the government to provide
information to citizens as part of public education campaigns or in emergency
situations.
This study was prompted by an interest in social media use by state and local
governments. Public officials offer several explanations for their use of social media
tools, including Twitter, as a means of communicating with the public. Bev
Goodwin, director of the General Service Administration’s USA.gov, argues that in
order to reach the public, government agencies need to make use of the same
resources as their constituents: “The whole goal is to get information out where
people are going…They’re going to YouTube, not government video sites” (Newell,
2009, p. 18). Others explain their adoption of social media as a way of
communicating reliable and accurate public information in a time when media
coverage of state and local issues is in decline (Rose, 2009).
In this paper I will examine the use of Twitter by ten North Carolina State
Government Agencies and Departments. This study is concerned with what
Agencies say when they tweet and the types of messages that are being broadcast.
This content analysis of State Agency Twitter feeds is an attempt to explain how
Twitter is being used by North Carolina State Agencies. The paper will begin with a
review of scholarly work evaluating behavior on Twitter. It will next discuss
different forms of government communication. There will then be an explanation of
and draw conclusions from the data. Finally, there will be a critique of the study and
suggestions for further research.
Related Works
Although Twitter is a relatively new service, there have already been several
academic studies that explore its use. Most of these works focus on individual
Twitter users and attempt to explain how and why it is being used. The corpora and
research are different in each study, but in general scholars are interested in the
degree to which Twitter is used as a method of information exchange.
In an early study of Twitter users, Java, Song, Finin and Tseng (2007)
investigate the intentions and roles of individual Twitter users and Twitter
communities. The group identified three categories of Twitter user. The majority of
Twitter users fall into the Friends category, groups of users with high levels of
message reciprocity and a high degree of tweet correlation. An individual may fall
into one or more Friend communities. Those with a large number of followers are
labeled an Information Source. They serve as the hub of a network and, though the
frequency of their posts may vary, they are sure to be read by many people.
Information seekers, the final group of Twitter users, tweet infrequently but follow a
number of Friends and Information Sources. The authors also identified four types
of user intentions. According to Java, Song, Finin and Tseng a majority of tweets can
be considered Daily Chatter about routine and conventional matters. They found
symbol. 13% of tweets examined contained a URL and were labeled Sharing
Information/URL. The remaining tweets consisted of automated RSS feeds and
were categorized as News.
Honey and Herring (2009) conducted a content analysis of personal tweets
with the intention of identifying if, and how, Twitter advances conversation between
members of a community. The two researchers developed 12 content themes to
classify the types of information conveyed in a tweet. The themes range from
personal messages, to opinions, to meta-‐commentaries on the use of Twitter itself.
Of the tweets they examined the majority (41%) can be categorized as Self
Experience—reports or comments on what is happening to an individual. Other
highly ranked content themes include tweets about an addressee (11%), tweets
about media use (9%), announcements to the Twitter community (7%), and the
expression of an opinion (6%). In a surprising and interesting note they found that
around 30% of all tweets use @ as part of a personal message or conversation—
more than twice the use of @ found by Java, Song, Finin, and Tseng. The authors
conclude that such an increase in just two years suggests that Twitter is quickly
become a more interactive media
The idea of Twitter communities is also explored by Zhao and Rosson (2009)
who conducted in-‐depth interviews with 11 workers in an IT company. They found
that the positive aspects of Twitter use while at work generally mirrors other types
of informal communication, such as improving perception of others and establishing
common ground with colleagues. Although their focus was on Twitter as a means of
personal from professional content. Zhao and Rosson did not conduct an analysis of
tweets, but based on their interviews they found that Twitter use broadly reflects
the categories identified by Java, Song, Finin, and Tseng. They note that users
appreciated the ability to frequently post brief personal updates and real-‐time
information. Interviewees noted an affordance of Twitter, what one user called a
“people-‐based RSS feed,” where personally relevant information can be easily
aggregated. In an interesting note on information quality, the authors found that
“From a reader’s perspective, information posted by a person the reader has
deliberately selected to follow is perceived as useful and trustworthy” (p. 247).
In 2009 Pear Analytics, a social media and search engine consulting group,
conducted a content analysis of 2,000 randomly selected tweets collected over a
two-‐week period. They found that the vast majority of tweets studied were either
Conversational (37.55%) or, with 40.55% of the total, what they call Pointless
Babble. They considered tweets like “I’m eating a sandwich” Pointless Babble
because they offer little of informational value. Use of the remaining categories,
Pass Along, News, Spam, and Self-‐Promotion, did not rise above single digit
percentages. The authors expected organizations to use Twitter to post news or
self-promotions but found low frequencies in these categories, which might indicate
that there are more individual Twitter users than organizational users.
Jansen, Zhang, Sobol and Chowdhurry (2009) make one of the few attempts
to research Twitter use by a company or organization. They studied the
relationship between corporations and consumers, particularly patterns of
effectiveness of branding via electronic word of mouth. Using sentiment analysis
they examined tweets expressing opinions on 50 brands and placed them on a five-‐
point scale ranging from Great to Wretched. Of the tweets expressing sentiment
they found that almost half of brand-‐related tweets were generally positive or very
positive while only 18% expressed a wretched opinion. The authors also examined
the subjects that the organizations tweeted about and with what frequency
corporations were communicating with customers via Twitter by examining several
thousand tweets from three of the official Starbucks Twitter feeds. Not surprisingly,
they found that Starbucks tweeted most frequently about coffee, beverages, and
events. Announcements and references to Twitter were also tweeted frequently.
Over a three-‐month period they found that Starbucks tweeted directly with only
2.7% of its followers and responded to 20.4% of all tweets. In general, a large
minority of customers accounted for almost half of tweets referencing or directed to
Starbucks.
In a 2010 study Golbeck, Grimes and Rogers examined the use of Twitter by
U.S. Congressional Representatives. Following methods developed by Honey and
Herring, the group categorized the tweets of all 69 Representatives using the
service. They based their categorization on the tweets’ type and information intent.
The authors found that 55% of the tweets can be considered informational, followed
by tweets broadcasting a location or unofficial activity (27%) and communication
with people outside of Congress (7%). Of the informational tweets the authors
write that they resembled press releases and found that 72% contained a link or
examples of conversations between Representatives and a mere 1% of the posts
used re-‐tweets or hash tags. The authors conducted two follow-‐up studies several
months later that confirmed their results.
Interesting differences emerge between a Congressional Twitter user, an
organizational Twitter user, and an individual Twitter user. Tweets by
organizations and Representatives tend to be more informational and less
conversational than those by individuals. Representatives did use Twitter to
communicate with others to a greater degree than did organizations when
compared with the findings of Jansen, Zhang, Sobol, and Chowdhurry. But,
conversational or communicative tweets by both Representatives and organizations
fall far below the individual communication rate found by Honey and Herring and
Pear Analytics. Unlike personal and organizational Twitter users, Congressional
tweets are also more likely to contain a URL, which seems to indicate that they aim
to share more information than a typical tweet.
Government Communication
Discussions of government information tend to focus on the relatively
exciting political arena, particularly campaigns, rather than the more mundane
world of bureaucratic communication. However, e-‐Government (digital government
systems) is widely studied, and treatment of this subject is relevant to the present
study.
A central theme in the discussion of e-‐Government is the idea of system
evolution or maturation. Chadwick and May (2003) highlight this topic in an
participatory. The authors write that the initial, and most basic, e-‐Government state
is managerial with the central purpose of providing efficient information to users.
Of the managerial model they write, “This is the ‘push’ model of information
dissemination: the state will place information in accessible forums and the onus is
on the user to access it” (p. 278). The consultive model, where the government
seeks out public opinion, describes more mature e-‐Government systems. To
Chadwick and May e-‐Government reaches its greatest potential in the participatory
model where knowledge and information flows freely between the government and
the public. They envisage a cyber-‐society where citizens can engage in policy
making as much as in civil society today. The researchers argue that the public is
more likely to engage in civic and government activity when governments use the
participatory model because the bar for involvement is so much lower.
Elmagarmid and McIver (2001) focus less on public participation in their
four-‐tiered description of e-‐Government development. Like Chadwick and May they
argue that presenting information to the public is the most basic form of e-‐
Government, followed by systems which allow two-‐way communication between
the government and the public. The next level is characterized by the online
processing of complex government services. The final level of e-‐Government
provides a number of services from different levels of government integrated into
easily accessible portals.
Bimber (2003) argues that information and techniques of information
dissemination are central to ideas of American democracy. He argues that changes
about our core national tenants. Bimber feels, for example, that the growth in mass
communication and information technology has led to the idea of a national, versus
a state-‐based, identity and the sense of affiliation to a political party. Indeed, he
traces the idea that a good citizen is an informed citizen to the Progressive era when
daily newspapers became widely available. As with other information-‐driven
revisions to American democracy, Bimber feels that rapid technological
development will lead to changes in civic life. He writes, “Technology is increasing
the complexity and specialization of information while at the same time decreasing
its cost, thereby making abundant political information and communication
available to anyone with the motivation to acquire it, provided they have access to
information technology,” (p. 21). This abundance of information, Bimber feels, will
decrease the importance of the political party and increase the importance of, and
opportunity for, grassroots political action.
Methods
This study is based in the principles of grounded theory, an approach that
was used successfully in similar works by Golbeck, Grimes and Rogers in their
analysis of Twitter use in Congress and by Honey and Herring in their examination
of Twitter conversations. According to Glasser and Strauss (1967) grounded theory
allows researchers to generate and adapt theories throughout the course of a study
based on their findings, rather than approaching a study with a hypothesis to prove
or disprove. They write, “Generating a theory from data means that most
worked out in relation to the data during the course of the research process” (p. 6).
Researchers using grounded theory avoid situations where conclusions are hastily
tacked on to otherwise well crafted studies. Instead, this method attempts to move
theory and data closer together. Key to grounded theory is the idea that the
researcher is open to pursue new concepts or modify methods when presented with
new evidence. The system outlined by Glasser and Strauss fits the needs of this
study because of the precedence set by other Twitter researchers and because it
allows a researcher to study data without having to prove or disprove an explicitly
stated hypothesis. The study of Twitter is so new that it seems wise to let
observation generate theory that can be validated over time as additional data
becomes available.
The North Carolina Office of the Governor currently lists 13 Twitter accounts
on the State social media webpage. Three of these feeds are inactive. The remaining
ten are listed in Table 1. Tweets were harvested and downloaded to a CSV file on
February 18, 2011 using DiscoverText, a social media and text-‐harvesting tool.1 It
was not possible to harvest an equal number of tweets from each agency due to
issues of tweet frequency and DiscoverText’s limited ability to interact with
Twitter’s API. DiscoverText also harvests a number of metadata values, such as the
time the tweet was sent and the tweeting platform (Blackberry, iPhone, TweetDeck,
etc.).
Table 1.
Number of Tweets by Agency
Agency Harvested Tweets Tweets Coded
Department of Commerce 196 172
Department of Corrections 134 108
Department of Environment &
Natural Resources 175 145
Museum of Natural Science 143 121
Office of the Governor 156 134
Pollution Prevention &
Environmental Assistance (PP&EA) 192 153 State Chief Information Officer 26 22
State Highway Patrol 115 94
Tourism Office 196 165
Wine & Grape Council 200 167
Total 1,533 1,281
Based on the observation that a number of tweets contained a URL linking
out to other websites, the primary investigator determined that these external sites
could lend context to the 140 character tweets. Coders visited each link and
attached a headline or short description from the Web page to the source tweet.
Following the works of Pandit (2006), Golbeck, Grimes and Rogers, and
Honey and Herring, coders developed tweet categories using an open coding
approach. Over the course of collecting headlines from URLs, coders asked what
Pandit calls “the simple questions”: what, where, how, when, how much, etc. Based
on these observations, a set of categories was developed which classifies the Subject
of the tweet and the manner in which the information was presented—the
Information Type. The primary investigator created a training sample of 150
coding the training sample, the coders discussed revisions of the Subject and
Information Type categories. A comparison of the training sample results led the
primary investigator to further revise the categories. Following category creation
rules set out by Riffe, Lacy and Fico (2005), categories were defined in an attempt to
be exhaustive and mutually exclusive. The final list included a total of 25 Subject
and seven Information Type categories. Appendix A has full category descriptions.
In order to boost the validity of the data, three coders each reviewed two-‐
thirds of the corpus so that every tweet was coded twice. Coding took place
simultaneously over several sessions with coders discussing categories and coding
rules to ensure that they were applied uniformly. When inter-‐coder reliability was
calculated at the conclusion of coding, two issues emerged. First, coders had
consistently applied certain Subject and Information Type categories differently.
For example, one coder used the ANNOUNCEMENT Information Type category for
tweets more suited to the PUBLIC SERVICE ANNOUNCEMENT category. There was also
variation in the way the ACTIVITY, EVENT and FAIRS AND FESTIVALS Subject categories
were used. The primary investigator resolved these inconsistencies in consultation
with the coders. The large number of Subject categories also lowered inter-‐coder
reliability. Rules allowed coders to use more than one Subject category for a single
tweet when appropriate. 10.6% of tweets were coded with more than one Subject
category, but these multi-‐subject tweets usually represented a partial match, which
lowered inter-‐coder reliability. In instances with a partial Subject match, the
primary investigator decided to preserve the matching category, resulting in a rise
Crude weighted inter-‐coder reliability was calculated by Information Type at
.9380 and by Subject at .8482. Crude reliability between all coders is .8931. Scott’s
π, a measure that corrects for chance agreement, was calculated between coders at
.8804. Despite an overall crude reliability of .8931, analysis of the tweets requires
perfect reliability—that is, a match for both Subject and Information Type
categories. .8356 of tweets were perfectly reliable, which means that the results are
based on the analysis of 1,281 tweets. While there is no existing standard for inter-‐
coder reliability, a reliability of .80 or greater should be acceptable to most,
according to Neuendorf (2002). See Appendix B for a breakdown of inter-‐coder
reliability. When chi-‐square was calculated, it showed a probability of less than
.0001, demonstrating a high degree of significance. However, over 20% of
categories had a frequency less than five, which indicates that the chi-‐square
calculation might be suspect.
Results
This section will break down the results of coding by Information Type and
by Subject. Charts and tables describing the results in full can be found in Appendix
C and Appendix D. The ten agencies differ in mission and responsibility, leading to
variation in the application of Information Type and Subject categories;
nevertheless, several trends are apparent in the data.
ANNOUNCEMENTS, with 54.6% of the total body (as observed in Figure 1),
represents the most frequently tweeted Information Type. The ANNOUNCEMENTS
category was designed to capture a simple statement about a fact or an occurrence.
• More jobs! Gov Perdue announces 100 jobs with Novartis! #jobsnow
http://ht.ly/3tfEr (Commerce, 107)
• New warden for state's largest women's prison http://bit.ly/9lqA1v
(Corrections, 50)
• Lecture at noon TODAY: Bonobos of the Congo http://bit.ly/dodurv Sorry
for the late notice! (Natural Sciences, 112)
With the exception of the 24.1% in the Governor’s Office, ANNOUNCEMENTS account
for over 50% of every Agency’s Twitter feed.
18.3% of tweets fall into the SOLICITATION AND EXHORTATION Information Type
category. SOLICITATIONS AND EXHORTATION tweets ask readers to take part in an
activity: “Tomorrow at 11 am, join us for a special family presentation on "Plant
Diseases and How They Change Our World": http://bit.ly/c8” (Natural Sciences, 28).
These tweets also ask for reader input: “Have you taken the "Budget Challenge" yet?
Help us get to 10k submitted proposals. http://bit.ly/dWOo5L” (Governor’s Office,
10). The Department of Commerce, Museum of Natural Science and Wine and Grape
Council use SOLICITATIONS AND EXHORTATIONS most often. In these three Agencies,
SOLICITATIONS AND EXHORTATIONS represent the second most frequently used
Information Type category, and their combined use of the Information Type
represents 57% of all SOLICITATION AND EXHORTATIONS.
11.7% of tweets are part of a TWITTER CONVERSATION. These tweets are most
often addressed to a particular user: “@3RIc9377mAN Thanks for the question. We
are still in a state of emergency. It is set to expire Friday at noon.” (Governor’s Office,
Figure 1. Tweet Frequency of Information Type Categories
54.6%
5.5% 5.8% 3.6% 18.3%
11.7% 0.4%
INFORMATION TYPE
Announcement Press Release Public Service Announcement
Self Promotion Solicitation or Exhortation Twitter Conversation
user community: “Right back atcha! RT @WasteManagement: @Earth911
@HelpRecycle_com @re3org @RecycleMatch @NCERrecycle @RRTwinCities
#EcoMonday” (PP&EA, 114). Certain Agencies are much more active in their use of
TWITTER CONVERSATIONS than others. For example, TWITTER CONVERSATIONS make up
29.7% of Tourism’s tweets but only 1.2% for the Wine Council. Re-‐tweets were only
coded as TWITTER CONVERSATION if there was an indication that there was a back and
forth between users, as in the PP&EA example above. It was far more common for
re-‐tweets to pass along ANNOUNCEMENTS or other information. Re-‐tweets will be
discussed in the next section.
PUBLIC SERVICE ANNOUNCEMENTS represent 5.8% of the tweets coded. PUBLIC
SERVICE ANNOUNCEMENTS are tweets that raise awareness of an issue or inform the
public of matters of immediate concern. For example: “Escape alert: Search
underway for inmate missing from Alexander County prison construction crew.
http://bit.ly/cLiDB0” (Corrections, 45) and “State air quality officials issue Code
Orange alert for Friday in Charlotte, Triad and Triangle metro areas
http://bit.ly/doCSiE” (Department of Natural Resources, 174). Most Agencies, like
the Tourism Office and Wine Council, do not handle matters of public safety or well
being, so frequent use of PUBLIC SERVICE ANNOUNCEMENTS is limited to the Department
of Corrections, Department of Natural Resources and, to a lesser extent, the
Highway Patrol. The 5% of the Museum of Natural Sciences’ PUBLIC SERVICE
ANNOUNCEMENTS results mainly from museum closures due to weather events.
PRESS RELEASES make up 5.5% of the tweets coded. A PRESS RELEASE is an
information or events. The line between an ANNOUNCEMENT and a PRESS RELEASE was
thin, and coders’ decisions often depended on the context provided by a URL. The
formality of a tweet also indicated that it should be categorized as a PRESS RELEASE
rather than an ANNOUNCEMENT or SELF PROMOTION: “Gov. Perdue Announces Contract
for I-‐85 Improvement Project -‐-‐ $55 million Cheaper, Five Months Earlier Than Pro...
http://bit.ly” (Governor’s Office, 66). Like PUBLIC SERVICE ANNOUNCEMENTS, some
agencies are more suited to PRESS RELEASE use than others. This is particularly true
of the Governor’s Office, which has the most frequent use of the PRESS RELEASE with
55 out of 71 of all Press Release instances.
SELF PROMOTION accounts for 3.6% of the total tweets. SELF PROMOTION tweets
brag of accomplishments or talk-‐up achievements. The Highway Patrol has the most
occurrences of SELF PROMOTION with tweets like: “Troopers Respond to Over 1,600
Calls for Service Across the State http://fb.me/EQ3jG4nK” (Highway, 5). SELF
PROMOTION tweets often resemble ANNOUNCEMENTS in their brevity and the
straightforward manner of presenting information, but they differ in their reference
to organizational achievements and awards.
WEB NOTICES are used only in five cases, or .4% to the tweets examined.
These tweets were used when there was a broken link or a web service that was not
working: “The website is back up!” (Natural Science Museum, 138).
The diversity of the tweeting Agencies led to large number of Subject
categories. As discussed above in the Methods section, the categories were created
with the hope that they would be exhaustive but also broad enough that they could
included as it is unlikely that it would be used outside of the Wine Council Twitter
feed.
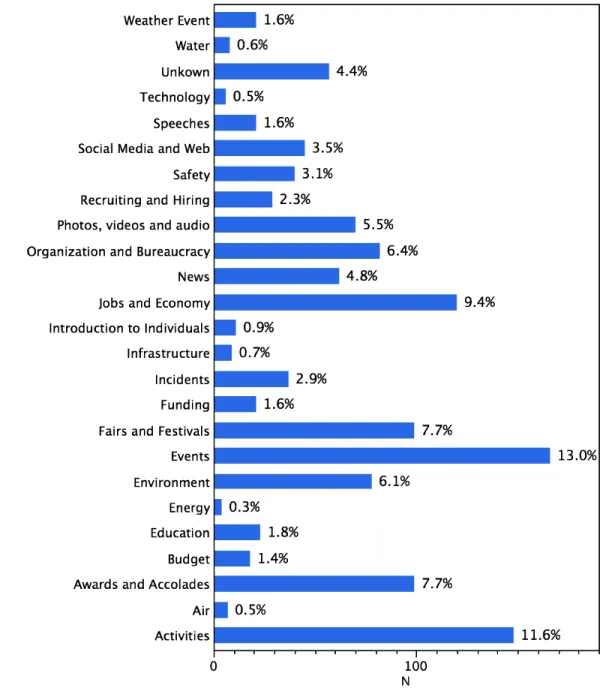
As seen in Figure 2, tweets most frequently announced an EVENT, 13%, or an
ACTIVITY, 11.6%. Taken together, the similar subject categories of EVENTS, ACTIVITIES,
and FAIRS AND FESTIVALs (7.7%) account for 32.3% of all tweets. With 9.4% of the
total, JOBS AND THE ECONOMY is the third most frequently used Subject category.
Tweets related to ORGANIZATION AND BUREAUCRATIC matters come in fourth with 6.4%.
The frequency of other Subject categories falls gradually to subjects with very
infrequent use, with TECHNOLOGY, .5%, and ENERGY, .3%, rounding out the bottom.
As is the case with Information Type categories, different Agencies utilize
different Subject categories. The Department of Corrections frequently uses Twitter
to warn the public of escaped prisoners (INCIDENTS) while the Department of
Commerce announces the creation of jobs in the state (JOBS AND THE ECONOMY).
Agencies such as the Tourism Office, Wine Council, and Museum of Natural Science
hold a number of events and use Twitter as a way of passing along an invitation.
Other Agencies, like the Department of Natural Resources and the Governor’s Office,
use Twitter to inform the public of issues concerning the public good. Despite an
effort to create categories that could be used across Twitter feeds, the AIR, BUDGET,
ENERGY, and WATER Subject categories were each used by only one Agency. These
categories are among the least frequently used.
Figure 2. Tweet frequency by Subject Category
Discussion
With ten different Agencies actively using Twitter, each with a different
mission and area of expertise, it is not surprising that Twitter use by the North
Carolina state government varies. Nevertheless, several conclusions can be drawn
based on an analysis of the collected data and a comparison of the scholarly work
discussed above. Each of the following conclusions will be discussed in turn below:
first, that tweets broadly reflect the primary focus of the tweeting Agency; second,
that levels of conversation via Twitter vary by Agency; and third, that although
Twitter is used primarily as a one-‐way tool for broadcasting information to the
public, interaction between the public and government agencies does occur.
As mentioned in the previous section, the ANNOUNCEMENT Information Type
category makes up 54.6% of the tweets coded. Of this group, 32.9% reference an
ACTIVITY, EVENT, or FAIR AND FESTIVAL Subject category. Only the Highway Patrol and
Department of Corrections did not have a combined ACTIVITY, EVENT, and FAIR AND
FESTIVAL frequency above 30%. Also, 54.9% of SOLICITATIONS AND EXHORTATIONS
Information Type tweets are in regard to either ACTIVITIES, EVENTS, or FAIRS AND
FESTIVALS. It is fair to say that Agencies in North Carolina are primarily using Twitter
to publicize ACTIVITIES, EVENTS, and FAIRS AND FESTIVALS and to invite members of the
public to join them. A breakdown of Subject and Information Type Categories by
Agency can be found in Appendix C.
The Wine Council, Tourism Office, Department of Natural Resources, and
Museum of Natural Science most frequently tweeted ACTIVITY focused messages.
Vineyards this Sat. for the Four Seasons Wine Tasting Dinner w/ 4 seasonal food
courses paired w/ wines http://bit.ly/aPUeEM” (Wine Council, 174). Readers are
informed of, or invited to join, numerous events such as charity races, museum
exhibits, and the State Fair. The fact that tweets from these Agencies most
frequently fall into these three categories is not unexpected because their missions
include engaging the public through activities and events.
Tweets from the five Agencies with a combined ACTIVITY, EVENT, and FAIR AND
FESTIVAL score below 30% also reflect their mission and area of focus. For instance,
the Highway Patrol most frequently tweets about matters of SAFETY while the
Governor’s Offices tweets are most often about JOBS AND THE ECONOMY, SPEECHES, and
the BUDGET. 52% of the tweets from the Department of Commerce are about JOBS
AND THE ECONOMY, whereas the Chief Information Officer used Twitter to share the
panels and lectures he was attending. The trends in Agencies’ Twitter categories
lead to the simple conclusion that tweets from the ten active Twitter users line up
with the primary missions of the Agencies.
In their 2010 study of Twitter use by Congressional Representatives,
Golbeck, Grimes and Rogers write that many of the tweets they examined read like
mini-‐press releases. In only two Agencies did tweets by North Carolina Agencies
resemble a press release with any frequency. The 55 tweets coded as PRESS RELEASE
in the Governor’s Office are obvious in their correspondence to the traditional press
release. The SELF PROMOTION Information Type category can also be seen as an
informal press release. 14.9% of Highway Patrol tweets were coded with the SELF
Category. For example: “Troopers to Receive Awards in Winston Salem Today:
http://bit.ly/3NVslF” (Highway Patrol, 75). Taken together the PRESS RELEASE and
SELF PROMOTION Information Type categories make up only 9.1% of all tweets, still
far below the top three Information Type categories. However, the substance of the
PRESS RELEASE and SELF PROMOTION Subject categories does differ. Most PRESS RELEASE
tweets are focused on JOBS AND THE ECONOMY or ORGANIZATIONS AND BUREAUCRACY. The
SELF PROMOTION category is, not surprisingly, self-‐referential, with AWARDS AND
ACCOLADES comprising 47.8% of Subject tweets.
There is no agreed upon scholarly grammar or vocabulary when describing
Twitter user intention or behavior, as one can see in the review of the literature
discussed in the Related Works section above. Perhaps this lack of consensus is due
to the fact that the study of Twitter, and Twitter itself, is relatively new. Every
study, including this one, has developed its own set of descriptive categories to
characterize user behavior; however, researchers have agreed that the focal points
of Twitter use are conversation and personal status updates. Java, Song, Finin and
Tseng call this core Twitter activity “Daily Chatter,” Honey and Herring call it “Self
Experience” and Golbeck, Grimes and Rogers call it “Location/Activity.” These
tweets are the “I’m eating a sandwich at the deli” messages one often associates with
Twitter. For the purposes of this study this, “Pointless Babble,” as Pearson Analytics
calls it, falls into the UNKNOWN Subject category. For example: “Oooo, I like the
cardboard picnic basket. http://ht.ly/2aae4 (Thanks @sha8088!)” (PP&EA, 140).
Only 4.4% of tweets fall into the UNKNOWN category compared with 41% Self
Golbeck, Grimes and Rogers. Furthermore, in only five Agencies did UNKNOWN occur
more than once. These five, in order of decreasing UNKNOWN frequency, are the
Tourism Office, the Museum of Natural Science, PP&EA, the Governor’s Office, and
the Department of Commerce. If the five agencies with an UNKNOWN Subject
frequency of one or fewer are dropped from the study, the frequency of the
UNKNOWN Subject category rises to 6.7%, still far below the figures found by Honey
and Herring and Golbeck, Grimes and Rogers. See Table 2 for a complete
breakdown of these categories.
Table 2.
Twitter Conversations and Unknown Categories by Agency
Agency Conversation Twitter Unknown
Department of Commerce 5.8% 3.5%
Department of Corrections .9% 0
Department of Environment & Natural Resources 5.5% .7%
Museum of Natural Science 12.4% 9.1%
Office of the Governor 19.4% 5.2%
Pollution Prevention & Environmental Assistance 24.2% 7.8%
State Chief Information Officer 0 0
State Highway Patrol 2.1% 0
Tourism Office 29.7% 11.5%
Wine & Grape Council 1.2% .6%
The five Agencies with the highest rates of UNKNOWN Subject category
occurrence also had a greater frequency of the TWITTER CONVERSATION Information
Type category. The total use of TWITTER CONVERSATIONS was 11.7%, a figure close to
the 12.5% found by Java, Song, Finin and Tseng and the 12% found by Golbeck,
and 20.4% found by Jansen, Zhang, Sobol and Chowdhurry. If these five agencies are
examined alone, the frequency of TWITTER CONVERSATIONS increases to 18.4%—
approximately the same as Jansen, Zhang, Sobol and Chowdhurry’s organizational
Twitter conversation rate, but still lower than Honey and Herring. This division
indicates that the Tourism Office, the Museum of Natural Science, PP&EA, the
Governor’s Office, and the Department of Commerce employ Twitter in a manner
that is more similar to the typical user than do the Highway Patrol, Department of
Corrections, the Wine Council, Department of Natural Resources, and the State Chief
Information Officer. For the remainder of this paper, the former group will be called
“Twitter typical” and the latter “Twitter irregular.”
In many ways, however, these two groups are more similar than they are
different. For example, a remarkable number of tweets, 1,042 or 81.3%, contain a
URL, as can be seen in Table 3. The type of site linked to varies—the Highway Patrol
links exclusively to its Facebook page, the Governor’s Office links to a number of
official blogs and websites, while URLs from the Tourism Office often point to their
interactive calendar. In their study of Twitter use, Java, Song, Finin and Tseng found
that 13% of tweets contain a URL. 44.8% of Congressional tweets contained a URL
according to Golbeck, Grimes and Rogers. In this study, only the Chief Information
Officer had a low number of tweets containing URLs. If the Chief Information Officer
is excluded, the Twitter irregular group had a URL rate above 90%. Agencies in the
Twitter typical group had a URL rate ranging from 68% to 83%.
When the large number of tweets containing URLs, the frequency of Twitter
conversations, and the rate of Information Type categories are pulled together, a
picture of Twitter as a means of government communication begins to emerge.
Recall that Chadwick and May and Elmagarmid and McIver consider simple
information dissemination the most basic form of e-‐Government. With the
ANNOUNCEMENT Information Type category at 54.6% of the tweets coded, it is clear
that the presentation of information, rather than conversation, is the primary
purpose of most Agency tweets. If the related Information Type categories PUBLIC
SERVICE ANNOUNCEMENT and PRESS RELEASE are combined with ANNOUNCEMENTS, they
make up 65.9% of all tweets. The Subject categories also indicate that information
presentation is the goal of Agency Twitter use. After all, only 4.4% of all tweets fall
into the UNKNOWN Subject category, meaning that 95.6% of all tweets are about
something other than conversation.
Table 3.
Tweets Containing URL by Agency
Agency Number of URLs % of Total
Department of Commerce 142 82.5% Department of Corrections 102 94.4% Department of Environment &
Natural Resources 138 95.2%
Museum of Natural Science 81 66.9% Office of the Governor 91 67.9% Pollution Prevention &
Environmental Assistance 115 75.2% State Chief Information Officer 2 9.0%
State Highway Patrol 86 91.2%
Tourism Office 124 75.2%
The connection between TWITTER CONVERSATION and UNKNOWN categories
discussed above shows that to some degree the public is involved with the
government via Twitter. The Twitter normal group uses Twitter to communicate
with the public, and one can assume that the public is using Twitter to communicate
with the government. Furthermore, the number of SOLICITATION AND EXHORTATION
tweets also suggests an attempt to engage with members of the public. These
tweets encourage participation, whether it is an invitation to an event: “Enjoy the
Shallow Ford Wine Trail's Wine & Dine event on Fri. July 23 featuring wine pairings
with food from the grill. http://bit.ly/bBiFMn “ (Wine Council, 70) or a request for
information or action: “What's in a name? You tell us! Join a focus group to help
name our new wing on the night of 10/18. Apply here: http://conta.cc/bhyEwf”
(Museum of Natural Science, 43). The combined frequency for the TWITTER
CONVERSATIONS and SOLICITATIONS AND EXHORTATIONS categories is 30%.
However, the large number of URLs included in Agency tweets implies that
the tweets are used as what Chadwick and May call the “push model” of information
dissemination. Tweets with URLs do not necessarily inform in and of themselves;
instead, they direct the public to information sources outside the Twitter feed. In
many cases these tweets serve as a teaser for a longer messages and are cut off mid
sentence: “Meet Gov. Perdue's guests -‐ Blog by Ben Niolet, Director of New
MediaOffice of the Governor: Gov. Perdue will te... http://bit.ly/eCDPAu”
(Governor’s Office, 43). The number of re-‐tweets also indicates a push model of
information dissemination. Like attached URLs, re-‐tweets serve to direct the reader
the public. 21.1% of all tweets in this study are re-‐tweets. 65.7% of those re-‐tweets
fell into the ANNOUNCEMENTS Information Type category as shown in Table 4.
Despite the large number of URLs used by these Agencies, their use of
Twitter goes far beyond one-‐dimensional information broadcasting. For example,
SOLICITATIONS AND EXHORTATIONS appear in all ten Agency feeds. Although a majority
of the tweets in this category invite the public to ACTIVITIES, EVENTS, and FAIRS AND
FESTIVALS, there were a number that invited readers to participate in discussions or
provide information. For example, many tweets from the Governor’s Office ask
readers to take part in The Budget Challenge, an interactive website where you can
choose which government services to cut in order to reduce North Carolina’s budget
deficit. Tweets from the Tourism Office direct readers to Facebook threads where
they can share ideas: “Got a favorite place for a first date? Share your idea here:
http://on.fb.me/hPazDa” (Tourism, 54). And, while most of tweets in the TWITTER
CONVERSATION Information Type Category are responses to other users, there are
several that seek to initiate conversation, such as this example from PP&EA: “Two
Table 4.
Re-‐tweets by Information Type
Information Type Count % of Total
Announcements 138 65.7
Press Releases 5 2.4
Public Service Announcements 8 3.8
Self Promotion 5 5
Solicitations and Exhortations 42 42
Twitter Conversations 12 12
days until Christmas! What's your favorite eco-‐gift to give or receive?” (PP&EA, 24).
Chadwick and May call this a consultive form of e-‐Government: agencies seek
information from citizens in order to inform the decision making process, as is the
case in the Governor’s Office. By seeking comments and initiating discussions, these
Agencies promote communication between members of the public. These examples,
and the level of TWITTER CONVERSATIONS in general, show that Twitter communication
is not simply communication between individuals and Agencies. Instead, the
frequency of conversation and consultation suggest a movement towards Twitter as
a participatory means of government communication.
Based on this analysis of the data collected and compared with prior
scholarly work, it is clear that Twitter use by North Carolina State Agencies differs
from personal use. The degree of difference, however, varies. Certain Agencies are
more likely than others to take an active role in Twitter discussions. Regardless of
their level of conversation, all Agencies use Twitter to broadcast information related
to their mission or area of focus to the public. In the context of e-‐Government, the
combination of conversational characteristics and information broadcasting leads to
the conclusion that Twitter is not being used as a radically new type of government
communication.
Limitations and Further Study
Riffe, Lacy and Fico caution against nonprobabalistic convenience samples,
such as the tweets collected for this study, warning that the results can be limited or
convenience sample was necessary. Some Agencies tweeted so infrequently that
building a corpus of randomly selected tweets could take months, if not years. For
example, it took the Department of Corrections 18 months to tweet the 135
messages examined. It is hoped that a probabilistic sample can be collected in any
future studies of government Twitter use.
The large number of Subject categories also limits the strength of the
conclusions. As discussed in the Methods section above, Subject categories were
developed and refined throughout the coding process. Several Subject category
groups, however, caused problems and confusion. The overlap between ACTIVITIES,
EVENTS and FAIRS AND FESTIVALS was particularly troubling, but a decision was made
to preserve the three separate categories at the conclusion of coding. ACTIVITIES
were conceived of as lively affairs where individuals or groups can take an active
role in a specific pastime. The study defined EVENTS as a more passive category—
information is presented for individual consumption. FAIRS AND FESTIVALS are group,
and often themed functions composed of a variety of activities and events. The
distinction between these categories is slight and, in retrospect, less important than
originally thought. It would be wise to collapse the Subject categories in future
studies. Ten or twelve Subjects would be more manageable and could be as
comprehensive as the current 25. Also, such a collapse would most likely increase
the statistical significance and lend a greater degree of certainty to chi-‐square and
other correlation calculations.
It is hoped that future studies will take into account the work of W. Russell
the effect of technology on the media and the public at large. Despite the
comparative age of his works in what is a rapidly evolving field, they serve to
balance some of the more utopian ideas of many e-‐Government scholars. Given
time, it is hoped that any future study would incorporate Neuman’s methods in the
same way this study was influenced by Golbeck, Grimes and Rogers and Honey and
Herring.
These studies, and the related scholarly work discussed throughout, have
begun to develop a baseline for future research. Armed with the results of this
study, future scholars can undertake a more robust and significant examination of
government social media use. Such a study should use qualitative and empirical
methods to test the conclusions discussed above.
Conclusion
In many ways the results of this study seem self-‐evident. For example, the
fact that Agencies are using Twitter to send out messages related to their mission or
area of focus is hardly unexpected. However, the data also presents interesting and
unexpected conclusions, particularly when results are compared with the works of
other scholars. Half of the Agencies surveyed use Twitter as a way of conversing
with the public, half do not. All Agencies are more likely to use Twitter as a way of
broadcasting information than the typical Twitter user. It is, therefore, safe to
conclude that Twitter use by North Carolina State Agencies differs significantly from
other users.