The Asian Journal of Technology Management Vol. 5 No. 1 (2012): 42-52
Applying System Dynamics Approach to the Fast Fashion Supply Chain:
Case Study of an SME in Indonesia
Mariany W. Lidia 1, 2+, Takeshi Arai 1, Aya Ishigaki 1 and Gatot Yudoko 2 1
Department of Industrial Administration, Tokyo University of Science 2
School of Business and Management, Institut Teknologi Bandung, Indonesia
ABSTRACT
The fashion industry is the biggest contributor among the 14 creative industries in Indonesia. Nowadays many apparel companies are shifting toward the vertical integration. Since speed is everything to be successful in the apparel industry, fast fashion retailers must quickly respond to the market demand. This papers aims to develop a model of the supply chain of a small and medium scale enterprise (SME) of an apparel company in Indonesia and to propose a decision support system using System Dynamics (SD) and helps the management to identify the best business strategy. Simulated scenarios can help the management to identify the most appropriate policy to be applied in the future. Case study method was used in this research where data were collected from a typical fast fashion firm in Indonesia that produces its own wares ranging from raw materials to be ready-to-wear clothes, has three stores, a warehouse and is running online sales system. We analyses the result of many simulations in a fashion company from an operational point of view and from them we derive suggestions about the future business strategy in a small and medium fashion company in Indonesia.
Keywords: system dynamics, fast fashion, supply chain management, SME, Indonesia
1. Introduction*
During this time, Indonesia was only became a home for original equipment manufacturer (OEM) for branded products from another countries such as Zara, Gap, Esprit, Uniqlo and so on. Fashion industry in Indonesia basically has the potential evolved essentially very well. Since Indonesia has potential of natural and human resources, it could produce qualified products fashion.
Ironically, none of the original Indonesia brand garments are sold in Factory Outlets
*
Corresponding author. Email: mariany.lidia @sbm-itb.ac.id
M. W. Lidia, Applying System Dynamics Approach to the Fast Fashion Supply Chain: Case Study of an SME in Indonesia
One thing that cannot be denied is the fashion world is highly perishable, influenced by the latest thing seen on the catwalk or on the back of a celebrity. Firms should
improving quality, creating unique design, and also applying a proper supply chain to their business strategy.
Fig. 1. Domestic Products Position in Indonesia.
Fast fashion is a contemporarily term used by fashion retailers to acknowledge that designs move from catwalk to the store in the fastest time to capture current trends in the market (Zhenxiang and Lijie, 2011). Fast fashion has developed from a product-driven concept based on a manufacturing model referred to as “quick response”, it also represent about creating new, fresh product while also drawing consumers back to the retail experience for consecutive visits. Quick Response (QR) was a phrase coined in 1985 by Alan Hunter and moved to a market based model of “fast fashion” in the late 1990s and first part of the 21st century (Hines & Bruce, 2007).
Fast fashion is a term refers to affordable basics and disposable trends. It also used to describe the production of clothing collections based on the most recent fashion trends (Dillon, 2012). Fast fashion is a concept
whereby retailers orientate their business strategies to reduce the time taken to get fashion product into store, working on a system of in-season buying so product ranges are consistently updated throughout the season (Barnes et al., 2009). This type of fashion is considered seasonal, mostly trend-focused and mass produced.
Today many of the apparel industries shift towards vertical integration starting do full supply chain flows such as starting from selecting raw materials, dyeing, designing, cutting pattern, sewing, packing and sell to allotted retail shop and ended to the customers. This to meets the dynamic world mainly due to the growing complexity such as demand uncertainty and also trends changing every four to six weeks. Supply chain is crucial issue to integrate from initial design stage through the early raw material and cash flow also information flow between customer and manufacturer (Hines, 2007). It consists of a series of activities that an organization uses to deliver value, either in the form of a product, service, or a combination of both, to its customers (Samaranayake, 2005).
Due to the improve responsiveness of supply chain in the fast fashion the concept of supply chain can be conclude to such as just-in-time (Bruce et al., 2004), agile supply chain (Christopher et al., 2004; Bruce et al., 2004) and quick response strategy (Patil et al., 2010). Supply chain strategies are either based on reducing cost and improving efficiencies and focus on doing things differently to become more effective in serving the customer and creating added value. In other words, not only efficiency goals can be pursued by supply chain management but also the impact can be seen on such product quality, product availability, customization delivery lead time (Brun & Castelli, 2008).
2. The SD Approach
In this study, we considered a system dynamics (SD) model to be appropriate research tools. The purpose use SD is to improving the understanding and identification of the causal relationship in the system. SD was introduced by Jay Forrester in his book, Industrial Dynamics in the early 1960s. In several areas of management research, computer simulators based on SD model are used as a means to explore the subjects’ understanding and behaviour in complex
situation. SD is a methodology for studying and managing complex feedback system, such as one finds in business and other social systems.
In fact it has been used to address practically every sort of feedback system, problem solving and policy design. The purpose of SD modeling is to improve our understanding of the ways in which an organization’s performance is related to its internal structure and operating policies and then to use that understanding to design high leverage policies for success (Sterman, 2000). John D. Sterman defines SD as follows: “System dynamics is a perspective and set of conceptual tools that enable us to understand the structure and dynamics of complex system. System dynamics is also a rigorous modeling method that enables us to build formal computer simulations of complex system and use them to design more effective policies and organizations”.
3. The Case Study
The application of the proposed system is illustrated and verified through a case study. A brief description of the case company and data is given, and the proposed model is then estimated and evaluated. The case company is a typical fast fashion firm in Bandung, Indonesia that produces its own wares ranging from raw material to be ready-to-wear clothes, has three stores, a warehouse and running online sales system. This company is the founder of boudist or boutique distro community. Boutique represents the meaning of fashion for female and distro symbolize the “do it yourself”community.
charact each se actual
3.1. C
Sin visitor, Bandun view, v great e them Produc the str custom as sal
3.2. P
Pro quality the ma produc Rajaram recent assortm (Caro
M. W. Lidia, A
teristic, and ection. Due t data are conc
Customer as
nce Bandung , many of ng. So in po visitor and po effect to dem
will shoppin ct) and remain reet or anoth mers who buy es. These n
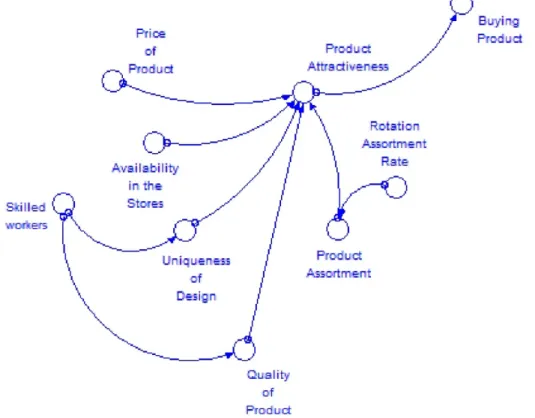
Product Attra
oduct attracti y, product ava ain stimulus in ct (Brun & C m, 2001; Va
study recog ment rotation
et al., 2009
Applying System
the number to confidentia cealed.
Demand Per
g is destinati visitors cam otential custo opulation of B mand increm ng in the s n of them wil her stores. Th y product can numbers can
Fig. 2.
activeness
veness (in te ailability, and nfluencing cu Castelli, 2008 aagen & Wal
gnizes the i n in a comp 9). For any
Dynamics Appr
of worker i ality, all of th
rspective
ion of touris me and go t
omer point o Bandung hav ment. Some o store (Buyin
ll shopping o he number o
be considere be used b
. From Enhanc
erms of desig d assortment) ustomers to bu 8; Chan, 201
lace, 2008). importance o petitive settin
retailer wi
roach to the Fas
in he st to of ve of ng on of ed by compa buy p capita Cu and n influe promo produ custom custom bough about produ where
ing Customer B
gn, is uy 1; A of ng th variety assort signifi variety A rotate H&M chang produ
t Fashion Supply
anies to estim roduct is also a of population
ustomers deri new customer nced by int otion underta uct attractiven mers to come mer will contr ht product th
their impres uct, their acqu e they buy the
Buying Produc
y-seeking cu tment rotation ficantly to dev
y to be manag
And it needn’ frequently, M. This also s
ge itself, rat uct being repl
y Chain: Case S
mate demand. o determined
n.
ived from fre r. Intentions t ensify the a aken by comp ness would be e to the store ribute to WO ey will tell t sion or when uaintance will
e product.
ct.
ustomers, so n is desirable, velop capabil ged efficientl
’t just be tre as happens shows the im ther than sp laced. The pr
Study of an SME Indones
. The ability by income p
quent custom to buy are al advertising an
pany. And al e able to attra e. The freque OM effect. Aft to their frien n they wear t see and askin
ome degree , and it pays o lities that allo y.
endy items th with Zara a mportance of t pecific type rice factors al
contribute to product attractiveness. It is difficult to say which component of pricing is more important than another. Prices also level where the consumer perceives the price to be fair with value. When customers come in and
find out what makes them look younger, thinner, and sexier, they are not as apt to look at the price tag. They know that no matter what the cost, they’ve found their own best value (Flynn and Foster, 2009).
Fig. 3. From Enhancing Product Attractiveness.
3.3. Improving Innovation and Production
Labor is one of vital input for overall production process. Skilled labor will produce high productivity thus merchandise produced have high quality and quantity of production increased. Based on interviews the most difficult part to do is in making pattern (Cutting) and sewing the accordance the
M. W. Lidia, Applying System Dynamics Approach to the Fast Fashion Supply Chain: Case Study of an SME in Indonesia
Fig. 4. From Enhancing Production Lead Time.
3.4. Total Cost
Total cost is the total cost to run a
business, such as raw material costs, fixed
costs (building and machines), employee
salaries, advertising costs, production costs
and training costs. Inflated production cost
can also be caused by excessively defective
goods. The company should manage the
expenses due to the purpose of an
organization running a business is to gain
optimal wealth. To optimal profit, the
company must optimize the operational
cost. Any inefficient costs should be
eliminated. For example for advertising the
company could use the social media to
promote their products, make promotion,
announcement, and create an events. Total
cost can be used as the foundation for
management to determine the revenue
targets and from this revenue target can
specify how many sales targets are to be
obtained.
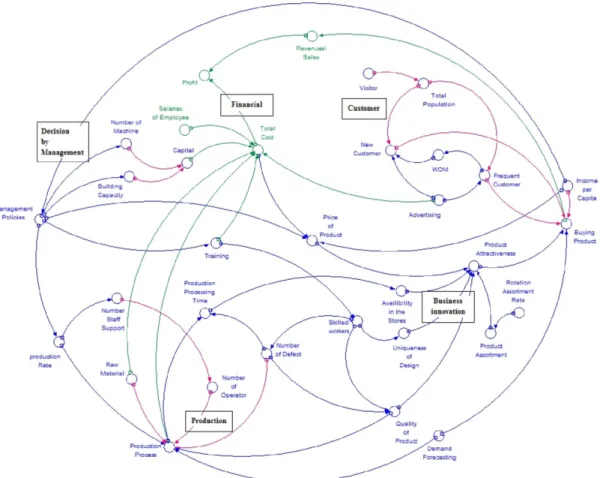
3.5. Causal Relationship
The purpose of an organization is to create more wealth for its owners. This is refers to how to create more profit. A financial measure involves some measurement of the overall profitability of the organization (McGarvey et al., 2001). Based on the goal of an organization running a business, we will illustrate a causal relationship model that provides a framework for developing model to provide decision support to run the business strategies. We analyses the result of many simulations in a
fashion company from an operational point of view and from them we derive suggestions about the future business strategy in a small and medium fashion company in Indonesia. This section presents an overview of the causal relationship variables. Red arrow lines indicate the flow of material, the blue lines shows the flow of information between the factors, and the green lines indicate the financial flows in the system.
M. W. Lidia, Applying System Dynamics Approach to the Fast Fashion Supply Chain: Case Study of an SME in Indonesia
4. The SD Model
Based on causal relationship model,
initial input parameters for the proposed model are shown in this table:
Table 1. Parameters Input in the Proposed Model.
Parameter Definition Unit
Bandung population Number of population in Bandung People
Target population Number of target market age People
Target rate Number of percentage target market Percentage
Display Number of cloths in the stores Item
Display level Number of new arrival item Item
Display change Number of rotation cloths display /weeks
Workers Number of operator assigned in production People
Price The price of product Rp
Total cost Cost of employee salaries Rp
5. Result and Discussion
To gain more profit the company must keep frequent customer and increase new customer (sometimes customer) to purchase the merchandise. The product attractiveness such as affordable price, products variety, and also the quality greatly influence to a sometimes customer to be a frequent customer. Based on interview results can be deduced the purchasing power parity of target market for clothing purchases. Rely on this data; the company can set up the level of clothing prices. The second factor is service quality. Service qualities in this point are shop attractiveness and the staff attractiveness. The shop attractiveness supported by the product assortment, rotation of clothing in a display area, and how company define the amount of clothing with a new design for display at the new arrival area (display level).
Within one month, the average customer to buy or windows shopping into store as much as 1-2 times. This is an indication of management in producing the new design and strategy product replacements in the store are very important. It is intended that customers will finding something new and fresh every time comes into the store. Despite these factor are met, but when the availability of goods (display) in the store are low or empty, this will make the customer go to another store and the store will lose the opportunity to gain sales.
With sales increment it means the management has resources to open a new retail store. With the additional number of shop it will effect on shop level. The time taken to replenish store will be lead if the defect clothes decrease. The defect could be minimizing by increase the skill of worker. With the skilled worker the production processing time can be lead. Worker’s skills can be improved with training. The target training also can be defined by unskilled workers and skilled workers. Conduct training is not easy, because the company
have to budgeted substantial funds such as the need to hire a professional. But these factors are trade off when the company want to preserve the value of long-term business (customer lifetime value). In recent years, many companies have focused on how to enter markets and meet customer requirements to boost their market share and profit and pretermit the customer loyalty and generate greater profits in the long term. These highlight the keys factors that ought to be considered in making policy decisions.
6. Conclusions and Future Research
The proposed model focuses on the modelling generally fast fashion supply chain an SME in Indonesia. However this study has limitations that result applications of this study are only eligible to the same scale of fast fashion companies, and due to different situation in every country, the result of this study are only relevant if implemented in the same country. This study only considers the company’s point of views such as production process, marketing strategy, and human resources. We also state that for providing insight, we are not optimal defining the individual variables such as variety planning under uncertainty, assortment planning under shelf space constraints and consumer behaviour it could be extended in the future research.
In conclusion, we believe this model provides a useful framework to understand and analyse several factor to make decision policies problem.
7. Acknowledgements
We would like to express our sincere gratitude to Mrs Sherly, Alifia Meta, and Agus who provided assistance and information during site visits and interviews. We would also like to thank the anonymous respondent for giving their opinion in the questionnaire.
M. W. Lidia, Applying System Dynamics Approach to the Fast Fashion Supply Chain: Case Study of an SME in Indonesia
References
Akkermans, H. and Dellaert, N. (2005). The Rediscovery of Industrial Dynamics: the Contribution of System Dynamics to Supply Chain Management in a Dynamic and Fragmented World. System Dynamics Review 21 (3): 173-86.
Brun, A. and Castelli, C. (2008). Supply Chain Strategy in the Fashion Industry: Developing a Portfolio Model Depending on Product, Retail Channel and Brand. International Journal Production Economics 116: 169-181.
Cagliano, A.C. and Rafele, C., DeMarco, A. (2011). Using System Dynamic in Warehouse Management: a Fast-fashion Case Study. Journal of Manufacturing Technology Management 22 (2): 171 – 188.
Chan, S. L. and Ip, W. H. (2011). A Dynamic Support System to Predict the Value of Customer for New Product Development. Decision Support System 52, :178-188.
Dillon, S. (2012). The Fundamental of Fashion Management. Switzerland: AVA Publishing SA
Barnes, L. and Lea-Greenwood, G. (2009). Fast Fashion in the Retail Store Environment. International Journal of Retail & Distribution Management 38 (10): 760-772
Capelo, C. and Dias, J. F. (2009). A System Dynamic-Based Simulation Experiment for Testing Mental Model and Performance Effects of Using the Balanced Scorecard. System Dynamic Review 25 (1): 1-34
Caro, F. and Albéniz V. M. (2009). The Effect Rotation on Consumer Choice and its Impact on Competition. International Series in Operation Research & Management Science 131 (Part 1): 63-79
Caro, F. (2005). “Dynamic Retail Assortment Models with Demand Learning for Seasonal
Consumer Goods”. Working Paper, Massachusetts Institute of Technology.
Barry, N. (2004). “Fast Fashion”. European Retail Analyst Mintel Group Ltd, London .
Christopher, M., Lowson, R. and Peck, H. (2004). Creating Agile Supply Chains in the Fashion Industry. International Journal of Retail & Distribution Management 32 (8): 367-76
Flynn, J. Z. and Foster, I. M. (2009). Research Methods for the Fashion Industry. USA: Fairchild Books.
Größler A. (2001). Musing about the Effectiveness and Evaluation of Business Simulators. In Proceeding of the 19th International Conference of the System
Dynamics Society, Atlanta, GA.
systemdynamic.org
Márquez, A. C. (2010). Dynamic Modeling for Supply Chain Management Dealing with Front-end, Back-end and Integration Issues. London: Springer-Verlag
McGarvey, B and Hannon, B. (2004). Dynamic Modeling for Business Management an Introduction. New York: Springer-Verlag
Patil, R., Avittathur, B. and Shah, J. (2010). Supply Chain Strategies Based on Recourse Model for very Short Life Cycle Products. International Journal Production Economics 128: 3-10
Rajaram, K. (2001). “Assortment Planning in Fashion Retailing: Methodology, Application and Analysis”. European Journal of Operation Research, 129: 186-208.
Samaranayake, P. (2005). A conceptual Framework for Supply Chain management: a Structural Integration. Supply Chain Management: An International Journal 10 (1): 47-59.
System Thinking and Modeling for a Complex World. Singapore: McGraw-Hill.
Simatupang, T. M. Sandroto, I. V. and Lubis, S. B. H. (2004). Supply Chain Coordination in a Fashion Firm. Supply Chain Management an International Journal 9 (3): 256-268
Suryawati (2009). Analisis Struktur, Perilaku dan Kinerja Industry Tekstil dan Pakaian Jadi di Provinsi DIY. Jurnal Akutansi dan Manajemen 20 (1).
Tan, B., Anderson Jr., E. G., Dyer, J. S. and Parker, G. G. (2010). Evaluating System Dynamic Model of Risky Projects Using Decision Trees: Alternative Energy Projects as an Illustrative Example. System Dynamic Review, 26 (1): 1-17
Vaagen, H. and Wallace, S. W. (2008). Product Variety Arising from Hedging in the Fashion Supply Chains. International Journal Production Economics 114: 431-455.
Yuen, F. T. and Chan, S. L. (2010). System Dynamic Modeling in CRM: Window Fashions Gallery. International Journal of Engineering Management 2 (2): 77-84
Zhenxiang, W. and Lijie, Z. (2011). Case Study of Online Retailing Fast Fashion Industry.
International Journal of Education,