AC 2010-884: TEACHING CONTROL CHARTS FOR VARIABLES USING THE
MOUSE FACTORY
Douglas Timmer, University of Texas, Pan American Miguel Gonzalez, University of Texas, Pan American Connie Borror, Arizona State Universtiy
Douglas Montgomery, Arizona State University Carmen Pena, University of Texas, Pan American
© American Society for Engineering Education, 2010
P
Teaching Control Charts for Variables using the Mouse Factory
Introduction
The American Society for Engineering Management (ASEM)1 defines engineering management as “the art and science of planning, organizing, allocating resources, and directing and
controlling activities which have a technical component.” Quality-related activities are widely accepted as an important field of engineering management. In today’s global and highly
competitive business environment, high quality products and services are a necessity. Quality is one method in which organizations compete2. The Society of Manufacturing Engineers (SME)3,4 has conducted competency surveys and has repeatedly identified quality as an important
competency gap.
This paper will present a method to address the quality competency gap in the use of control charts for variables. Control charts, in general, are one of the most important tools for quality control and improvement5. Montgomery5 states that control charts have common usage in many industries due to the following reasons: 1) control charts are a proven technique for improving productivity, 2) control charts are effective in defect prevention, 3) control charts prevent
unnecessary process adjustments, 4) control charts provide diagnostic information, and 5) control charts provide information about process capability. This research will present a method for teaching engineering students the use of X control charts.
Another important gap is in the pedagogy used to teach quality control and control charts in many engineering curriculums. It is the authors’ experiences that most engineering instruction is still conducted in a lecture format. While lecturing is an excellent method of communicating large amounts of information, students are experiencing passive learning and the amount of learning that occurs is often small6. There are many excellent textbooks, such as Montgomery, that provide explanations and practice problems. However the use of textbook and homework problems stress the categories of knowledge, comprehension and application in Bloom’s Taxonomy7 of cognitive skills. But this mode of instruction is less likely to emphasize the higher-order cognitive skills of analysis, synthesis and evaluation. In the laboratory teaching control charts for variables, students must design a control chart that involves select the subgroup size and the sampling interval. Students are able to implement their control charts and evaluate the effectiveness of their control charts upon the number of good parts produced and the defect rate. These activities emphasize higher-order cognitive tasks of analysis, synthesis and
evaluation.
This paper will present research on developing and implementing a web-based, active learning module that teaches students the use of control charts for variables. Learning activities are designed to emphasize higher-order cognitive skills. Results of implementing the learning module in a senior-level Manufacturing Engineering course are presented. Conclusions and
future research are presented in the final sections. P
Mouse Factory
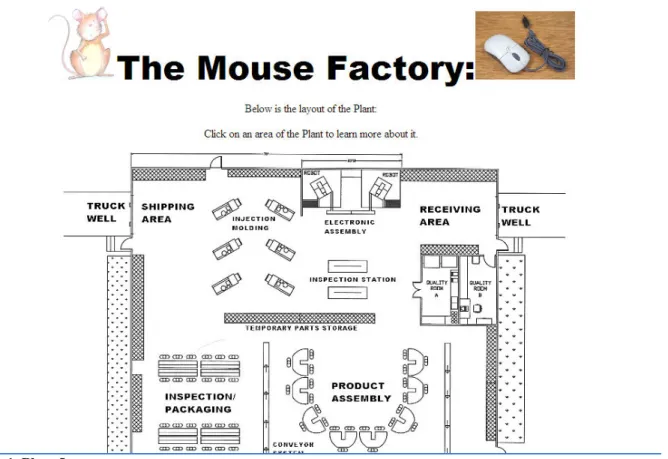
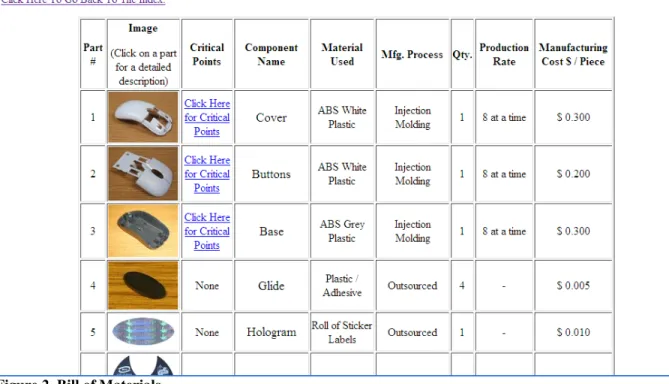
The Mouse Factory is a web-based simulation of a manufacturing plant for computer mice. There are two major components to the Mouse Factory. The first major component is a (html) website that contains a complete description of the Mouse Factory. Figure 1 shows the plant layout for the Mouse Factory. The plant layout contains “hot zones” that allow the user to click to view the details of any portion of the Mouse Factory. At the bottom of the plant layout page is a link to the bill of materials. The bill of materials shown in Figure 2 contains a list of all
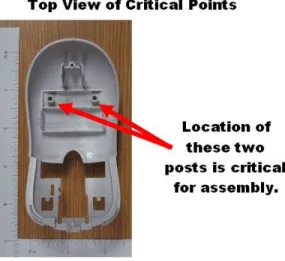
materials required to make a computer mouse and production information. Quality related information is found in the bill of materials by clicking on the critical points hyperlink. Figure 3 displays the critical point information for the mouse cover. The cover contains one inspection point, the post diameter, where a control chart may be applied. In addition to the variables information, attributes data describing possible non-conforming items and non-conformities is also contained in the critical point webpage.
Figure 1. Plant Layout
The Mouse Factory contains nine inspections points in which control charts for attributes may be implemented. An inspection point may be in one of three states: in-control with a Cp of 1.0, out of control with a minor special cause (small shift in mean) or out of control with a major special cause (large shift in mean). Additionally there are thirty different non-conforming items on six parts and thirty different nonconformities on six different parts. Non-conforming items and nonconformities may also be present in three states similar to the inspection points for control
P
charts for variables. This system allows 400,500,000 different configurations to be created. Thus each student is practically guaranteed to receive a different configuration.
A second web-based application developed in Java Server Faces (JSF) is available for the control charts for the control chart for variables learning module. JSF is a server-side user interface component for Java technology-based web applications8. JSF enables the use of backing beans, JavaBeans components, to store information and execute methods (subroutines). The advantage of this architecture is the separation between behavior and presentation. The second web
application provides the following functionality: 1) provides historical data for constructing control charts, 2) implement control chart in manufacturing plant and 3) gather production and quality records to evaluation impact of control charts. This module assumes that the control charts for variables performs a corrective action. That is the special cause is removed when the control chart signals but returns to the process at a later random time. The web-based module was written in Netbeans and utilizes the Glassfish application server. A MySQL database maintains the Mouse Factory information and student records. A major advantage of this approach is that Netbeans, Glassfish and MySQL are all open-source software packages.
Figure 2. Bill of Materials
P
Figure 3. Critical Point - Cover
SPC Lab One
The first SPC laboratory, which is discussed in a separate paper, introduces students to the Mouse Factory and allows students to develop a quality improvement plan. In the process of developing a quality improvement plan, students collect and analyze historical data from Mouse Factory regarding production records and quality records. Students construct a check sheet and Pareto diagram from defect data. The laboratory is designed so that students will identify one of the nine inspection points as causing the most defects. The inspection point identified from the first laboratory is used as the starting point for the second SPC laboratory.
SPC Lab Two
The second SPC laboratory allows students to design, implement and evaluate the impact of implementing a X control chart within a manufacturing plant. The second SPC laboratory
P
materials contain four components: assignment, rubric, Mouse Factory website and Control Chart for Variables web-based application.
The second SPC laboratory contains the following four learning goals:
≠ Design a sampling plan for an Xcontrol chart,
≠ Perform a retrospective analysis for the control chart,
≠ Implement the Xcontrol chart in the Mouse Factory
≠ Evaluate the effect of implementing the X-bar control chart.
An important consideration in developing the learning goals was a focus on higher-order
cognitive skills. Based upon the learning goals, a list of deliverables is provided to the students. Students are required to provide:
≠ A professional, type written report,
≠ A detailed discussion of their sampling plan. Students are not allowed to sample every unit,
≠ A set of control limits for use in online monitoring,
≠ A new benchmark of production and quality metrics from the process with the control chart implemented,
≠ A comparison of the plant performance with and without a control chart,
≠ The Xcontrol chart applied to online data,
≠ Create a new Pareto diagram of the defect database when control charts are applied (remember to remove the control chart signaled records),
≠ A summary statement describing lessons learning from this laboratory.
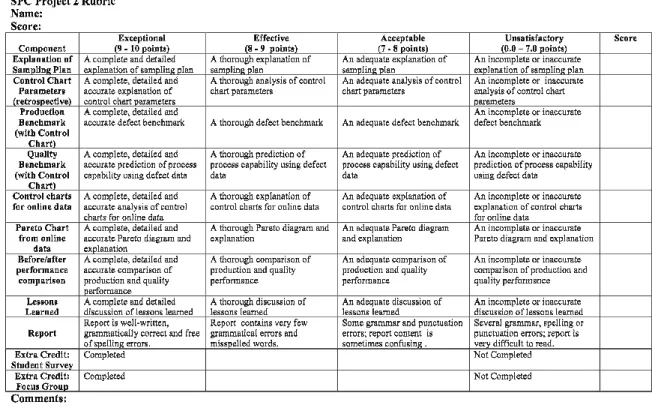
The list of deliverables is the linkage between the learning goals and the evaluation of student performance using the rubric shown in Figure 4.
The final component of this laboratory is assessment. Student performance for this laboratory is evaluated using the rubric show in Figure 4. Students were voluntarily asked to complete a demographic sheet and survey after submitting the laboratory. The survey focused on the students perceived understanding of the laboratory learning goals and confidence to implement learning goals in real life.
P
Figure 4. SPC Lab 2 Rubric
Results
The second SPC laboratory was implemented at the University of Texas – Pan American
(UTPA) in MANE 4311 – Quality Control during the Fall 2009 semester. Twenty-four students were enrolled in the course and twenty students submitted the second SPC laboratory
assignment. Assessment results are provided in Tables 1-3.
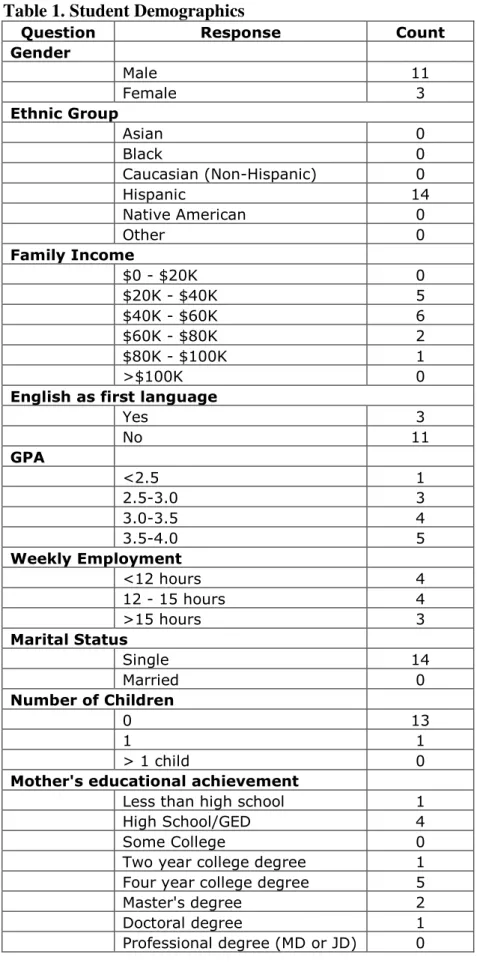
Table 1 contains the student demographic information. Participation in the demographic survey was voluntary and students were offered extra credit on their laboratory grade as an incentive to participate. Fourteen students completed and submitted a demographic survey. The
demographics are reflective of the UTPA student demographics. Male students comprised 79% of the course. All students enrolled were Hispanic. 79% of students reported a family income of $60,000 or less. An interesting statistic is that only 21% of the students responding had English as a first language.
Table 2 contains the evaluation of student performance. Student performance was classified as exceptional, effective, acceptable or unsatisfactory. These levels correspond to approximately A-level, B-level, C-level or failing levels of performance. In general, students performed at a high level, either exceptional or effective. The first learning goal, develop and explaining a sampling plan, was evaluated using the first line of the rubric. Student perform on this performance measured displayed the most variability of all items. Many students failed to specify a sampling interval and time to gather a sample in their sampling plan explanations. The second learning goal of performing a retrospective analysis is evaluated using the results from
P
the second line of the rubric. All students performed at the exceptional level for this task. Student perception of their understanding and confidence in performing a retrospective analysis was measured in the first two lines of Table 3. All students except for one either “strongly agreed” or “agreed” that this laboratory improved their understanding and confidence in performing a retrospective analysis of control charts for variables. The third learning goal of implementing an X-bar control chart in the Mouse Factory is measured by line five in the rubric provided in Figure 4. The student performance for this goal had one student perform at an exceptional level and the remaining 19 students perform at an acceptable level. Student perception of their understanding and confidence in implementing online control charts is evaluated in lines 3 and 4 of Table 3. Regarding the student’s perception of improving their understanding of the online usage of control charts, five students strongly agreed, five students agreed and two students responded as neutral. Regarding the student’s perception of improving their confidence in the online usage of control charts, six students strongly agreed, five students agreed and one student responded as neutral. The final learning goal of evaluating the effect of implement control charts for variables was the most difficult to evaluate. Four performance criteria, lines 3, 4, 6 and 7, from the rubric shown in Figure 4 are linked to this goal. The first performance criterion for the final learning goal was the development of a production benchmark for the production system with a control chart implemented. Five students performed at the effective level, thirteen students performed at the acceptable level and two students performed at the unsatisfactory level. This level of performance was also observed during the first SPC laboratory and was discussed in a separate paper. The second criterion associated with the final learning goal requires the students to develop a quality benchmark. The student performance for this criterion is provided in row four of Table 2 and the student level of achievement was almost identical to the level of achievement for the production benchmark. The third performance criterion for the final learning goal was the development of a Pareto chart for the defects of the Mouse Factory with the control chart implement. The student performance for this criterion is given in row six of Table 2 and all students performed at an exceptional level. The last criterion for the final learning goal was a comparison of the Mouse Factory with a control chart implemented compared to the Mouse Factory without a control chart implemented. The student performance is given in the last row of Table 2 with 18 students performing at the effective level and 2 students performing at the unsatisfactory level. Student’s perception of their
understanding and confidence in evaluating the impact of control charts is provided in rows five and six of Table 3. With respect to the student’s understanding of the impact of control chart for variables, four students strongly agree, seven students agreed and one student was neutral. With respect to the student’s perception of their confidence to evaluating the impact of control charts, four students strongly agreed, seven students agreed and one student responded as neutral. The final question on the student survey shown in Table 3 was should this lab be used for future classes. 67% responded that they strongly agreed the laboratory should be used in future courses and 92% responded either strongly agree or agree that the lab should be used in future courses.
P
Table 1. Student Demographics
Question Response Count
Gender Male 11 Female 3 Ethnic Group Asian 0 Black 0 Caucasian (Non-Hispanic) 0 Hispanic 14 Native American 0 Other 0 Family Income $0 - $20K 0 $20K - $40K 5 $40K - $60K 6 $60K - $80K 2 $80K - $100K 1 >$100K 0
English as first language
Yes 3 No 11 GPA <2.5 1 2.5-3.0 3 3.0-3.5 4 3.5-4.0 5 Weekly Employment <12 hours 4 12 - 15 hours 4 >15 hours 3 Marital Status Single 14 Married 0 Number of Children 0 13 1 1 > 1 child 0
Mother's educational achievement
Less than high school 1
High School/GED 4
Some College 0
Two year college degree 1
Four year college degree 5
Master's degree 2
Doctoral degree 1
Professional degree (MD or JD) 0
P
Father's educational achievement
Less than high school 1
High School/GED 1
Some College 0
Two year college degree 1
Four year college degree 7
Master's degree 3 Doctoral degree 1 Professional degree (MD or JD) 0 Current Enrollment 9 hours 1 12 hours 3 15 hours 7 16 hours 2 18 hours 1
Table 2. Student Performance Component Exceptional (A) Effective (B) Acceptable ( C ) Unsatisfactory (D-F) Sampling Plan Explanation 8 2 5 5 Retrospective Control Chart 20 0 0 0 Production Benchmark 0 5 13 2 Quality Benchmark 0 6 12 2
Online Control Chart 1 0 19 0
Pareto Chart 20 0 0 0
Before/After Comparison 0 18 0 2
Table 3. Student Survey Component
Strongly
Agree Agree Neutral Disagree
Strongly Disagree Improved understanding of
retrospective control charts 6 6 0 0 0
Improved confidence of
retrospective control charts 3 8 1 0 0
Improved understanding of online
usage 5 5 2 0 0
Improved confidence of online
usage 6 5 1 0 0
Improved understanding of impact
of control charts 4 7 1 0 0
Improved confidence of impact of
control charts 3 8 1 0 0
Conclusions
In general, students performed well on the second SPC laboratory. The one area of poor performance was quality and production benchmarks. Students did not provide the anticipated answers to these questions. An analysis of this situation revealed that the students did not clearly understand how to answer these questions. The conclusion is that the project description needs to be improved so that students have adequate guidance to provide the desired solution.
Examining the results of the student survey, it is apparent that the students view the laboratory as helpful. Most reported it increased their understanding and confidence in their ability to develop, implement and evaluate control charts for variables. Students also indicated that the laboratory should be used for future classes.
Future Research
There is still much work left to finalize this laboratory. The most pressing need is to improve the project description regarding benchmarks for production and quality. The current
implementation is well suited for kinesthetic/tactile and visual learners due to the graphical nature of the websites and the opportunity to “mouse around” the websites. However there is little content for auditory learners. Videos and mp3 (audio) tutorials need to be developed and added to the laboratory website. Additional developmental needs include expanding the types of control charts available and adding other types of special causes besides a step change in the mean.
The research team is currently recruiting test sites. Anyone that is interested in participating should contact the lead author.
Acknowledgements
Initial funding for this research was provided by UTPA Center for Information Technology and the National Science Foundation under Grant No. 0341290. This material is based upon work supported by the National Science Foundation under Grant Numbers 0817508 and 0817591.
Bibliography
1. Engineering Management (n.d.). Retrieved from http://www.asem.org/about/index.html.
2. Shtub, A., Bard, J, & Globerson, 2. (2005). Project Management: Processes, Methodologies and Economics, 2nd edition, New Jersey: Pearson-Prentice Hall.
3. Mott, R. & Houdeshell, J (1998). Addressing Competency Gaps in Manufacturing Engineering. Technical Report ER98-326, Society of Manufacturing Engineers.
4. SME Foundation (2002). Competency Gaps and Criteria for 2002. Technical Report, Society for Manufacturing Engineers.
5. Montgomery (2009). Introduction to Statistical Quality Control, 6th edition. New Jersey: John Wiley & Sons. 6. Bonwell, J. & Eison, J. (1991). Active Learning: Creating Excitement in the Classroom. Technical Report
AHSE-ERIC, Higher Education Report No. 1.
P
7. Bloom, B., Engelhart, M., Furst, E., Hill, W., & Krathwol, D. (1956). Taxonomy of Educational Objectives: The Classification of Educational Goals, Handbook 1: Cognitive Domain. New York: David McKay Company, Inc.
8. Java EE 5 Tutorial, Chapter 10 – JavaServer Faces Technology (n.d.). Retrieved from http://java.sun.com/javaee/5/docs/tutorial/doc/bnaph.html.
P