Cover Page
The handle
http://hdl.handle.net/1887/28967
holds various files of this Leiden University
dissertation.
Author: Palm, Margaretha Maria (Margriet)
Title: High-throughput simulation studies of angiogenesis - Reverse engineering the role
of tip cells and pericytes in vascular development
High-throughput simulation
studies of angiogenesis
Reverse engineering the role of tip cells
and pericytes in vascular development
Cover:Network formation with tip cells (ivory) and stalk cells (red). The cells are dynamically selected via lateral inhibition and respond less to a chemoat-tractant that is secreted by all cells. See chapter 4 for further details.
High-throughput simulation
studies of angiogenesis
Reverse engineering the role of tip cells
and pericytes in vascular development
Proefschrift
ter verkrijging van
de graad van Doctor aan de Universiteit Leiden,
op gezag van Rector Magnificus prof.mr. C.J.J.M. Stolker,
volgens besluit van het College voor Promoties
te verdedigen op dinsdag 30 september 2014
klokke 15.00 uur
door
Margaretha Maria Palm
geboren te Heumen
Promotiecommissie:
Promotor: prof.dr. Roeland M.H. Merks
Overige leden: prof.dr. Peter Stevenhagen prof.dr. Arjen Doelman
prof.dr. Reinier O. Schlingemann dr. Markus O. Heydenreich
Voor mama, die mij het vertrouwen
gaf om de grote onbekende wereld om
Contents
1 Introduction 1
1.1 Blood vessel formation . . . 3
1.2 Computational models of angiogenesis . . . 5
1.3 Thesis outline . . . 16
2 Vascular networks due to dynamically arrested crystalline ordering of elongated cells 19 2.1 Introduction . . . 20
2.2 Model description . . . 21
2.3 Results . . . 22
2.4 Discussion . . . 27
2.A Supplementary movies . . . 27
3 Diffusive signaling between endothelial cells and pericytes can cause network collapse and subsequent sprouting 29 3.1 Introduction . . . 30
3.2 Results . . . 32
3.3 Discussion . . . 42
3.4 Methods . . . 47
3.A Supplementary movies . . . 49
4 Computational screening of angiogenesis model variants pre-dicts that apelin signaling helps tip cells move to the sprout tip to accelerate sprouting 51 4.1 Introduction . . . 52
4.2 Results . . . 54
4.3 Discussion . . . 71
4.4 Materials and methods . . . 74
4.A Supplemtentary movies . . . 79
4.B Supplementary files . . . 80
4.C Supplementary tables . . . 80
5 Large-scale parameter studies of cell-based models of tissue morphogenesis using
CompuCell3D orVirtualLeaf 87
5.1 Introduction . . . 88 5.2 Materials . . . 90 5.3 Methods . . . 92 5.4 Case study - Mammary epithelial spheroid morphogenesis . . . 106 5.A Notes . . . 111 5.B Supplementary materials . . . 113
6 Discussion 115
6.1 Summarizing discussion . . . 115 6.2 Future work . . . 117
Bibliography 121
Summary 131
Samenvatting 135
Dankwoord 139
Publications 141
1
Introduction
Section 1.2 is based on:
Sonja E.M. Boas, Margriet M. Palm, Pieter Koolwijk and Roeland M.H. Merks,Computational Modeling of Angiogenesis: Towards a Multi-Scale Understanding of Cell-Cell and Cell-Matrix
Inter-actions, Mechanical and Chemical Signaling in Angiogenesis,
1. Introduction
A large network of blood vessels, called the circulatory system, supplies the body with oxygen and nutrients, and removes the waste products of meta-bolism. The circulatory system starts to develop early on during embryonic development when groups of cells form primitive networks that later connect to form the circulatory system. Disturbance of blood vessel formation during the early stages of development is often lethal because without blood vessels organs do not develop properly. After birth, blood vessel formation continues to facilitate growth and repair.
The smallest blood vessels, called capillaries, develop in a process that is called angiogenesis. This process plays an important role in the abovemen-tioned physiological processes, but it is also important in many diseases. Two common examples of diseases that involve blood vessel growth are cancer [1] and eye diseases [2]. When a tumor grows too big to directly extract oxygen from its environment, tumor cells start secreting growth factors to attract blood vessels [1]. These new blood vessels supply the tumor with oxygen and nutrients that enable the tumor to grow [1]. Furthermore, the tumor vascu-lature acts as a conduit for tumor cells to enter the blood stream, which can result in tumor metastasis [1, 3, 4]. Blood vessel growth can cause damage to the retina and this results in an impaired vision or blindness. In various forms of retinopathy, such as proliferative diabetic retinopathy and retinopathy of prematurity, hypoxia induces the formation of new blood vessels [2]. These new vessels can obscure vision or damage the retina. In age-related macular degeneration blood vessels grow behind the retina which also damages the retina [2] and results in a loss of central vision.
Recently, blood vessel formation has also be studied outside of the context of diseases. In the upcoming field of tissue-engineering blood vessel forma-tion is studied because larger tissues and organs can only funcforma-tion when they become vascularized [5–7]. When vascularization of a tissue engineered im-plant depends on blood vessel ingrowth from the host, vascularization takes a up to several weeks [8]. During this time the core of the implant is deprived of oxygen and nutrients and this could damage the implant. Recent studies have focused on improving blood vessel formation after implantation by using a scaffold or adding angiogenic factors, or on inducing blood vessel growth before implantation [7, 8].
Blood vessel formation is commonly studied in the wet lab, either in vitro
orin vivo. An alternative approach to research blood vessel formation are
1.1. Blood vessel formation
studied by altering the model components that describe these mechanisms. Furthermore, in contrast to wet lab experiments, the evolution of any model component, such as cells or chemical concentrations, can be observed with-out affecting the system. Therefore, computational modeling is good tool for studying blood vessels formation. Ideally, computational modeling is used alongside wet lab experiments. Computational models can help to steer ex-periments, while wet lab experiments are necessary to validate the model. Together, these two methods can help us to provide new insights in the devel-opment of blood vessels in health and disease [9].
In this introductory chapter we first discuss the biological processes by which blood vessels develop. Following this, we provide an overview of the compu-tational modeling approaches used to better understand various aspects of blood vessel formation. Finally, we give an overview of the research that will be discussed in the remainder of this thesis.
1.1
Blood vessel formation
Blood vessels form via two processes: vasculogenesis and angiogenesis [10]. Vasculogenesis is thede novoformation of blood vessels, which occurs dur-ing embryonic development. Durdur-ing vasculogenesis endothelial cell precur-sors, called angioblasts, organize into primitive vascular networks [10]. An-giogenesis, is the formation of new blood vessels from existing ones. Via this process the primitive vascular networks that formed during vasculogenesis are remodeled and extended. After birth, angiogenesis is responsible for the formation of blood vessels in growing and healing tissue [10]. Altogether, vasculogenesis is limited to the early stages of embryogenesis while angio-genesis is the main process of blood vessel formation after early embryoge-nesis. Therefore, we will mainly focus on angiogenesis and the cells involved in this process.
There are two mechanisms of angiogenesis: 1) intussusceptive angiogene-sis and 2) sprouting angiogeneangiogene-sis [11]. In intussusceptive, or splitting, angio-genesis vessels split along the longitudinal direction by forming intraluminal tissue [11, 12]. In this manner, blood vessels are remodelled with minimal endothelial cell proliferation and migration, and without proteolysis of extra-cellular matrix components [11, 12]. These new blood vessels are formed during sprouting angiogenesis, which precedes intussesceptive angiogenesis [12]. Sprouting angiogenesis, is involved in the formation of new blood ves-sels during growth and regeneration, and in pathological processes such as tumor vascularization and neovascularization of the eye. In sprouting angio-genesis a new vessel sprouts from the side of an existing vessel as is illus-trated in Figure 1.1. The wall of a blood vessel consists of quiescent endothe-lial cells, calledphalanx cells[13], and pericytes partially cover the outside of
1. Introduction
the vessel (Figure 1.1B). When a tissue becomes hypoxic, it secretes growth factors that activate the phalanx cells in the vessel wall [14]. One of the cells becomes the leader cell, which is called thetip cell(Figure 1.1B) [15]. When the tip cell migrates further it is followed by other activated cells, which are calledstalk cells[15], and simultaneously the pericytes detach from the ves-sel wall (Figure 1.1C) [14]. The sprout grows longer because the stalk cells directly behind the tip cell proliferate (Figure 1.1D) [15]. As the tip cell moves further away, the cells at the base of the new sprout become quiescent pha-lanx cells that develop a lumen and recruit pericytes (Figure 1.1E) [14]. When the sprout grows longer new sprouts may split of from the initial sprout result-ing in branches. Such branches later on connect with other branches, from the same or another sprout, and thereby form a vascular network.
tip cell
stalk cell
phalanx cell
pericyte
A B
C D
E
Figure 1.1:Sprouting angiogenesis.Arow of phalanx cells (gray) that line a the blood
vessel and pericytes (yellow) that partially cover the vessel on the outside.
Bone cell is activated and becomes a tip cell that migrates outwards. C
the stalk cells (green) follow and the pericyte next to these stalk cells dis-sociates from the vessel. Dthe sprout elongates because the tip cells migrates further and the stalk cells proliferate.Eat the base of the sprout a lumen forms and pericytes are recruited.
1.2. Computational models of angiogenesis
sprouting angiogenesis it does not matter which endothelial cell becomes the tip cell. As long as one cells becomes a tip cell the sprout can develop. As the sprout growth, the environment changes and an endothelial cells in the sprout may become a tip cell as well. This cell may either take over the tip [17, 18] or start a new sprout [15]. Thus, endothelial cell collectively self-organize into blood vessels. Whereas genes do not predetermine the vessels that are formed, genes do affect cell behavior. Genes are part of the pathways that regulate cell migration and behavior. These pathways integrate signals from outside, such a membrane-bound ligands of adjacent cells or diffuse ligand, with the genes expressed in the cell. In this manner, cell behavior is adapted to the environment. However, to understand the mechanisms involved in an-giogenesis and vasculogenesis, it is not necessary to know all these path-ways. Instead, the cell can be used as the main level of abstraction. In this manner we can first understand which cell behaviors are important, and then focus on the source of these behaviors. Therefore, in this thesis we will study angiogenesis with the cell as base unit. We study how certain cell behaviors and interactions to differentially behaving cells affect the patterns that form.
1.2
Computational models of angiogenesis
Computational models have been used to study angiogenesis since the 1980s. Angiogenesis research benefits from this approach in three ways. Firstly, computational models help to gain an overview in this complex system by testing which components and interactions are minimally required. These components and interactions can then be examined to understand their func-tion and predict their effects [19–35]. Computational models are therefore not only useful to gain mechanistic understanding of angiogenesis, but also to find new therapeutic targets. In this manner, computational models can be used to direct experimental studies. Secondly, computational models can discriminate between and select from alternative hypotheses [36–39]. Often, more than one hypothesis explains a biological observation, such as network formation from dispersed endothelial cells. Computational models can test the sufficiency of each hypotheses to reproduce the biological observations. Predictions that result from these models can be validated experimentally to support or reject the tested hypotheses. Thirdly, computational models can connect and combine knowledge on single proteins and mechanisms to examine angiogenesis as a system [17, 40–44]. Experimental research is of-ten limited to a specific step or protein in angiogenesis and does not grasp how this part is integrated in the whole. Ultimately, computational models include processes at multiple scales, like extracellular matrix, cells, and cell-regulation simultaneously. Such a model can than be used to model angio-genesis as it happens in the body and predict how modifications at any scale
1. Introduction
affect angiogenesis.
The earliest models of angiogenesis were continuum models that describe angiogenesis in terms of the spatial density of cells. The cell density is de-scribed by a set of equations that may include processes such a random cell movement, proliferation, chemotaxis, etc. The main advantage of these mod-els is that they can often be solved analytically, but they are often too ab-stract to mimic angiogenesis realistically. More complex techniques allow for a more detailed description of angiogenesis, which yields more realistic mod-els. Such techniques include discrete methods such as particle based model-ing that describe cells as point-like particles and cell-based models that also explicitly model the cell shape and membrane. These discrete methods are often combined with continuum models, creating a hybrid model in order to utilize the strength of both methods.
In this section we review the contribution of computational modeling to an-giogenesis research. First, we discuss how computational modeling resulted in several hypothetical driving mechanisms for vascular network formation. Second, we describe several computational models that are used study spe-cific aspects of sprouting angiogenesis. Finally, we review how the knowledge gained from simple computational models and experiments is used to build large multi-scale models, which can for example be used to study the effects of anti-angiogenic drugs.
1.2.1
Network formation
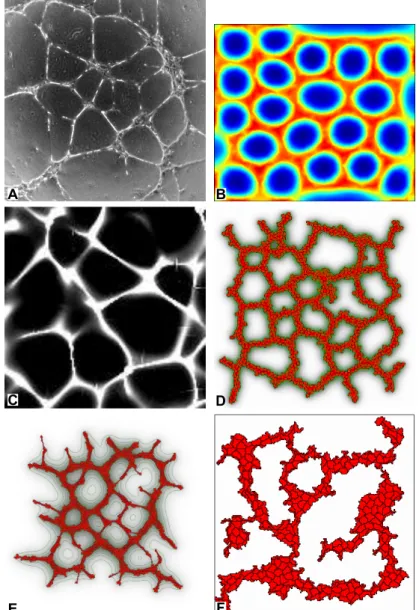
During early vascular development endothelial cells join into a primitive vas-cular network. Vasvas-cular network formation can be mimickedin vitroby seed-ing endothelial cells on a suitable matrix containseed-ing nutrients and angiogenic factors [45]; for example Figure 1.2Ashows human umbilical vein endothelial cells (HUVECs) seeded on Matrigel matrix forming a network-like pattern. The conditions inin vitro network formation experiments differ greatly from in vivoangiogenesis. Yet, specific cases of angiogenesis result in similar vascu-lar networks such as angiogenesis in the yolk sac and retinal angiogenesis [46].
In vitro experiments showed that, after the network is formed, almost all
matrix is located beneath the cells [47]. This led to the hypothesis that cells pull on the matrix, resulting in matrix accumulation below cell clusters. The pulling forces of the cells also cause the formation of tension lines, radiating from the clusters, in the surrounding matrix, along which cells migrate [21]. This model assumes that cells can exert traction on the matrix, which results in matrix deformation and heterogeneity of strain in the matrix. Cells prefer-entially move along the orientation of high stress. The model suggests that matrix remodeling suffices for network formation.
hap-1.2. Computational models of angiogenesis
F D
E F
C
A B
Figure 1.2:Overview of vascular network formation.Avasculature developedin vitro
with HUVEC on Matrigel. B networks formed with the mechanical con-tinuum model [22],Cthe chemical continuum model [20], Dcell-based model with contact inhibition [28],Ethe cell-based model with cell elonga-tion [25].Fthe cell-based model with preferential attraction to elongated structures [31]. All images were reproduced with the publishers’ permis-sion.
1. Introduction
totactic cell migration along matrix gradients (Figure 1.2B). They found an optimal cell density at which networks can be created, corresponding with ex-perimental observations [48]. Similarly, a range of matrix stiffness, which is linked to the fibrin density of the experimental matrix, was tested. This model suggested that active cell migration may be required for network formation which contradicts the observations by Manoussakiet al. [21].
Both previous models consider mechanical interactions between cells and the matrix to be the driving forces for network formation. Seriniet al. [19, 20] proposed that chemotaxis is the driving force of network formation [20]. In thein vitromodels cells move predominantly towards regions of high cell density suggesting that the cells are attracted by a chemoattractant secreted by the cells. Therefore, Seriniet al. built a the computational model in which cells secrete a chemoattractant to which cells move preferentially. This model produces network-like patterns as shown in Figure 1.2C. Two important pre-dictions are made based on this model. First, the model predicts an optimal cell density for the formation of stable vascular networks and second, the size of the meshes in the network depend on the diffusivity and decay rate of the chemoattractant.
The mechanical and chemical hypotheses for vascular network formation have also been combined in one mechanochemical model [37]. This contin-uum model hypothesizes that network formation consists of two stages. First, cells move upwards chemical gradients. Second, at higher local cell density, the cells do not sense the gradient, but the high cell density signals them to start remodeling the matrix. This then attracts cells to the high density regions. The mechanochemical model showed that these assumptions in-deed lead to network formation and that chemotaxis drives the formation of networks while mechanical interactions stabilize the formed network. How-ever, the mechanochemical model cannot reproduce all observations from both the chemical and mechanical angiogenesis models. Therefore, a more detailed description of the matrix mechanics is required that also influences early cell migration.
Clearly, multiple hypotheses can be used to explain the experimentally ob-served network formation. Moreover, model observations and predictions for both the mechanical and the chemotaxis model could be reproducedin vitro
mecha-1.2. Computational models of angiogenesis
nisms are involved in angiogenesis in different environments, or that the two mechanism act consecutive or simultaneously during angiogenesis.
The models discussed so far use a continuum description for both cells and mechanical or chemical fields, meaning that cells and fields are described as densities. This kind of description is appropriate for mechanical and chemical fields; for example, the concentration of a specific chemical can be measured at a specific position and can have any value. However, generalization of cells into cell densities ignores cell behavior, cell size and shape, and cell-cell interactions, which are often key to morphogenic processes such as an-giogenesis. Therefore, cells should be the basis of an angiogenesis model. Cell-based models incorporate detailed cell-cell interactions as well as cell shape and size, which can also be measured experimentally for quantifica-tion of the parameters and the predicquantifica-tions of the models [9]. Dynamic cell properties and behavior can be added by extending each cell with regulation networks, such as signaling or genetic pathways. Altogether, cell-based mod-els are a solid basis for computational angiogenesis modmod-els that can be used to explain tissue effects at the cell level [16].
Various hypotheses for vascular network formation have been modeled us-ing cell-based models. One of these models is a hybrid cell-based model, using the cellular Potts method (CPM), which is based on the assumption that cells chemotact toward a chemoattractant that they themselves secrete [25– 29]. This assumption is similar to the assumption used for the continuum chemotaxis model [20]. In this cell-based model the cells’ shape, size and membrane surface are described explicitly, and chemicals are described as continuous fields. One of the main advantages of this cell-based model is the more realistic chemotactic response of cells. This cell based model can be used to simulate network formation solely by defining cell behavior and properties. When only autocrine chemotaxis is included, network formation only occurs for narrow parameter ranges: strongly adhering cells or steep chemical gradients [26, 27]. However, three alternative hypotheses are pro-posed that allowed network formation for a much wider range of parameters: contact inhibition [28], cell elongation [25] and ECM-chemoattractant binding [29].
The contact inhibition hypothesis proposes that cells only respond to the autocrine chemoattractants where the cell membrane is not in contact with other cells. This exclusive sensing is thought to be mediated through the dual function of VE-cadherin; it acts as a homophilic trans-membrane cell-adhesion molecule and it plays an inhibitor role in the VEGF signaling pathway [50] which increases cell motility. Therefore, cells that are surrounded by other cells do not respond to VEGF. This process appears to contribute to both network formation (Figure 1.2D) and sprouting angiogenesis. The reasons for this are best understood in the context of sprouting angiogenesis and will
1. Introduction
therefore be discussed in section 1.2.2.
The cell elongation hypothesis is based on the biological observation that cells elongate during network formation. In this model, the combination of elongated cells with autocrine chemotaxis results in network formation [25]. The final network, which can be observed in Figure 1.2E, is similar toin vitro
networks. When cell elongation is omitted, cells aggregate instead of form-ing network, indicatform-ing that cell elongation drives network formation in this model. The evolution of network properties over time, such as the number of nodes and meshes, corresponds with data fromin vitroexperiments with HU-VECs on Matrigel. This suggests that cell elongation may play an important rule during network formation. In this model network formation occurs at two time-scales. First, cell elongation induces a persistent movement along the long axis of the cell. This causes the formation of thin branches of connected cells. Second, the network coarsens by fusion of branches and mesh col-lapse. This is driven by the chemotaxis that enables slow migration of cells along their short axis.
The ECM-chemoattractant binding hypothesis is based on binding of the chemoattractant to the ECM. VEGF is a known chemoattractant for endothe-lial cells and it has heparin binding domains that cause VEGF to bind to the ECM [51]. Köhn-Luqueet al. [29] developed a model based on this hypothe-sis using the CPM. In this model unbound VEGF is produced everywhere and ECM molecules that bind VEGF are produced by cells. Unbound VEGF can bind to the ECM molecules resulting in bound VEGF. When cells respond more to bound VEGF than unbound VEGF, a network forms that is similar to the net-work that develops during the first two ours of HUVECs on Matrigel [52]. In-terestingly, cells in the branches of the network elongate by themselves. This may suggest that cell elongation is a second step in network formation that drives the formation of longer branches and network coarsening.
An alternative hypothesis that is not based on chemotaxis was proposed by Szabóet al. [30, 31, 38]. Their experiments suggested that neither mechani-cal interactions nor chemotaxis are required for network formation [30] and that cells move preferential towards elongated cells. From these observation they propose that network formation is driven by thepreferential attraction
to elongated structures. This hypothesis has been used as a basis for both
1.2. Computational models of angiogenesis
Sprouts formed in these networks only become stable when they connect to other sprouts, suggesting that anastomosis stabilizes the formed network.
Because they all produce similar morphological patterns, none of the mod-eled hypotheses can be ruled out as a driving force for network formation. Cell-based models [25–28] suggest that autocrine chemotaxis, combined with cell properties such as contact inhibition of cell elongation, may drive angio-genesis. Other cell-based angiogenesis models [30, 31, 38] have suggested that chemotaxis may not be necessary at all. Furthermore, mechanical inter-actions between the cells and the matrix may facility network formation. It is likely that each of these mechanisms plays a role in vascular network forma-tion and that it depends on the circumstances which mechanism is dominant.
1.2.2
Sprouting
Sprouting angiogenesis is the formation of new vessels by creating a sprout from the wall of the existing vessel (Figure 1.1). This form of angiogenesis is often observed in the vicinity of hypoxic tissue that secretes angiogenic factors,e.g.,a growing tumor, which activates and attracts endothelial cells from the existing vessels [53]. By stimulating the formation of a new vascula-ture, a tumor is able to grow and proliferate. The mechanisms underlying the dynamics of sprouting angiogenesis are still poorly understood. What mech-anisms guide the growing sprout? How do biochemical and biomechanical interactions of the ECM with cells effect sprouting? Is proliferation required and where is proliferation located in the sprout? How are tip cells selected in the vessel and what causes sprouts to branch? Computational models have contributed to a better understanding of these issues.
Experiments in corneal angiogenesis show that migration of activated en-dothelial cells and initial sprouting precedes stalk cell proliferation [55] and this proliferation is necessary for sprout elongation [56]. These observations indicate that sprouts will not reach the tissue that induced sprouting when en-dothelial cells cells are not able to divide. A continuum model [32] describes the change in cell density over time due to cell migration driven by cell diff u-sion, chemotaxis and haptotaxis. The initial configuration of the simulation consists of a blood vessel at one side and a tumor at the other side of the sim-ulation domain. This tumor secretes a chemoattractant, resulting in a gra-dient of chemoattractant that attracts cells towards the tumor. Haptotaxis is induced by fibronectin that the cells secrete themselves. The highest lev-els of fibronectin are present where the cell density is maximum. Therefore, haptotaxis and chemotaxis work in opposite directions. The continuum model suggests that, in absence of proliferation, the sprouting is restricted. The au-thors propose that this is caused because haptotaxis outweighs chemotaxis and increasing the number of cells would increase the chemotactic response. A drawback of this model is that it describes cells as a density field, hence it
1. Introduction
−2.5 mm 0 2.5 mm
0 2.5 mm
A B
C D
E F
Figure 1.3:Overview of the computational models of angiogenic sprouting.Acorneal
1.2. Computational models of angiogenesis
cannot describe how the sprout breaks up due to lack of proliferation. There-fore, a discrete modeling approach has been introduced to study cell prolif-eration in the sprout [35]. As illustrated in Figure 1.3A, the model mimics a cornea with a lesion in the center from which VEGF is secreted. A sprout grows from the periphery and consist of multiple cell types; one leading tip cell and multiple following stalk cells. The tip cell is attracted by VEGF and therefore migrates towards the center of the cornea. Tip cell migration is limited by the elasticity of the tip cell and the strength of the adhesion between stalk cells. Adding proliferation enables unlimited sprout extension. This model suggests that basic cell properties can explain the need for proliferation in sprouting.
The previous two sprouting models only considered cell behavior and chem-ical fields, ignoring all ECM and stromal tissue. Anderson and coworkers [54] created a particle based, hybrid model describing sprouting angiogen-esis. In this model cells are represented as point particles on a grid while the chemotactic and haptotactic fields are still described as continuum equa-tions. This model was used to investigate how the balance of haptotaxis and chemotaxis influences branching and anastomosis. As shown in Figure 1.3B branching and anastomosis occur in the model, but these behaviors only oc-cur when cells are able to move perpendicular to the chemotactic field, which is enabled by haptotaxis. When the haptotactic forces are strong enough branches can split and reconnect in order to form a functional vasculature.
Andersonet al.’s model [54] suggests that haptotaxis is key to branching, but it did not show how cells interact with their heterogeneous environment. A more recent, cell-based, model represents the ECM as a static, heteroge-neous configuration of matrix fiber bundles, interstitial fluid and immobile tissue-specific cells [34]. The endothelial cells in the model are motile and ad-here stronger to matrix fibers than to the surrounding matrix. Immobile cells act as obstacles that hinder the migration of endothelial cells. The tip cell is influenced by a chemoattractant field and it degrades ECM components. Degradation of the extracellular matrix during sprouting enables cells to mi-grate and branch offthe main sprout as shown in Figure 1.3D. The model suggests that a heterogeneous composition of the matrix is necessary for the formation of branches; the inhomogeneities in the matrix enable cells to split from the main branch. Furthermore, the model suggests that the pro-liferation region determines sprouting dynamics but does not affect the final sprout morphology.
A follow-up model was used to investigate cell-ECM interaction in more de-tail [33]. In this model all cells respond to the chemoattractant and that the immobile tissue cells are removed,i.e., only fibers cause matrix heterogene-ity. The model suggests that sprouting only occurs in a specific range of ma-trix densities, which corresponds with experimental observations. Moreover, simulation results suggest that low fiber density results in cell elongation.
1. Introduction
Similar changes were observed when the random fibers were replaced by a specific fiber pattern, for example long fibers cause cells to elongate in the same direction as the fibers. The authors propose that contact guidance, due to cell-matrix interactions, is key to role in vascular sprouting because it enables sprout branching in an inhomogeneous matrix.
All of the discussed models assumed an external source that induces sprout-ing. In contrast, both Szabóet al. [38] and Merkset al. [28] have proposed that cells can form sprouts in absence of external signals and in a homogeneous matrix. They supported their hypothesis with cell-based models that describe cell shape, cell membrane and cell migration in much more detail than the models discussed before.
The model by Szabóet al. [38] incorporates preferential attraction to elon-gated structures, cell polarity and self-propulsion (i.e. persistence of motion). The model also differentiates between tip and stalk cells. The tip cell is polar-ized, causing directed movement in the direction of the polarization vector. The results shown in Figure 1.3Csuggest that both preferential attraction and self-propulsion are necessary to reproduce realistic sprouting behavior. Cell polarization may be regulated by cell-cell contacts and VE-cadherin may be a key player for this. Moreover, the model suggest that differential behav-ior at the sprout tip may drive sprout formation.
In contrast, Merks suggested that sprouting can occur in absence of matrix heterogeneity or differential cell behavior [28] ( 1.3E). The model assumes cells are attracted towards an autocrine chemoattractant, using similar rules as in chemotaxis-based network model (section 1.2.1). Contact inhibition me-diated by VE-cadherin causes cells to be only sensitive to the chemoattrac-tant at positions of the cell membrane adjacent to the ECM. Sprouting occurs in two ways. First, when cells are arranged in an aggregate, only the outer layer of cells sense the chemoattractant. These cells tend to migrate to-wards the center of the aggregate causing a buckling instability that induces sprouting. This effect enables cells, even those with a low motility, to move against the chemotactic gradient. Second, another mechanism may explain sprouting for highly motile cells. To move away from the parent vessel and form a sprout, cells must migrateagainst a steep gradient of self-secreted chemoattractant. Once a small sprout is created by a motile cell, the gradi-ent around this outgrowth is less steep than the rest of the gradigradi-ent, so cells within the sprout have higher motility than elsewhere, causing an instability.
1.2. Computational models of angiogenesis
cell fate is induced by VEGF and regulated by lateral inhibition of tip cell fate via Dll4-Notch signaling. When a cell becomes a tip cell, it starts extending long filopodia away from the blood vessel (Figure 1.3F). Based on this model Bentley et al. proposed that the balance between VEGF signaling and Dll4-Notch determines the transition from normal to abnormal sprouting [41, 42]. An extension of the same model was used to study tip cell competition in an-giogenic sprouts. Time-lapse microscopy has shown how stalk cells migrate along the sprout and compete with the leading tip cell [17]. Cells that are treated such that they express higher levels of the VEGF receptor VEGFR2 are found more often at the sprout tip than wild-type cells. Blockage of Notch signaling neutralized this effect. Based on these observations Jakobssonet al. [17] proposed that tip cell compete for the tip position and that this is controlled by both VEGF signaling and Dll4-Notch signaling. In the compu-tational model this hypothesis reproduced tip cell shuffling, suggesting that this mechanism may explain tip cell shuffling.
1.2.3
Predictive angiogenesis models
The models discussed so far, all isolated specific aspects of angiogenesis. To build predictive models ofin vivo angiogenesis, we must incorporate the in-teractions with the rest of the body in a multi-scale model. Angiogenesis is induced by hypoxic tissue which, for example, can be a tumor or an active muscle. The change in oxygen and nutrient supply due to the new vascula-ture changes the signals coming from the tissue, resulting in a dynamic feed-back loop between angiogenesis and the needs of the tissue. Also blood flow may be key to this feedback. Dysfunctional vessels are not able to support blood flow and do not contribute to the perfusion of the tissue. Endothelial cells change their behavior due to the shear stresses induced by blood flow [64]. The inclusion of these processes in a multi-scale angiogenesis model would be a great tool to study pathological processes either involve exces-sive or insufficient blood vessel growth. Such multi-scale models can be used to formalize and validate hypotheses, and to predict the effects of pro- or anti-angiogenic therapies on the vasculature and the other tissues involved.
In order to build these multi-scale models, researchers often extend existing models. For example, the particle-based sprouting model by Andersonet al. [54] has been extended with blood flow [65]. This model suggested that most vessels are not perfused due to the lack of anastomosis, and thus drugs can not reach the target. More complex approaches have been used to combine more detailed angiogenesis models with blood flow and the kinetics of oxygen and VEGF [44, 66, 67]. With these models vascularization in a heterogeneous ECM [44] and in skeletal muscle [43] has been simulated.
Also, cell-based models have been extended to include multiple tissues. Shi-rinifardet al. [68] combined cell-based models of blood vessel formation and
1. Introduction
tumor growth to investigate how tumor growth and vascular remodeling in-teract. In this model the tumor induces angiogenesis in a peripheral vascula-ture. The new blood vessels supply the tumor with oxygen and growth factors and thereby affect the tumor development. Another example of a multi-scale, cell-based model was presented by Kleinstreueret al. [40]. They modeled vasculogenesis including several types of cells and proteins in order to test the effects of various toxins on vascular development. For this they classi-fied the effects of the toxins on the behavior of a single cell and included this in the model. The model was able reproduce the pattern formed in HUVEC cultures treated with various toxins, showing that this approach is useful to further study the effects of toxins on vascular development.
These first approaches on multi-scale, cell-based modeling of blood vessel formation indicate that this is a suitable approach for predictive modeling. However, extra steps, such as including mechanical interactions with the ECM and blood flow, subcellular signaling, and interactions between endothelial cells, perivascular and stromal cells, should be included to create reliable, predictive models of angiogenesis. Before, such effects can be included, they should be studied thoroughly in more simple, cell-based models.
1.3
Thesis outline
In this thesis we focus on the role of specialized cells in angiogenesis. This includes cells with distinctive behaviors, such as elongated cells, or cells with a specific role, such as tip cells or pericytes. These specialized cells are ob-servedin vivo[15, 69–71], butin vitroblood vessel formation there specific properties are dispensable. Therefore, we aim to better understand the role of these specialized cell types in blood vessel formation. For this we use sim-ple, cell-based models of vascular network formation, either via sprouting angiogenesis or vasculogenesis. In these models we focus on the cell scale and therefore we do not include the cause of the cell behaviors in the models or incorporate any high-level rules. Furthermore, we assume that the envi-ronment of the cells does not provide any structural, mechanical or chemical guidance to the cells. In this manner we build models in which we isolate cell behavior, similar to what happens in variousin vitromodels of blood vessel formation.
behav-1.3. Thesis outline
iors with cell-based models, large parameter sweeps were necessary. Unlike classic methods, such as PDE models, no standard methods are available for this. Therefore, in chapter 5, we present a protocol for setting up, running and analyzing large scale parameter sweeps with cell-based models. In chapter 5 we demonstrate how this protocol was used to obtain the results presented in chapter 2. Furthermore, we show how the method can be applied to an alternative cell-based model.
In chapter 2 we further analyze the formation of blood vessels by elongated cells. Previously, it was shown that elongated cells form networks [25], but the precise mechanisms by which elongated form networks remained un-clear. To better understand how elongated cells form networks, we quan-tify the alignment of cells during network formation and show that elongated cells align over time. Using these analyses we show that elongated cells align and that due to this alignment the rotation of the cells becomes limited. As a result the cells form a network-like structure that is in a state of dynamic arrest.
In chapters 3 and 4 we study how mixing of specialized cells,i.e. cells with different behaviors, affects vascular network formation. In chapter 3 we study how pericytes, a kind of perivascular cell, affect vasculogenesis. For this we combinedin vitro experiments with a cell-based, computational model. With our model we studied which interactions between endothelial cells and peri-cytes could be responsible for the patterns observedin vitro. In this manner we showed that during blood vessel formation pericytes and endothelial cells may attract each other by diffusing chemoattractants. In chapter 4 we used our computational modeling approach to gain new insights in the molecular and behavioral differences between tip cells and stalk cells. With a large pa-rameter sweep we searched for those cell behaviors that could make tip cells lead and affect network formation. In this manner we found that tip cells that respond less to an autocrine chemoattractant lead sprouts and affect net-work formation. This result seemed to contradict with the literature because tip cells are described as highly motile cells that respond more to chemo-attractants. However, the chemoattractants to which tip cells are reported to respond more are chemoattractants secreted by hypoxic tissues, while in our model the chemoattractant is secreted by the endothelial cells. Furthermore, a literature study of tip cell gene expression in tip and stalk cells indicated that tip cells do not express the receptor for the endothelial cell chemoat-tractant Apelin. Blocking Apelin signaling inin vitrosprouting assays reduces sprouting, but only when tip cells were present in the spheroids. This support the hypothesis that the differential response of tip and stalk cells to Apelin could cause tip cells to lead sprouts.
2
Vascular networks due to dynamically
arrested crystalline ordering
of elongated cells
This chapter is published as:
Margriet M. Palm and Roeland M.H. Merks, Vascular networks due to dynamically arrested crystalline ordering of elongated
cells, Physical Review E, Volume 87(1), 2013
2. Vascular networks duo to ordering of elongated cells
Abstract
Recent experimental and theoretical studies suggest that crystalliza-tion and glass-like solidificacrystalliza-tion are useful analogies for understanding cell ordering in confluent biological tissues. It remains unexplored how cellular ordering contributes to pattern formation during morphogene-sis. With a computational model we show that a system of elongated, cohering biological cells can get dynamically arrested in a network pat-tern. Our model provides a new explanation for the formation of cellu-lar networks in culture systems that exclude intercellucellu-lar interaction via chemotaxis or mechanical traction.
2.1
Introduction
By aligning locally with one another, cells of elongated shape form ordered, crystalline configurations in cell cultures of, e.g. fibroblasts [72, 73], mes-enchymal stem cells [73], and endothelial cells [74]. Initially the cells form small clusters of aligned cells; the clusters then grow and the range over which cells align increases with time [73, 75]. To study the emergence of such crystalline cellular ordering, it is useful to make an analogy with liquid crys-tals [73]. For example, a “cellular temperature” can be defined to describe the cell-type specific persistence (low cellular temperature) or randomness (high cellular temperature) of cell motility, where cells of high cellular temperature
(e.g., fibroblasts) are less likely to form crystalline configurations than cells
of low temperature (e.g., mesenchymal stem cells) [73]. It was similarly pro-posed that collective cell motion in crowded cell sheets can be understood as system approaching a glass transition [76, 77]. Although these studies provide useful insights into the ordering of cells in confluent cell layers, it re-mains unexplored how crystallization and glass-like dynamics contribute to the formation of more complex shapes and patterns during biological mor-phogenesis.
sec-2.2. Model description
ond class of explanations proposed that cells form networks by adhering bet-ter to locally elongated configurations of cells [30] or elongated cells [31]. Here we show that, in absence of mechanical or chemical fields such mech-anisms are unnecessary: elongated cells organize into network structures if they move and rotate randomly, and adhere to adjacent cells. As the cells align locally with one another, a network pattern appears. Additional, long-range cell-cell attraction mechanisms, e.g., chemotaxis or mechanotaxis, act to stabilize the pattern and fix its wave length.
round - chemotaxis long - chemotaxis long - no chemotaxis
A B C
Figure 2.1:Effect of chemotaxis and cell shape on pattern formation. A round,
chemotacting, and adhesive cells (10,000 MCS),Belongated, chemotact-ing and adhesive cells (10,000 MCS), andCelongated, non-chemotacting and adhesive cells (250,000 MCS). In all panels 700 cells are seeded on the center 500x500 pixels of an 800x800 lattice.
2.2
Model description
To model the collective movement of elongated cells, we use the cellular Potts method (CPM), also known as the Glazier-Graner-Hogeweg model [84, 85], a lattice-based, Monte-Carlo model that has been used to model develop-mental mechanisms including somitogenesis [86, 87], convergent extension [88] and fruit fly retinal patterning [89]. The CPM represents cells as con-nected patches of lattice sites with identical spinσ∈N; lattice sites with spin σ = 0 represent the extracellular matrix (ECM). To simulate stochastic cell motility, the CPM iteratively displaces cell-cell and cell-ECM boundaries by attempting to copy the spin of a randomly selected site into a randomly se-lected adjacent lattice site~x, monitoring the resulting change∆Hof a Hamil-tonian,
H=X
(~x,~x0)
J(σ(~x),σ(~x0)) (1−δ(σ(~x),σ(~x0)))+X σ
λA(a(σ)−A)
2
+X
σ
λL(l(σ)−L)
2 .
2. Vascular networks duo to ordering of elongated cells
A copy attempt will always be accepted if∆H≤0, if∆H>0a copy attempt is accepted with the Boltzmann probabilityP(∆H) = exp(−∆H/µ(σ)), with
µ(σ)a “cellular temperature” to simulate cell-autonomous random motility. For simplicity, we here assume that all cells have identical temperatureµ. The time unit is a Monte Carlo step (MCS), which corresponds with as many copy attempts as there are lattice sites.
The first term of Equation 2.2 defines an adhesion energy, with(~x,~x0)a pair of adjacent lattice sites and the Kronecker delta returning a value of 1 for pairs at cell-cell and cell-ECM interfaces, or zero otherwise. In the model two contact energies are defined: Jcell,cellforσ >0at both lattice sites, and
Jcell,ECMforσ= 0at one lattice site. The second and third term are shape con-straints that penalize deviations from a target shape, withAandLa target area and length, anda(σ)andl(σ)the current area and length of the cell;λA andλLare shape parameters. We efficiently estimatel(σ)by keeping track of a cellular inertia tensor as previously described [25].
In a subset of simulations, we further assume that cells secrete a diffusing chemoattractantc, which we describe with a partial differential equation:
∂c(~x,t)
∂t =D∇
2c(~x,t) +s(1−δ(σ(~x), 0))− δ(σ(~x), 0)),
with diffusion constantD, secretion ratesand decay rate. After each MCS, a forward Euler method solves Equation 2.2 for 15 steps with∆t = 2s and zero boundary conditions. To model the cells’ chemotaxis up concentration gradients of the chemoattractant, during each copy attempt from~x tox~0we increase∆H with a ∆Hchemotaxis = λc(c(~x)−c(~x0)), with λc a chemotactic sensitivity [90].
We use the following parameter settings, unless specified otherwise:µ= 1,
Jcell,cell = .5,Jcell,ECM= .35, λA = 1,λL = .1; λc = 10,A = 100l.u.2,L = 60
l.u.; D = 10−13 m2s−1, = 1.8·10−4 s−1, s = 1.8·10−4 s−1; where l.u.
denotes a lattice unit which corresponds with2 µm. Adjacent lattice sites
~x0are defined as the eight nearest neighbors of lattice site~x. Unless stated otherwise, a simulation is initialized with 175 cells randomly distributed on a 220x220 area at the center of a 400x400 lattice.
2.3
Results
2.3. Results
gradual alignment of cells with their neighbors is key to network formation and network evolution. To characterize this cell alignment, we defineθ(~x,r)
as the angle between the direction of the long axis~v(σ(~x))of the cell at~x, and a local director~n(~x,r), a weighted local average of cell orientations defined at radiusr around~x:
~n(~x,r) =h~v(σ(~y))i{~y∈
Z2:|~x−~y|<r}.
Figure 2.2AandBdepict the value ofθ(~x, 3)for simulations without chemo-taxis (Figure 2.2A) and with chemochemo-taxis (Figure 2.2B), with dark gray values indicating values ofθ(~x, 3)→π/2. Network branches are separated by large values ofθ(~x, 3), indicating that within branches cells are aligned, whereas branch points are “lattice defects” in which cells with different orientations meet.
Supplemental Movies S3 and S4 (θ(~x, 3)) show how the cells align gradually over time in the absence and presence of chemotaxis. To characterize the temporal development of cell alignment in more detail, we use an orienta-tional order parameter [91]:
S(r) =Dcos(2θ(X~(σ),r))E σ
withX~(σ)the center of mass of cellσ.Sranges from 0 for randomly oriented cells to 1 for cells oriented in parallel.
Figure 2.2C shows the evolution of the global orientational order param-eterlimr→∞S(r)and of the local orientational order parametersS(20)and
S(40). Both with chemotaxis (dashed lines) and without (solid lines), S(20)
grows more quickly and reaches higher ordering thanS(40). The reason for this is that in cells of length 50−60 l.u., S(20)(covering cells up to a ra-diusr = 20from the cell’s center of mass) only detects lateral alignment of cells, whereas a radiusS(40)also detects linear line-up of cells (Figure 2.2D). Thus cell-cell adhesion of long cells quickly aligns cells with the left and right neighbors, while it aligns them more slowly with those in front and behind. This results in networks with short branches of aligned cells. Interestingly, chemotaxis aligns cells more rapidly, both along the short and long sides of cells, resulting in networks with much longer branches than with adhesion alone.
Next we analyze the mechanisms that drive the orientational ordering in the cell networks. Visual inspection of the simulation movies suggests that sin-gle cells move and rotate much more rapidly than locally aligned clusters of cells. A network of locally aligned cells forms rapidly from initially dispersed cells. Merging of branches seems to be a much slower process, and poten-tially prevents a further evolution to global nematic order. To quantify these observations we measured the translational and rotational diffusion coeffi -cients of cells as a function of the size of the network branch to which it
2. Vascular networks duo to ordering of elongated cells
r = 40 r = 20
or
der
pa
ram
eter
(S)
-0.2 0 0.2 0.4 0.6 0.8 1
time (MCS)
r = 20 r = 40
global
chemotaxis no chemotaxis
A B
C D
no chemotaxis chemotaxis
Figure 2.2:Crystalline cell ordering during network formation. A-Bθ(~x,r)withr = 3
for a simulation with chemotaxis (A) and without chemotaxis (B) after 25,000 MCS.CTemporal evolution of orientational order parameterS(r)
forr= 20(black curves),r= 40(gray curves) andr→ ∞(light gray) with-out chemotaxis (solid) and with chemotaxis (dashed). Order parameter is averaged over 10 simulation repeats (gray shadows represent standard deviation).Dcells included in the order parameter withr= 20andr= 40.
belongs. We loosely define a network branch, orclusterof aligned cells as a connected set of at least two cells with relative orientations< 5◦,i.e., in Figure 2.2AandBdark gray values separate the clusters. To detect clusters computationally, we first identify the connected sets for whichθ(~x, 3) ≤ 5◦, which are surrounded by lattice sites ofσ = 0or sites withθ(~x, 3) >5◦. We then eliminate connected sets of fewer than fifty lattice sites. The CPM cells sharing at least 50% of their lattice sites with one of the remaining sets form a cluster. The translational diffusion coefficient,Dt, derives from the mean square displacement (MSD) of a set of cells:
D
|X~(σ,t)−X~(σ, 0)|2E σ
= 4Dtt.
2.3. Results
2 3 4 5 6
0 5 10 15 20 25 30 35 cluster size [cells] 6
7 8 9 10
0 5 10 15 20 25 30 35 cluster size [cells]
A B
Figure 2.3:Relation between cluster size and cell displacement. Clusters are
calcu-lated for each morphology between 500 and 25,0000 MCS (100 simulation repeats), with an interval of 500 MCS; see text for details. The error bars represent the standard error of the linear fits used to estimate diffusion coefficients.
rotation (MSR) of a set of cells:
h(α(σ,t)−α(σ, 0))2iσ = 2Drt,
withα(σ,t)−α(σ, 0)the angular displacement of a cell between time 0 and
t. During a simulation, cells may move between clusters, and clusters can merge. Therefore, to calculateDtandDrof cells as a function of cluster size, for 100 simulations of 250,000 MCS we measured trajectories of each indi-vidual cell with one data point per 500 MCS, and kept track of the size of the cluster it was classified into at each time point. We defined cluster size bins, with the first bin collecting all clusters consisting of two to five cells, and the next bins running from 6 to 10, 11 to 15,etc. We split up the trajectories into chunks of 10 consecutive data points, during which the cells stayed within clusters belonging to one bin. To calculateDtandDrwe performed a least square fitting on the binned MSD and MSR values for these trajectory chunks. The translational diffusion, Dt, increases slightly with cluster size (Figure 2.3A). This may reflect that the probability of hopping between small clusters will be larger than the probability of hopping between larger clusters, result-ing in an overrepresentation of slow cells in the small clusters. Interestresult-ingly, the rotational diffusion Dr drops with the cluster size (Figure 2.3B), indicat-ing that cells in large clusters rotate more slowly. These results suggest that the rotation of cells in big clusters is limited, which reduces the probability that two clusters rotate and merge into a single larger cluster. Therefore, if the size of clusters increases, their rotation speeds drop as does the prob-ability of cluster fusion. Thus, although further alignment of clusters would reduce the pattern energyH(Equation 2.2), the pattern evolution essentially freezes.
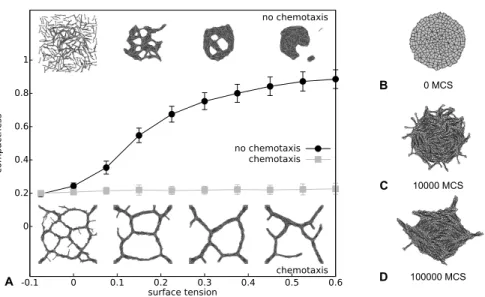
To corroborate our hypothesis that network patterns are transient patterns that increasingly slowly evolve towards nematic order, we looked for model parameters that could speed up pattern evolution. Figure 2.4Ashows the
2. Vascular networks duo to ordering of elongated cells
0 0.2 0.4 0.6 0.8 1
-0.1 0 0.1 0.2 0.3 0.4 0.5 0.6
co
m
pac
tn
ess
surface tension
no chemotaxis chemotaxis
0 MCS
10000 MCS
100000 MCS
chemotaxis no chemotaxis
A
B
C
D
Figure 2.4: ARelation between compactness and surface tension, with and without
chemotaxis. The compactness was calculated at 100,000 MCS and aver-aged over 100 simulations (error bars represent standard deviation). Sim-ulations were initialized with 350 cells on 260x260 path on the center of a 420x420 lattice.B-Devolution of a simulation initialized with a 128-cell blob on the center of a 420x420 grid.
fect of surface tension (γcell,ECM) on the ability of cells to form networks after 100,000 MCS, as expressed by the configuration’scompactness C = Acells
Ahull,
where Ahull is the area of the convex hull of the largest connected group of cells, andAcellsis the summed area of the cells inside the hull. A value of C → 1 indicates a spheroid of cells, where for networks C would tend to zero. For values ofγcell,ECM = Jcell,ECM−
Jcell,cell
2 > 0, the equilibrium
2.4. Discussion
2.4
Discussion
Our analysis suggests that in the cellular Potts model elongated, adhesive cells can form networks in a parameter regime where a spheroid pattern is the minimal energy state. The cells initially align with nearby cells, thus forming the branches of the network. In order for the pattern to evolve fur-ther towards the minimal-energy spheroid pattern, the locally aligned clus-ters of cells must join adjacent branches, for which they must move and ro-tate. Our analysis of the rotational and translational diffusion of cells in Fig-ure 2.3 shows that this becomes more difficult for cells belonging to larger clusters. Thus the networks evolve ever more slowly to the minimal energy state, and gets dynamically arrested in a network-like configuration, a phe-nomenon reminiscent of the glass transition, as e.g. observed in attractive colloid systems [92], collective cell migration of biological cellsin vitro[76, 77], and colloid rod suspensions [93] in which gels can form from clusters of parallel rods [94–96].
Figure 2.4A suggests that the cellular Potts simulations undergo a glass transition as the surface tension drops: for high surface tension the system evolves towards equilibrium, for lower surface tensions the system becomes jammed in a network-like state. Thus our model provides a new explanation for the formation of vascular networks in absence of chemical or mechanical, long-range, intercellular attraction [30]. Interestingly, intercellular attraction via chemotaxis stabilizes the formation of networks in our simulations [25] and can drive sprouting from spheroids (not shown). This suggests that net-works are an equilibrium pattern of our system in presence of intercellular attraction. Nevertheless the present analysis of arrested dynamics provides new insight into the system with intercellular attraction: chemotaxis rein-forces local ordering over a distance proportional to the diffusion length of the chemoattractant producing networks of a scale independent of surface tension [25].
2.A
Supplementary movies
An archive containing all supplementary movies can be found at
http://persistent-identifier.org/?identifier=urn:nbn:nl:ui:18-22535.
Movie S1 Network formation with elongated cells that chemotact towards a
chemoattractant they secrete themselves. This simulation was per-formed with 700 cells on a 800x800 lattice and ran for 10,000 MCS.
Movie S2 Network formation with elongation cells that do not chemotact. This
simulation was performed with 700 cells on a 800x800 lattice and ran for 250,000 MCS.
Movie S3 Evolution of the alignment of elongated cells that chemotact
2. Vascular networks duo to ordering of elongated cells
wards a chemoattractant they secrete themselves. This simula-tion was performed with 175 cells on a 400x400 lattice and ran for 25,000 MCS.
Movie S4 Evolution of the alignment of elongated cells that do not
chemo-tact. This simulation was performed with 175 cells on a 400x400 lattice and ran for 25,000 MCS.
Movie S5 Pattern formation with adhesive, elongated cells, without
3
Di
ff
usive signaling between endothelial
cells and pericytes can cause network
collapse and subsequent sprouting
This chapter is based on:
Margriet M. Palm, Henri H. Versteeg and Roeland M.H. Merks,
Diffusive signaling between endothelial cells and pericytes can
cause network collapse and subsequent sprouting
(in preparation)
3. Endothelial cell and pericyte interactions in angiogenesis
Abstract
Pericytes are perivascular cells that are responsible for the stabiliza-tion of small blood vessels. However, in certainin vivosystems; such as the mouse retina, central nervous system and tumors; pericytes are ob-served in developing blood vessels. This suggest that pericytes can also play an active role in angiogenesis. How pericytes and endothelial cells interact during angiogenesis remains unclear. Therefore, we combinedin vitrovasculogenesis assays with computational modeling to study how pericytes affect endothelial cells and vice versa. With the experiments we can find what patterns endothelial cells and pericytes form together. Then, by varying the interactions between endothelial cells and pericytes included in the model, we can test which interactions could causein vitro
patterns.
In the vasculogenesis assay endothelial cells and pericytes initially formed a network. This network quickly collapsed into a blob from which new sprouts extended. In our model we can reproduce the network col-lapse when endothelial cells attract pericytes and vice versa via chemo-taxis. Furthermore, when the chemoattractant for endothelial cells is secreted by endothelial cells adjacent to pericytes instead of pericytes, sprouts extend from the blobs. Thus, our study suggests that during an-giogenesis endothelial cells and pericytes attract each other via secreted chemoattractants, and pericytes may regulate the chemoattractant se-cretion of endothelial cells.
3.1
Introduction
pericyte lumen
endothelial cell basement membrane
Figure 3.1:Schematic cross section of a small blood vessel.
3.1. Introduction
view that pericytes are recruited to established vessels where they stabilize the vasculature. In the mouse retina and central nervous system, pericytes are integrated into the developing vessels [69, 70] and in tumor angiogene-sis pericytes can lead sprouts [71], suggesting that pericytes interact actively with endothelial cells during blood vessel formation. However, most research focused on the role of pericytes in vessel stabilization and therefore the pre-cise role of pericytes in blood vessel formation remains unclear. To clarify the role of pericytes in blood vessel formation we study how pericytes and endothelial cells interact. For this we combinein vitroexperiments and com-putational modeling. By attempting to reproduce the patterns formedin vitro
with a computational model we can reconstruct which cell behaviors could cause those patterns.
Pericytes and endothelial cells can signal over long distances via diffusive ligands, such as transforming growth factor-β(TGFβ), platelet-derived growth factor B (PDGFB), angiopoietin-1 (Ang-1), and vascular endothelial growth factor (VEGF). Juxtacrine signaling, via membrane-bound ligands and recep-tors, occurs for example via N-cadherin, and Jagged1 and Notch3 [97, 98, 102]. Endothelial-pericyte signaling regulates the behavior of pericytes and endothelial cells, the differentiation of pericytes and pericyte progenitors, and the maturation and stabilization of blood vessels. Because we are study-ing how endothelial cells and pericytes interact while formstudy-ing blood vessels, we only consider the interactions that affect the migration of endothelial cells or pericytes and exclude interactions that only affect pericyte differentiation or vessel stabilization. Both the juxtacrine signaling pathways listed above are involved in vessel maturation and do not affect cell migration. This leaves the four diffusive ligands, which all affect endothelial cell or pericyte migra-tion, as sources of endothelial-pericyte interactions. TGFβis secreted by both pericytes and endothelial cells [103–105] in a latent form that must be chem-ically modified to become active [106]. This activation does not occur in peri-cyte or endothelial cell monocultures, but in endothelial-periperi-cyte cocultures TGFβis activated via an unknown mechanism [103–105]. In endothelial cells TGFβregulates cell migration via activin receptor-like kinase (Alk)-1 and Alk-5 [98]. Alk-1 signaling promotes proliferation and migration while Alk-5 signal-ing inhibits these processes [107–109]. Because of the oppossignal-ing effects of Alk-1 and Alk-5 signaling, the exact effect of TGFβ signaling on endothelial cell behavior remains unclear. In pericytes TGFβsignaling induces diff erenti-ation to vascular smooth muscle cells [110]. PDGFB is secreted by endothelial cells [111, 112] and is sensed by pericytes via PDGF receptor-beta (PDFGRβ) [111]. PDGFB-PDGFRβ signaling induces chemotaxis in pericytes [113] and thereby endothelial cells can attract pericytes. Ang-1 is secreted by pericytes and is sensed by endothelial cells via the receptor TIE2 [98]. This signaling induces chemotaxis in endothelial cells [114] and thereby causes pericytes
3. Endothelial cell and pericyte interactions in angiogenesis
to attract endothelial cells. VEGF is sensed by endothelial cells via VEGF re-ceptor 2 (VEGFR2) [115], which induces chemotaxis and promotes endothelial cell survival [116]. VEGF is suggested to play a role in endothelial-pericyte in-teractions because several studies showed that pericytes cocultured with en-dothelial cells secrete VEGF [117, 118]. However an alternative mechanism is suggested by Francoet al.[119] who showed that endothelial cells in contact with pericytes secrete VEGF. Francoet al.[119] proposed that VEGF secretion by endothelial cells is induced by the activation of membrane bound inte-grinαVon endothelial cells by vitronectin that is secreted by pericytes. Thus, VEGF signaling attracts endothelial cells to pericytes, or to endothelial cells that are close to pericytes. Altogether, except for TGFβ, all diffusive ligands involved in endothelial-pericyte signaling induce chemotaxis in pericytes or endothelial cells.
Overall, based on the literature we propose that attraction via diffusive, se-creted, ligands is a major mode of endothelial-pericyte interaction. Endothe-lial cells are known to secrete chemoattractants that attract pericytes, such as PDGFB, and pericytes secrete chemoattractants for endothelial cells, such as VEGF, Ang-1, and TGFβ. VEGF may be secreted by endothelial cells, in close vicinity of pericytes, instead of by pericytes. Thus, exactly via which chemoattractants pericyte and endothelial cells interact, and which cells se-crete which chemoattractant remains unclear. Therefore, in this study we will use a computational model to find if attraction via chemotaxis between peri-cytes and endothelial cells plays a role during angiogenesis, and if so, which chemoattractant should be secreted by which cells. For this we first study pat-tern formation of endothelial cells and pericytes with vasculogenesis assays. Then, we try to reproduce these patterns with our computational, cell-based model. In such a model we can study how changes in cell behavior, such as chemotaxis and chemoattractant secretion, and the chemical properties of chemoattractants affect pattern formation. Thus, with our model we can search for the chemotaxis scenario that could cause thein vitropatterning.
3.2
Results
peri-3.2. Results
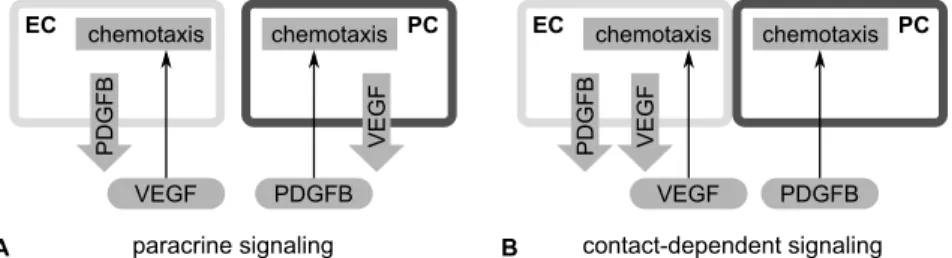
cytes and endothelial cells is chosen such that simulations with a single cell type correspond with the correspondingin vitromonocultures. Then, we used the model to study which endothelial-pericyte interactions may contribute to the patterns we observed in thein vitro endothelial-pericyte coculture. For this we assumed that endothelial cells and pericytes interact by secreting chemoattractants. For simplicity, we refer to the chemoattractant that en-dothelial cells secrete for pericytes as PDGFB, and we refer to the chemoat-tractant that pericytes secrete for endothelial cells as VEGF. However, these chemoattractants represent generic chemoattractants and therefore we did not use PDGFB and VEGF specific model parameters. For VEGF, it is debated whether it is secreted by pericytes [117, 118], or by endothelial cells that con-tact pericytes [119]. With a computational model we can simulate the tissues that develop based on each of these scenarios. For this, we set up two sce-narios for endothelial-pericyte signaling: paracrine signaling, and
contact-dependent signaling. In the paracrine signaling scenario, endothelial cells
secrete a chemoattractant for pericytes and vice versa (Figure 3.2A). In the contact-dependent signaling scenario, we assumed that contact with peri-cytes induces VEGF secretion in endothelial cells [119]. Therefore, in this scenario PDGFB is secreted by all endothelial cells and VEGF is secreted by endothelial cells that are in contact with pericytes (Figure 3.2B).
chemotaxis
chemotaxis PC
EC
V
E
G
F
P
DGFB
VEGF PDGFB
chemotaxis
chemotaxis PC
EC
P
DGFB VEG
F
VEGF PDGFB
A paracrine signaling B contact-dependent signaling
Figure 3.2:Alternative scenarios for endothelial-pericyte signaling.
3.2.1
In vitro
patterning
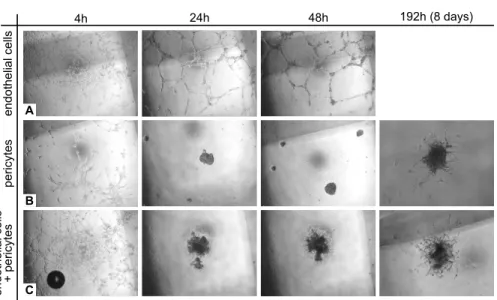
We started with thein vitroexperiments to elucidate what patterns form when endothelial cells and pericytes are seeded together. For this we seeded en-dothelial cells and pericytes, at a 2:1 ratio, and followed the pattern evolu-tion. As a reference, we repeated the experiments with only endothelial cells, or only pericytes.
Figure 3.3 shows how the patterns evolved in each of the three assays. In the endothelial cell monoculture (Figure 3.3A) a network with long branches formed quickly. Between the second and eighth day the network disintegrated because the endothelial cells died. In the pericyte monoculture (Figure 3.3B)
3. Endothelial cell and pericyte interactions in angiogenesis
en
do
th
el
ia
l cel
ls
4h 24h 48h 192h (8 days)
pe
ricytes
A
B
C
en
do
th
el
ia
l cel
ls
+ per
icyt
es
Figure 3.3:Pattern formation in vasculogenesis assays with endothelial cells (A),
pe-ricytes (B), or endothelial cells and pericytes at a ratio of 2:1 (C).
initially some branched structures formed that quickly collapsed into a blob. After eight days some sprouts extended from this blob. In the endothelial-pe-ricyte coculture (Figure 3.3C) a network developed quickly. Within 24 hours, the network collapsed into a blob and later on sprouts extended from the blob. Comparing the evolution of a blob with only pericytes (Figure 3.3B) with that of a blob with pericytes and endothelial cells (Figure 3.3C) suggests that endothelial cells caused the sprouts to extend earlier and become longer. However, we currently lack quantitative data to support this conclusion.
Altogether, in all cultures networks formed quickly. However, when pericytes are present, the network collapsed to form a blob. Over time, sprouts ex-tended from this blob, which seemed to be more numerous in the endothelial-pericyte coculture. These observations indicate that endothelial-pericytes induce net-work collapse, and that endothelial cells may promote sprout formation from the cell blobs.

![Figure 1.3: Overview of the computational models of angiogenic sprouting. A corneal angiogenesis as modeled in the discrete model based on tip cell elasticity and stalk cell adhesion [35]](https://thumb-us.123doks.com/thumbv2/123dok_us/8237261.2183335/23.765.141.576.164.713/overview-computational-angiogenic-sprouting-angiogenesis-discrete-elasticity-adhesion.webp)