THE INFLUENCE OF REDUCED MUSCLE QUALITY ON MUSCULAR DIMENSIONAL CHANGES AND PERFORMANCE: IMPLICATIONS FOR THE ELDERLY AND OBESE
Hayden K Giuliani
A thesis submitted to the faculty of the University of North Carolina at Chapel Hill in partial fulfillment of the requirement for the degree of Master of Arts in the Department of Exercise and
Sport Science in the College of Arts and Sciences (Exercise Physiology).
Chapel Hill 2017
Approved by: Eric D. Ryan
ABSTRACT
Hayden K Giuliani: The influence of reduced muscle quality on muscular dimensional changes and performance: implications for the elderly and obese
(Under the direction of Eric D Ryan)
ACKNOWLEDGEMENTS
TABLE OF CONTENTS
LIST OF FIGURES ... vii
LIST OF TABLES ... viii
LIST OF ABBREVIATIONS ... ix
CHAPTER I ... 1
Purpose ... 3
Research Questions ... 3
CHAPTER II ... 4
Aging-Related Issues ... 4
Intramuscular fat infiltration in the aging population ... 7
Functional implications for the elderly and obese elderly ... 8
Ultrasonography during strength testing ... 9
CHAPTER III ... 11
Participants ... 11
Experimental Design ... 11
Statistical Analysis ... 15
CHAPTER IV ... 17
Participants ... 17
Correlations ... 18
LIST OF FIGURES
Figure 1: Muscular CSA Change Versus Isometric Torque % MVC Between Groups ... 25
Figure 2: Muscular Depth Change Versus Isometric Torque % MVC of All Groups ... 26
Figure 3: Muscular Width Change Versus Isometric Torque % MVC of All Groups ... 27
LIST OF TABLES
LIST OF ABBREVIATIONS
ADL Activities of daily living CSA Cross-sectional area
CT Computerized tomography
EI Echo intensity
ES Effect size
IMAT Intramuscular adipose tissue IMCT Intramuscular connective tissue
IMF Intramuscular fat
MRI Magnetic resonance imaging MVC Maximum voluntary contraction
MQ Muscle quality
OB Older obese adults
ONW Older normal weight adults
RF Rectus femoris
US Ultrasound
CHAPTER I
INTRODUCTION
In 2014, there were over 46 million older adults (≥65 years) living in the United States, and this number is expected to continue to increase.1,2 Functional limitations are a significant concern for older adults, as 61% report difficulty with at least one basic activity of daily living (ADL).3 Although the age-related reductions in ADL’s (e.g. walking upstairs) are multifactorial, it is well established that low levels of physical function are related to impaired strength and power (i.e. dynapenia).4,5 Age-related muscle weakness also poses a significant public health concern, as it is highly related to mortality, physical disability, and overall quality of life.6-8
Traditionally, muscle weakness exhibited in older adults has been attributed to sarcopenia, or the age-related reduction in muscle mass.5,8 Over the age of 70, muscle cross-sectional area (CSA) can decrease up to 1% each year.9 However, previous studies have
suggested that muscle strength decreases at a greater rate (2 – 5 times) than muscle size in older adults.10,11 These findings suggest that other factors are contributing to the reductions in strength and power and subsequent functional limitations.12,13 Delmonico et al.10 demonstrated that there is a significant increase in intramuscular fat (IMF) infiltration in older adults, regardless of sex or muscle mass changes, resulting in impaired muscle quality with aging. Muscle quality has been shown to be an independent risk factor for slips, trips, and falls,14 and a significant predictor of stair climb performance and 6-minute walking time in older adults.15
fat.16 This was supported by Goodpaster et al.18 who demonstrated that biopsy-derived
intramuscular fat content is elevated in younger obese adults. More recent studies have indicated that the age-related increase in intramuscular fat is further elevated with increased levels of obesity. Rastelli and colleages19 found that obese older women had 29% higher muscle tissue fat content [measured by magnetic resonance imaging (MRI)] when compared to age and physical activity matched, normal weight controls. The amount of intramuscular fat was also strongly related (r=-0.825) to isokinetic leg extension strength (normalized to muscle size). These results support previous findings that obesity exacerbates the reduction in relative strength and function, and increased fatigue with activity.9,14,15,20,21 Choi and colleagues20 also showed that obese individuals, especially the elderly, are at higher risk for falls and functional decline due to intramuscular fat.
To date, we are aware of no studies that have specifically determined the mechanism by which increases in intramuscular fat (impaired muscle quality) causes reductions in strength and function. Given the increased role of strength and conditioning professionals in prescribing resistance training in many clinical populations (i.e. elderly and obese), future studies are needed to determine these specific mechanisms to further enhance resistance training exercise
prescription. Recently, a finite-element modeling study examined the influence of intramuscular fat infiltration on contractile performance.22 Interestingly, the authors suggested that the
accumulation of intramuscular fat results in increased muscle tissue stiffness which would resist muscular dimensional changes (i.e. decrease in transverse bulging). Altered muscular dimension changes have been identified in individuals with muscular disorders.23 Chi-Fishman and
changes when compared to healthy age-matched controls. Thus, the purpose of the present study was to determine if increases in intramuscular fat seen with aging and obesity influence muscular dimensional changes during incremental increases in torque production. These aging and obese groups were chosen because they have been demonstrated to possess specific differences in intramuscular fat, muscle quality, strength and function.10,11,19-21
Purpose
The overall objective of this proposal was to determine if greater intramuscular fat influences muscular dimensional changes during incremental increases in torque production, while also determining if these changes are related to muscle function and performance.
Research Questions
1. Do increases in intramuscular fat influence muscular dimensional changes during incremental increases in torque production?
2. Is there a relationship between muscle dimensional changes and muscle quality, muscle strength, and functional performance?
Research Hypotheses
1. We hypothesized that the old normal weight (ONW) adults would have smaller changes in muscular dimensions when compared to the young normal weight (YNW) adults, which would be further reduced in the old obese (OB) adults.
2. We hypothesized that the slope of the muscular dimensional change vs. torque
CHAPTER II
REVIEW OF LITERATURE
Aging-Related Issues
There is an increasing number of older adults (individuals ≥ 65 years old), with more than 46 million living in the United States in 2014. In 2010, people aged 65 and over accounted for 13% of the total population, and it is projected that in 2030 the number of older adults will grow to 72 million and represent nearly 20% of the total U.S. population.24 Interestingly, recent estimates suggest that 61.1% of older adults report limitations in one or more activities of daily living (ADLs).1,24 According to the Federal Interagency aging statistics, most of the reported disability of older adults is associated with self-care and ambulation.24-27 Due to these functional limitations in everyday tasks and a high incidence of injuries (i.e. falls), there is an increased economic burden on older adults and their caretakers.28-30 The percentage of older adults with out-of-pocket spending for health care services increased between 1977 and 2009 (from 83 percent to 94 percent), with the percentage of income spent on health care also increasing.24 Age-related muscle wasting and weakness, termed sarcopenia and dynapenia, respectively, have been proposed as potential causes of these life-threatening conditions.31
groups have shown that aging results in 25-36% decreases in thigh muscle size when compared to younger adults.36-40 Interestingly, a long-term longitudinal study by Goodpaster et al.11 found a 1% decrease in muscle size per year in 3,075 men and women, from 70-79 years. However, the rate of muscle loss seen in older adults is not uniform, with the lower limb muscles reducing at a rate at least twice that of the upper limb.31,41-43 For example, Candow and colleagues41 found that the older men had 80 and 98% of the muscle size for the leg extensors and elbow extensors when compared to the young, respectively. While the previously discussed studies utilized MRI and computed tomography (CT) scans to quantify muscle CSA, the use of muscle biopsies have also been used to measure muscle area. Using this method, Lexell and colleagues reported that the reduction in vastus lateralis muscle size can begin as early as age 25, and can be reduced by up to 10% at 50 years.37
Age-related changes in muscle CSA have been attributed to reductions in both muscle fiber size and quantity.37-39,44-45 Behind these skeletal muscle fiber changes is a continual neuromuscular denervation and reinnervation process, causing motor unit remodeling.45-50 For example, there is a reported 47% decrease in the number of motor units in older adults, with the greatest changes occurring in larger fast-twitch motor units.48,50 Previous authors45,49-51 have reported that there is a greater reduction in type II versus type I muscle fibers, evident by less specific enzyme activity of type II fibers. For example, Lexell and colleagues38 found a 25% loss of total muscle fibers in the vastus lateralis, with a preferential reduction of the type II muscle fibers, which accounted for 60% of the reduction in fiber number. Aging-related motor unit remodeling has also demonstrated that type II fibers will become denervated and
has been documented in a few classic studies showing an increased percent area of type I fibers.44,47,53 With increasing age, it has been shown that this shift to slow-twitch fibers and increase in fiber grouping causes a higher proportion of type I fibers, which is directly linked to fewer fibers per CSA.37,45,52 In addition, previous studies have also documented significant age-related atrophy in single muscle fibers, which is also more prominent in type II fibers (35%) than type I fibers (6%).52,54,55 Lastly, when fibers do not become reinnervated, there is an increase in fat and connective tissue infiltration, which consequently contributes to the decrease in muscle quality.49,55-56
More recent studies have shown that dynapenia, defined as the age-related loss of muscle strength, may be more highly associated with physical disability.7,9,10,57-59 When adjusting for sarcopenia, strength losses were 24-30% in the leg extensors and flexors, indicating that sarcopenia may be secondary to the effects of dynapenia.7,57-59 Furthermore, Perry and
specifically in healthy older adults. However, it appears that voluntary activation is reduced in older adults that are less physical active and have a disease.63-64
Aging also has negative consequences on muscle-tendon characteristics, including decreases in musculotendinous stiffness, weakening and slowing of contractile components, and changes in fiber architecture. A reduction in the rate of force development in older adults has been contributed to muscle-tendon compliance.65-66 For example, aging is often accompanied by decreases in tendon stiffness65-66 causing additional “lag” time between muscle activation and muscle force production.67 In addition, Larsson and colleagues45 have reported a 20-46% and 10-30% decline in maximal shortening velocity in type II and type I muscle fibers, respectively.68 D’Antona et al.69 explained this loss by demonstrating a lower myosin concentration in both fiber types. Muscle architecture may also play an important role in force development, specifically fascicle length and pennation angle, which have been shown to be reduced with aging. Cross-sectional studies70-71 have found a 10-19% reduction in fascicle length, suggesting fewer sarcomeres in series, while other studies70,72 have found a 13-20% reduction in pennation angle, indicative of fewer sarcomeres in parallel. Though it is not known which of these
mechanisms is most significant in the loss of strength, all may play a contributing role to the loss of strength and function in older individuals.
Intramuscular fat infiltration in the aging population
referred to as myosteatosis.9,39-40,73 Numerous cross-sectional and longitudinal studies9,10 have found that with aging there is a significant increase in IMF and intramuscular connective tissue, up to 50% (combined), specifically within the quadriceps muscles.9,10,73-75 A recent study by Akima et al.75 demonstrated that IMF related changes in muscle quality measured by both MRI and US are related to extramyocellular lipids versus intramyocellular lipids. Additionally, reductions in physical activity levels in older adults has been shown to lead to greater IMF infiltration (18.4%), when compared to those who maintained their physical activity levels (2.3%).11
Among the growing number of older adults, more than a third are obese, and that number is expected to more than double by 2050.3 This poses a significant concern for the elderly population, with obesity exacerbating the aging-related issues, often referenced as sarcopenic obesity.14,35,76-77 For example, a study by Choi and colleagues20 demonstrated that obese older adults showed an increased number of intramuscular lipids, up to two times greater than normal weight older adults. Interestingly, other studies19,78 have shown up to a 29% increase in muscle fat content in obese older adults when compared to the normal weight older adults, even after controlling for muscle size.
Functional implications for the elderly and obese elderly
Aging is associated with a significant reduction in mobility/functionality and has been attributed to mechanisms associated alterations in skeletal muscle function20,79-81 that are further exacerbated with increases in obesity.14,82-83 Research has shown that up to 61.1% of older adults report limitation with at least one activity of daily living (ADL).3 For example,
higher BMI category displaying a 4-5 times greater risk for functional limitations, and 30-40% of those individuals reporting limitations in ADLs.80 For example, Himes and colleagues79 showed that the obese older adults were at higher risk for falls, and more importantly, ADL limitations after a fall. Similarly, a study by Rolland and colleagues14, comparing normal weight and obese older adults (≥ 75 years), concluded that sarcopenic-obese adults had the highest odds of
difficulty with functional tasks.
Previous studies have shown significant correlations between IMF content and functional performance (i.e. walking speed and stair climb), suggesting that it IMF may contribute to the functional decline. For example, it has been shown that IMF content and rectus femoris EI were significantly correlated to walking speed and functional up-and-go tests in older men and
women, with poorer muscle quality leading to slower times.82-83,88 More specifically, Therkelson and colleagues87 found that for each standard deviation decrease in muscle attenuation (CT derived measure of IMF), there was an 1.29 increased chance of lower walking speed. Similarly, another study found that thigh IMF predicted gait speed in 2,306 older adults.84 These authors have suggested that the contractile muscle properties became less functional with increased intramuscular connective and adipose tissue, creating more stiffness within the muscle.9,88 A finite-modeling study by Rahemi and colleagues21 has supported this possible mechanism, explaining that fat infiltration associated with obesity and aging can cause an increased stiffness in the muscle’s base material properties, affecting fiber shortening and the interaction with the aponeuroses.
Ultrasonography during strength testing
due to its lack of radiation and portability.90-92 Using panoramic brightness-mode (B-mode) US imaging has allowed researchers to obtain an US image of large muscles, and have demonstrated good reliability .89-92 In addition, a recent study by Young et al. 95 that subcutaneous fat
thickness corrected EI values produced similar measures of MRI derived IMF in a diverse group of participants.
CHAPTER III
METHODOLOGY
Participants
Forty-nine men volunteered for this investigation and were categorized into three groups: YNW (BMI = 22.4±1.2, age = 21.7±2.2 years), ONW (BMI = 23.5±1.5, age = 70.3±1.6 years), and OB (BMI = 33.5±2.3, age = 66.6±2.2 years). For the separate groups, 23 participants were enrolled and completed for the YNW group, 15 participants were enrolled and 13 completed for ONW group, and 11 participants were enrolled and 9 completed the study for the OB group. All demographic data are represented in Table 1. Primary exclusion criteria included: 1) diabetes, 2) neuropathy, 3) neuromuscular disease, 4) a recent lower extremity injury in the past three
months, 5) the loss or gain of 20 pounds in the previous two months, and 6) engaging in more than three hours of exercise per week.
Experimental Design
Protocol: Each participant visited the laboratory on two occasions, separated by 6-10 days at the
Questionnaire (IPAQ) long version was completed to assess job-related, transportation-related, housework-related, and leisure time activity levels.99 The questionnaire was scored according the questionnaire developers’ instructions. During visit two, the participants performed the 10-meter maximum walking speed test, followed by a 10 minute rest period prior to the maximal and submaximal isometric strength protocol.
Body composition
Stature and body mass were assessed using a calibrated stadiometer (Perspectives Enterprises, Portage, MI USA) and calibrated clinical scale (Tanita Corp, Tokya, Japan), respectively. Percent body fat (%fat) was determined from a dual-energy x-ray absorptiometry (DEXA) (Hologic Discovery W, Bedford, MA) scan. The participants wore athletic clothing, free of any metal, removed any jewelry prior to scanning, and were centered on the DEXA bed in the supine position.
Ultrasound
Prior to the resting US assessment, participants rested on a padded table for 20 minutes to allow adequate time for any potential changes in body fluid shifts.100 Measures of muscle size and quality were assessed using a portable brightness mode (B-mode) US imaging device (LOGIQ e 5, General Electric Company, Milwaukee, WI, USA) and a multi-frequency linear-array probe (12L-RS; 5-13 MHz; 38.4 mm FOV) (General Electric Company, Milwaukee, WI, USA). On visit one, resting US images were obtained using the panoramic function on the three superficial quadriceps muscles (vastus lateralis, rectus femoris, and vastus medialis) of the right leg, with the subject in a supine position and the right leg relaxed and propped at 50 degrees of flexion, which was verified using a goniometer. A cross-sectional scan was performed
and articular cleft of the knee. Transmission gel was used to enhance acoustic coupling. Steady mild pressure was applied during the course of the scan, without excessive compression of the muscle.
On visit two, a single cross-sectional US scan of the RF was taken at rest, and during each maximal and submaximal muscle action approximately two seconds from the onset of the contraction to ensure the target torque levels were met. The scan was taken at the same mid-thigh position with the participants seated in the Humac dynamometer chair. The RF was identified prior to testing and marked to ensure consistent placement.
Image Analysis
All images were analyzed using Image-J software (version 1.46r, National Institutes of Health, USA) to obtain muscle size [cross-sectional area (CSA)] and muscle quality [echo intensity (EI)] values. Prior to analysis, each individual image was scaled from pixels to centimeters using the straight line function. The polygon function was used to assess CSA by outlining the entire muscle, excluding the fascial border. The same region of interest was analyzed using the computer aided gray scale standard histogram function to obtain a mean EI value. Values range from 0-255 arbitrary units (a.u.), with black=0 and white=255.
Subcutaneous fat thickness was measured using the straight line function from the skin to the superficial aponeurosis. The average value of the subcutaneous fat thickness measured at the midpoint, medial, and lateral edges of the muscle was used for further analysis. EI values were corrected for subcutaneous fat thickness by using the method outlined by Young and
determine rectus femoris CSA, thickness (greatest vertical distance), and perpendicular width (greatest horizontal distance).
Isometric Strength Testing
Leg extension peak torque was assessed during an isometric maximal voluntary
contraction (MVC) using a calibrated HUMAC Norm dynamometer (Computer Sports Medicine Inc., Stoughton, MA, USA). Participants were seated in the dynamometer with the right leg flexed 60º from horizontal (full extension = 0 º). The lower leg was secured to the lever arm using a padded Velcro strap placed approximately 5 cm proximal from the lateral malleolus of the ankle. The axis of rotation of the dynamometer was aligned with the center of the subject’s knee joint. Seatbelts were used across the waist and upper body to stabilize the subject’s torso. Participants were asked to hold their arms across their chest during each effort. Following three submaximal warm-up muscle actions, each participant then performed two 3-4 second MVCs separated by a 2-minute recovery period. The highest peak torque value of the two MVCs was used to calculate the submaximal step muscle actions96 at 10 – 90% of their MVC in 10% increments. The submaximal muscle actions were performed in random order with a 2-minute recovery period. The participant was asked to maintain the target torque level for 4-7 seconds from a monitor displayed in front of him at the selected submaximal intensity.
Signal Processing
Isometric peak torque (PT) was determined as the highest 500 ms epoch during the 3- to 4-s MVC. During the submaximal muscle actions, isometric torque was determined from the most stable plateau of the 4- to 6-s hold with a similar 500 ms epoch.
Maximum Speed Walking Test101
Prior to performing the isometric strength testing on visit two, each participant performed a 10-meter maximum walking speed test, as described by by Clark et al.101 Participants walked a total of 20 meters, allowing for 5 m acceleration and 5 m deceleration periods. Two researchers timed the trials with handheld stopwatches, and the two times were averaged. Participants were told when to start, and were instructed to walk as quickly as they could for the entire 20 meters. The walking speed of each participant was normalized to leg length. The fastest relative walking speed [speed (cm/s)/height (cm)]102 of the three trials was used for analysis.
Statistical Analysis
Descriptive data is summarized using mean ± standard deviation (SD). The slope of the muscular dimension vs. torque relationship (see below), skeletal muscle quality (EI), muscle CSA, isometric strength, maximum walking speed, % fat, and physical activity levels were examined using a one-way between-subjects ANOVA. The resting and active muscular
dimensional changes (entire CSA, horizontal, and vertical) were also examined separately using a 3 × 11 (group × torque intensity) mixed factorial ANOVA. The curvilinear muscular
CHAPTER IV
RESULTS
Participants
There was a significant difference between groups in age (P < 0.001), body mass (P < 0.001), and BMI (P < 0.001), but not in stature (P > 0.999). The OB group had significantly greater body mass and BMI compared to the YNW and ONW groups. The YNW group had significantly lower % fat than the ONW (P = 0.007), and the ONW group was significantly lower than the OB group (P < 0.001). Similarly, the OB group showed a significantly greater EI than the ONW (P < 0.001) and YNW groups (P < 0.001), with ONW exhibiting a significantly higher EI than YNW group (P = 0.013). There was also a significant difference in CSA (P < 0.036), with the YNW group exhibiting the greatest CSA and the ONW group showing the smallest CSA. The IPAQ physical activity scores were different between the ONW and OB groups (P = 0.036), but no other difference between groups existed. There were no significant differences between groups for walking speed (P = 0.122) or MVC PT (P = 0.176).
For the slope of the CSA vs. torque relationship, there was a significant difference
Muscular Dimensions vs. Torque Relationships
For CSA, there was a significant interaction (P = 0.010; Figure 1). Muscle CSA was greater at rest when compared to 30%-100% MVC (P < 0.045), 10% was greater than 50-100% MVC (P < 0.035), and 20% was greater than 60-100% MVC (P < 0.046) for the YNW group. There were no significant change from rest to 100% MVC for the ONW and OB groups (P > 0.410). For depth, there was no significant interaction (P = 0.531) or group main effect (P = 0.334), but there was a significant main effect for torque (P < 0.001; Figure 2). Rest was significantly less when compared to 10-100% MVC (P < 0.001), and 10% less than 30-100% MVC (P < 0.016). For width, there was no significant interaction (P = 0.631) or group main effect (P = 0.180), but there was a significant main effect for torque (P < 0.001; Figure 3). Rest was greater than 10-100% MVC (P < 0.001), 10% was greater from 20-100% (P < 0.012), and 20% was greater from 50-100% MVC (P < 0.008).
Correlations
CHAPTER V
DISCUSSION
The primary findings of the current study indicated that RF CSA decreased from rest to 30% in the YNW group, whereas there was no change in CSA across %MVC for both the ONW and OB groups (Figure 1). These muscular dimensional changes (i.e. slope of CSA and depth vs torque relationship) were significantly correlated with walking speed, but not with body fat percentage, muscle strength, or muscle quality.
previous studies which demonstrated that increases in US EI values are linked to increases in both fat106 and/or fibrous107 tissues. Studies have also shown that muscle size significantly decreases with aging, often known as sarcopenia, specifically in the thigh muscles.35-40 Our findings supported this, with the ONW and OB groups exhibiting smaller CSA than the YNW group. Further studies, specifically by Tomlinson et al.,17,77 have shown that obesity may potentially increase CSA, due to the increases in intramuscular fat and chronic loading of the skeletal muscle. In our study, the OB group showed significantly greater CSA than the ONW group, while also presenting increased EI, supporting that claim.
adults would show significantly less muscle dimensional changes, and the OB adults would show the least amount of muscle dimensional changes when compared to the YNW adults. The present study indicated that both older adult groups demonstrated different changes in CSA across torque intensities, but no difference between the ONW and OB adults (Table 1 and Figure 1).
Interestingly, the differences between young and older adults was not present for the depth and width changes across torque intensities. A possible explanation for the lack of difference in the change in CSA between the ONW and OB adults, despite a significant difference in EI, is that intramuscular fibrous tissue could be a greater contributor to how the muscle changes shape during increasing contraction intensities than intramuscular fat. Future studies using more complex technologies (i.e. MRI), which can distinguish between fat and fibrous tissues, are warranted to examine these hypotheses.9,13,75
Many previous studies have shown that muscle strength31,41-43 and functional
faster walking speeds. The significant relationship with maximal walking speed, versus isometric strength may be due to the dynamic nature of the activity. The maximal walking speed test has also been shown to more readily express neuromuscular changes, rather than an individual’s usual walking speed.101 However, the slope values of the muscle dimensional changes were not significantly correlated with any other variables, including muscle quality. Interestingly, though, a correlation with %fat was trending towards significance (p > 0.075). This relationship may also be indicative of the increased role of intramuscular fibrous tissue, rather than intramuscular fat. Csapo et al.9 found that with aging there is also a significant increase in intramuscular connective (i.e. fibrous) tissue (IMCT). These authors also suggested that the IMCT plays a more significant role than intramuscular adipose tissue in muscle stiffness, which can impair muscle function.9,109
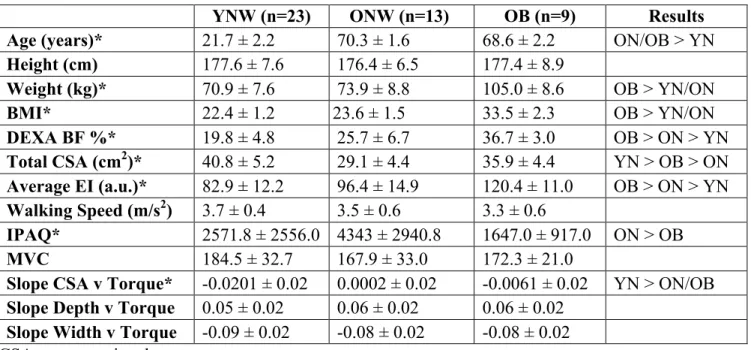
Table 1: Participant demographics, muscle characteristics, and performance variables.
YNW (n=23) ONW (n=13) OB (n=9) Results
Age (years)* 21.7 ± 2.2 70.3 ± 1.6 68.6 ± 2.2 ON/OB > YN Height (cm) 177.6 ± 7.6 176.4 ± 6.5 177.4 ± 8.9
Weight (kg)* 70.9 ± 7.6 73.9 ± 8.8 105.0 ± 8.6 OB > YN/ON
BMI* 22.4 ± 1.2 23.6 ± 1.5 33.5 ± 2.3 OB > YN/ON
DEXA BF %* 19.8 ± 4.8 25.7 ± 6.7 36.7 ± 3.0 OB > ON > YN Total CSA (cm2)* 40.8 ± 5.2 29.1 ± 4.4 35.9 ± 4.4 YN > OB > ON Average EI (a.u.)* 82.9 ± 12.2 96.4 ± 14.9 120.4 ± 11.0 OB > ON > YN Walking Speed (m/s2) 3.7 ± 0.4 3.5 ± 0.6 3.3 ± 0.6
IPAQ* 2571.8 ± 2556.0 4343 ± 2940.8 1647.0 ± 917.0 ON > OB
MVC 184.5 ± 32.7 167.9 ± 33.0 172.3 ± 21.0
Slope CSA v Torque* -0.0201 ± 0.02 0.0002 ± 0.02 -0.0061 ± 0.02 YN > ON/OB Slope Depth v Torque 0.05 ± 0.02 0.06 ± 0.02 0.06 ± 0.02
Slope Width v Torque -0.09 ± 0.02 -0.08 ± 0.02 -0.08 ± 0.02 CSA, cross-sectional area
EI, echo intensity a.u., arbitrary units
IPAQ, International Physical Activity Questionnaire (score) MVC, maximal voluntary contraction
Figure Legends
Figure 1 – The change in rectus femoris (RF) cross-sectional area (CSA) across % MVC for each group. Mean values are presented and standard deviations bars are shown above the OB group and below the ONW group. Post-hoc analyses are for the young normal weight (YNW) group.
* = Rest > 30-100% (P < 0.045) ₡ = 10% > 50-100% (P < 0.035) § = 20% > 60-100% (P < 0.046)
Figure 2 – The marginal mean changes in rectus femoris (RF) depth across % MVC. Mean ± standard deviations values are presented. Post-hoc analyses include:
* = Rest < 10-100% (P < 0.001) ₡ = 10% < 30-100% (P < 0.016)
Figure 3 – The marginal mean changes in rectus femoris (RF) width across % of MVC. Mean ± standard deviations are presented. Post-hoc analyses include:
* = Rest > 10-100% (P < 0.001) ₡ = 10% > 20-100% (P < 0.012) § = 20% > 50-100% (P < 0.008)
REFERENCES
1. United States Census Bureau. http://quickfacts.census.gov/qfd/states/00000.html 2. Federal Interagency Forum on Aging-Related Statistics. Older Americans 2008: key
indicators of well-being. Washington: U.S. Government Printing Office; 2008.
3. CDC, Health, United States, 2014. http://www.cdc.gov/nchs/fastats/disability.htm
4. Clark BC & Manini TM. Sarcopenia 0/0 dynapenia. J Gerontol A Biol Sci Med Sci, 2008, 63: 829–34.
5. Morse CI, Thom JM, Davis MG, Fox KR, Birch KM, & Narici MV. (2004) Reduced plantarflexor specific torque in the elderly associated with a lower activation capacity. European Journal of Applied Physiology, 92: 219-226.
6. Wanderley FAC, Silva G, Marques E, Oliviera J, Mota J, & Carvalho J. (2011)
Associations between objectively assessed physical activity levels and fitness and self-reported health-related quality of life in community-dwelling older adults. Qual Life Res, 20: 1371-1378.
7. Clark BC & Manini TM. (2010) Functional consequences of sarcopenia and dynapenia in the elderly. Curr Opin Clin Cnutr Metab Care, 13: 271-276.
8. Janssen I, Heymsfield SB, & Ross R. (2002) Low relative skeletal muscle mass (sarcopenia) in older adults is associated with functional impairment and physical disability. Jour Amer Geriatr Soc, 50: 889-896.
9. Csapo R, Valis M, Sinha U, Du J, & Sinha S. (2014) Age-associated differences in triceps surae muscle composition and strength – an MRI-based cross sectional comparison of contractile, adipose, and connective tissue. BMC Musculoskeletal Disorders, 15 (209).
10. Delmonico MJ, Harris TB, Visser M, Park SW, Conroy MB, Velasquez-Mieyer P, Boudreau R, Manini, TM, Nevitt, M, Newman AB, & Goodpaster, BH (2009)
Longitudinal study of muscle strength, quality, and adipose tissue infiltration. American Journal of Clinical Nutritioni, 90: 1579-1585.
11. Goodpaster BH, Park SW, Harris TB, Kritchevsky SB, Newitt M, Schwartz AV, Simonsick EM, Tylavsky FA, Visser M, & Newman AB. (2006) The loss of skeletal muscle strength, mass, and quality in older adults: the health, aging, and body composition study. Journal of Gerontology, 61(10): 1059-1064.
fall status in community-dwelling older adults. Osteoporos Int, DOI: 10.1007/s00198-016-3514-x.
13. Tuttle LJ, Sinacore DR, & Mueller MJ. (2012) Intermuscular adipose tissue is muscle specific and associated with poor functional performance. Journal of Aging Research, DOI:10.1155/2012/172957.
14. Rolland Y, Lauwers-Cances V, Cristini C, Abellan van Kan G, Janssen I, Morley JE, & Vellas B. (2009) Difficulties with physical function associated with obesity, sarcopenia, and sarcopenic-obesity in community-dwelling elderly women: the EPIDOS Study. Am J Clin Nutr, 89: 1985-1900.
15. Maffiuletti NA, Juneau M, Munzinger U, Bizzini M, Agosti F, De Col A, Lafortuna CL, & Sartorio A. (2007) Differences in quadriceps muscle strength and fatigue between lean and obese subjects. Eur J Appl Physiol, 101: 51-59.
16. Barnette TJ, Ryan ED, Gerstner GR, Kleinberg CR, Tweedell AJ, Shea NW, & Giuliani HG. The relationship between muscle echo intensity and limb percent fat: the influence of subcutaneous fat thickness. [Abstract] In: American College of Sports Medicine National Meeting; Boston, MA; May 31- June 4, 2016.
17. Tomlinson DJ, Erskine RM, Winwood K, Morse CI, & Onambele CL. (2014) The impact of obesity on skeletal muscle architecture in untrained young vs old women. J Anat, 225: 675-684.
18. Goodpaster BH, Theriault R, Watkins SC, & Kelley DE. (2000) Intramuscular lipid content is increased in obesity and decreased by weight loss. Metabolism, 49(4): 467-472. 19. Rastelli F, Capodaglio P, Orgiu S, Santovito C, Caramenti M, Cadioli M, Falini A, Rizzo
G, & LaFortuna CL. (2015) Effects of muscle composition and architecture on specific strength in obese older women. Exp Physiol, 100(10): 1159-1167.
20. Choi SJ, Files DC, Zhang T, Wang Z, Messi ML, Gregory H, Stone J, Lyles MF, Dhar S, Marsh AP, Nicklas BJ. & Delbono O. (2015) Intramyocellular lipid and impaired
myofiber contraction in normal weight and obese older adults. Journals of Gerontology: Medical Sciences, 0(0): 1-8.
21. Rahemi, H., Nigam, N., & Wakeling, J.M. (2015) The effect of intramuscular fat on skeletal muscle mechanics: implications for the elderly and obese. Journal of the Royal Society, 12(109).
23. Chi-Fishman G, Hicks JE, Cintas HM, Sonies BC, & Gerber LH. (2004) Ultrasound imaging distinguishes between normal and weak muscle. Arch Phys Med Rehabil, 85: 980-986.
24. Federal Interagency Forum on Aging-Related Statistics. Older Americans 2012: key indicators of well-being. Washington: U.S. Government Printing Office; 2012.
25. Hamman RF, Mulgrew CL, Baxter J, Shetterly SM, Swenson, & Morgenstern NE. (1999) Methods and prevalence of ADL limitations in Hispanic and non-Hispanic white subjects in rural Colorado: the San Luis Valley health aging study. Ann Epidemiol, 9: 225-235. 26. Millan-Calenti JC, Tubio J, Pita-Fernandez S, Gonzalez-Abraldes I, Lorenzo T,
Fernandez-Arruty T, & Maseda A. (2010) Prevalence of functional disability in activities of daily living (ADL), instrumental activities of daily living (IADL) and associated factors, as predictors of morbidity and mortality. Gerontology and Geriatrics, 50: 306-310.
27. Tang Z, Wang H, Meng C, Wu X, Ericsson K, Winblad B, & Pei J. (1999) The
prevalence of functional disability in activities of daily living and instrumental activities of daily living among elderly Beuijing Chinese. Geriatrics and Gerontology, 29: 115-125.
28. Robbins AS, Rubenstein LZ, Josephson KR, Schulman BL, Osterwell D, & Fine G. (1989) Predictors of falls among elderly people. Arch Int Med, 149: 1628-1633.
29. Stevens JA, Corso PS, Finkelstein EA, & Miller TR. (2006) The costs of fatal and non-fatal falls among older adults. Injury Prevention, 12: 290-295.
30. Lai DWL. (2012) Effect of financial costs on caregiving burden of family caregivers of older adults. DOI: 10.1177/2158244012470467
31. Von Haehling S, Morley JE, & Anker SD. (2010) An overview of sarcopenia: facts and numbers on prevalence and clinical impact. J Cachexia Sarcopenia Muscle, 1:129-133
32. Brooks SV & Faulkner JA. (1994) Skeletal muscle weakness in old age: underlying mechanisms. Med Sci Sports Exerc, 26(4): 432-439.
33. Rosenburg I. (1989) Summary comments. Am J Clin Nutr, 50: 1231-1233.
34. Janssen I, Heymsfield SB, Wang Z, & Ross R. (2000) Skeletal muscle mass and distribution in 468 men and women aged 18-88 yr. J Appl Physiol, 89: 81-88.
36. Lexell J. (1995) Human aging, muscle mass, and fiber type composition. Journals of Gerontology, 50:11-16.
37. Lexell J, Taylor CC, & Sjostrom M. (1988) What is the cause of aging atrophy? Total number, size and proportion of different fiber types studied in whole vastus lateralis muscle from 15- to 83-year-old men. Journal of Neurological Sciences, 84:275-294. 38. Lexell J, Henriksson-Larsen K, Winblad B, & Sjostrom M. (1983) Distribution of
different fiber types of human skeletal muscles: effects of aging studied in whole muscle cross section. Muscle and Nerve, 6: 588-595.
39. Rice CL, Cunningham DA, Paterson DH, & Lefcoe MS. (1989) Arm and leg composition determined by computed tomography in young and elderly men. Clin Physiol, 9: 207-220.
40. Overend TJ, Cunningham DA, Paterson DH, & Lefcoe MS. (1992) Thigh composition in young and elderly men determined by computed tomography. Clin Physiol, 12: 629-640. 41. Candow DG & Chilibeck PD. (2005) Differences in size, strength, and power of upper
and lower body muscle groups in young and older men. Journal of Gerontology: Biological Sciences, 60A(2): 148-156.
42. Bemben MG, Massey BH, Bemben DA, Misner JE, & Boileau RA. (1991) Isometric muscle force production as a function of age in healthy 20- to 74-year- old men. Med Sci Sports Exerc, 23(11): 1302-1310.
43. Gallagher D, Visser M, De Meersman RE, Sepulveda D, Baumgartner RN, Pierson RN, Harris T, & Heymsfield SB. (1997) Appendicular skeletal muscle mass: effects of age, gender, and ethnicity. J Appl Physiol, 83(1): 229-239.
44. Andersen JL. (2003) Muscle fiber type adaptation in the elderly human muscle. Scand J Med Sci Sports, 13: 40-47.
45. Larsson L. (1983) Histochemical characteristics of human skeletal muscle during aging. Acta Physiol Scand, 117: 469-471.
46. Oda K. (1984) Age changes of motor innervation and acetylcholine receptor distribution on human skeletal muscle fibers. Journal of Neurological Sciences, 66: 327-338.
47. Lexell J & Downham DY. (1991) The occurrence of fiber-type grouping in healthy human muscle: a quantitative study of cross-sections of whole vastus lateralis from men between 15 and 83 years. Acta Neuropathol, 81: 377-381.
49. Lexell J, Downham D, & Sjostrom M. (1986) Distribution of different fiber types in human skeletal muscles. Journal of the Neurological Sciences, 72: 211-222.
50. Doherty TJ, Vandervoort AA, Taylor AW, & Brown WF. (1993) Effects of motor unit losses on strength in older men and women. J Appl Physiol, 74(2): 868-874.
51. Verdijk LB, Snijders T, Beelen M, Savelberg HHCM, Meijer K, Kuipers H, & van Loon JC. (2010) Characteristics of muscle fiber type are predictive of skeletal muscle mass and strength in elderly men. Journal of Anerican Geriatrics Society, 58: 2069-2075.
52. Lexell J & Taylor CC. (1991) Variability in muscle fiber areas in whole human quadriceps muscle: effects of increasing age. J Anat, 174: 239-249.
53. Mosole S, Kern H, Loefler S, Fruhmann H, Vogelauer M, Burggraf S, Mayr W, Krenn M, Paternostro-Sluga T, Hamar D, Cvecka J, Sedliak M, Tirpakova V, Sarabon N, Musaro A, Sandri M, Protasi F, Nori A, Pond A, & Zampieri S. (2014) Long-term high-level exercise promotes reinnervation with age. J Neuropathol Exp Neurol, 73(4): 284-294.
54. Aagaard P, Suetta C, Caserotti P, Magnusson SP, & Kjaer M. (2010) Role of the nervous system in sarcopenia and muscle atrophy with aging: strength training as a
countermeasure. Scan J Med Sci Sports, 20: 49-64.
55. Lee W, Cheung W, Qin L, Tang N, & Leung K. (2006) Age-associated decrease of type IIA/B human skeletal muscle fibers. Clinical Orthopedics and Related Research, 450: 231-237.
56. Erim Z, Beg MF, Burke DT, & De Luca CJ. (1999) Effects of aging on motor-unit control properties. J Neurophysiol, 82: 2081-2091.
57. Frontera WR, Reld KF, Hughes VA, Fielding RA, Fiatarone MA, Evans WJ, & Roubenoff R. (2000) Aging of skeletal muscle. J Appl Phyiol, 88: 1321-1326. 58. Frontera WR, Hughes VA, Lutz KJ, & Evans WJ. (1991) A cross-sectional study of
muscle strength and mass in 45-78-yr-old men and women. J Appl Physiol, 71(2): 644-650.
59. Metter EJ, Talbot LA, Schrager M, & Conwit R. Skeletal muscle strength as a predictor of all-cause mortality in healthy men. Journal of Gerontology, 57A(10): B359-B365.
60. Perry MC, Carvolle SF, Smith ICH, Rutherford OM, & Newman DJ. (2007) Strength, power output and symmetry of leg muscles: effect of age and history of falling. Eur J Appl Physiol, 100: 553-561.
101.
62. Klass M, Baudry S, & Duchateau J. (2007) Voluntary activation during maximal contraction with advancing age: a brief review. Eur J Appl Physiol, 100:543-551.
63. Harridge SDR, Dryger A, & Stensgaard A. (1999) Knee extensor strength, activation, and size in very elderly people following strength training. Muscle Nerve, 22: 831-839.
64. Hurley MV & Newman DJ. (1993) The influence of arthrogenous muscle inhibition on quadriceps rehabilitation of patients with early, unilateral osteoarthritic knees. Br J Rheumatol, 32: 127-131.
65. Blazevich AJ, Cannavan D, Horne S, Coleman DR, & Aagaard P. (2009) Changes in muscle force-length properties affect the early rise of force in vivo. Muscle Nerve, 39: 512-520.
66. Arampatzis A, Degens H, Baltzopoulos V, & Rittweger J. (2011) Why do older sprinters reach the finish line later? Exerc Sport Sci Rev, 39(1): 18-22.
67. Waugh CM, Korff T, Fath F, & Blazevich AJ. (2013) Rapid force production in children and adults: mechanical and neural contributions. Med Sci Sports Exerc, 45(4): 762-771.
68. Krivickas LS, Hughes WJ, Roubenoff R, & Frontera WR. (2001) Age- and gender-related differences in maximum shortening velocity of skeletal muscle fibers. Am J Phys Med Rehabil, 80: 447-455.
69. D’Antona G, Pellegrino MA, Adami R, Rossi R, Carlizzi CN, Canepari M, Saltin B, & Bottinelli R. (2003) The effect of aging and immobilization on structure and function of human skeletal muscle fibers. J Physiol, 552(2): 499-511.
70. Narici MV, Maganaris CN, Reeves ND, & Capodaglio P. (2003) Effect of aging on human muscle architecture. J Appl Physiol, 95: 2229-2234.
71. Thom JM, Morse CI, Birch KM, & Narici MV. (2007) Influence of muscle architecture on the torque and power-velocity characteristics of young and elderly men. Eur J Appl Physiol, 100: 613-619.
72. Strasser EM, Draskovits T, Praschak M, Quittan M, & Graf A. (2013) Association between ultrasound measurements of muscle thickness, pennation angle, echogenicity, and skeletal muscle strength in the elderly. Age, 35: 2377-2388.
74. Hogrel J, Barnouin Y, Azabou N, Butler-Browne G, Voit T, Moraux A, Leroux G, Behin A, McPhee JS, & Carlier PG. (2015) NMR imaging estimates of muscle volume and intramuscular fat infiltration in the thigh: variations with muscle, gender, and age. Age, 37: 60
75. Akima H, Hioki M, Yoshiko A, Koike T, Skakibara H, Takahashi H, & Oshida Y. (2016) Intramuscuar adipose tissue determined by T1-weighted MRI at 3 T primarily reflects extramyocellular lipids. Magnetic Resonance Imaging, 34: 397-403.
76. Stenholm S, Harris TB, Rantanen T, Visser M, Kritchevsky SB, & Ferrucci L. (2008) Sarcopenic obesity – definition, etiology and consequences. Curr Opin Clin Nutr Metab Care, 11(6): 693-700.
77. Tomlinson DJ, Erskine RM, Winwood K, Morse CI, Onambele GL. (2014) Obesity decreases both whole muscle and fascicle strength in young females abut only
exacerbates the aging-related whole muscle level asthenia. Physiological Reports, 2(6): 1-14.
78. Koster A, Ding J, Stenholm S, Caserotti P, Houston DK, Nicklas BJ, You T, Lee JS, Visser M, Newman AB, Schwartz AV, Cauley JA, Tylavsky FA, Goodpaster BH, Kritchevsky SB, & Harris TB. (2011) Does the amount of fat mass predict age-related loss of lean mass, muscle strength, and muscle quality in older adults? Journal of Gerontology: Medical Sciences, 66a(8): 888-895.
79. Himes CL & Reynolds SL. (2012) Effect of obesity on falls, injury, and disability. J Am Geriatr Soc, 60: 124-129.
80. Zoico E, Di Francesco V, Guralnik JM, Mazzali G, Bortolani A, Guariento S, Sergi G, Bosello O, & Zamboni M. (2004) Physical disability and muscular strength in relation to obesity and different body composition indexes in a sample of healthy elderly women. INternation Journal of Obesity, 28: 234-241.
81. Fukumoto Y, Ikezoe T, Yamada Y, Tsukagoshi R, Nakmura M, Mori N, Kimura M, & Ichihashi N. (2012) Skeletal muscle quality assessed from echo intensity is associated with muscel strength of middle-aged and elderly persons. Eur J Appl Physiol, 112: 1519-1525.
82. Rech A, Radaelli R, Goltz FR, Telles da Rosa LH, Schneider CD, & Pinto RS. (2014) Echo intensity is negatively associated with functional capacity in older women. Age, 36: 9708.
83. Wilhelm EN, Rech A, Minozzo F, Radaelli R, Botton CE, & Pinto RS. (2014)
84. Beavers KM, Beavers DP, Houston DK, Harris TB, Hue TF, Kpster A, Newman AB, Simonsick SA, Nicklas BJ, & Kritchevsky SB. Associations between body composition and gait-speed decline: results from the Health, Aging, and Body Composition study. Am J Clin Nutr, 97: 552-560.
85. Trombetti A, Reid KF, Hars M, Herrmann FR, Pasha E, Phillips EM, & Fielding RA. (2016) Age-associated declines in muscle mass, strength, power and physical
performance: impact on fear of falling and quality of life, Osteoporos Int, 27: 463-471. 86. Weber D. (2016) Differences in physical aging measured by walking speed: evidence
from the English longitudinal study of aging. BMC Geriatrics, 16:31.
87. Therkelson KE, Pedley A, Hoffmann U, Fox CS, & Murabito JM. (2016) Intramuscular fat and physical performance at the Framingham Heart Study. Age, 38: 31 (1-12)
88. Marcus RL, Addison O, Dibble LE, Foreman KB, Morrell G, & LaStayo P. (2012) Intramuscular adipose tissue, sarcopenia, and mobility function in older individuals. Journal of Aging Research, DOI:10.1155/2012/629637.
89. Ryan ED, Rosenberg JG, Scharville MJ, Sobolewski EJ, Tweedell AJ, & Kleinberg CR. (2014) Pennation angle does not influence the age-related differences in echo intensity of the medial gastrocnemius. Ultrasound Med Biol, 41: 618-621.
90. Kleinberg CR, Ryan ED, Tweedell AJ, Barnette TJ, & Wagoner CW. (2015) The
influence of lower extremity muscle size and quality on stair-climb performance in career firefighters. Journal Strength and Conditioning, DOI: 10.1519/J SC.0000000000001268. 91. Rosenberg JG, Ryan ED, Sobolewski EJ, Scharville MJ, Thompson BJ, & King GE.
(2014) Reliability of panoramic ultrasound imaging to simultaneously examine muscle size and quality of the medial gastrocnemius. Muscle Nerve, 49: 736-740.
92. Palmer TB, Akehi K, Thiele RM, Smith DB, & Thompson BJ. (2015) Reliability of panoramic ultrasound imaging in simultaneously examining muscle size and quality of the hamstring muscles in young, healthy males and females. Ultrasound in Med and Biol, 41(3): 675-684.
93. Earp JE, Newton RU, Cormie P, & Blazevich AJ. (2015) Inhomogeneous quadriceps femoris hypertrophy in response to strength and power training. Med Sci Sports Exerc, 47(11): 2389-2397.
94. Pinto RS, Correa CS, Radaelli R, Cadore EL, Brown LE, & Bottaro M. (2014) Short-term strength training improves muscle quality and functional capacity of elderly women. Age, 36: 365-372.
96. Ryan ED, Cramer JT, Housh TJ, Beck TW, Herda TJ, & Hartman MJ. (2007) Inter-individual variability in the torque-related patterns of responses for mechanomyographic amplitude and mean power frequency. Journal of Neuroscience Methods, 161: 212- 219. 97. Dontje ML, de Groot M, Lengton RR, van der Schans CP, & Krijnen WP. (2015)
Measuring steps with the Fitbit activity tracker: an inter-device reliability study. Journal of Medical Engineering & Technology, 39(5), 286-290.
98. Dyrstad SM, Hansen BH, Holme IM, & Anderssen SA. (2014) Comparison of self-reported versus accelerometer-measured physical activity. Med Sci Sports Exerc, 46(1), 99-106.
99. Goodpaster BH, Chomentowski P, Ward BK, Rossi A, Glynn NW, Delmonico MJ, Kritchevsky SB, Pahor M, & Newman AB. (2008) Effects of physical activity on strength and skeletal muscle fat infiltration in older adults: a randomized controlled trial. J Appl Physiol, 105, 1498-1503.
100. Cerniglia LM, Delmonico MJ, Lindle R, Hurley BF, & Rogers MA. (200&) Effects of acute supine rest on mid-thigh cross-sectional area as measured by computed
tomography. Clin Physiol Funct Imaging, 27(4), 249-253.
101. Clark DJ, Manini TM, Fielding RA, & Patten C. (2012) Neuromuscular determinants of maximum walking speed in well-functioning older adults. Experimental Gerontology, 48: 358-363.
102. Bohannon RW. (1997) Comfortable and maximum walking speed of adults aged 20-79 years: reference values and determinants. Age and Ageing, 26: 15-19.
103. Herda TJ, Housh TJ, Fry AC, Weir JP, Schilling BK, Ryan ED, & Cramer JT. (2010) A noninvasive, log-transform method for fiber type discrimination using
mechanomyography. Journal of Electromyography and Kinesiology, 20(5): 787-794. 104. Guo SS, Zeller C, Chumlea WC, & Siervogel RM. (1999) Aging, body composition, and
lifestyle: the Fels Longitudinal Study. Am J Clin Nutr, 70(3): 405-411.
105. Shah NR & Braverman ER. (2012) Measuring adiposity in patients: the utility of body mass index (BMI), percent body fat, and leptin. PLoS ONE, 7(4).
106. Reimers K, Reimers CD, Wagner S, Paetzke I, & Pongratz DE. (1993) Skeletal muscle sonography: a correlative study of echogenicity and morphology. J Ultrasound Med, 2: 73-77.
correlation between fibrous tissue and echo intensity. Ultrasound in Med & Biol, 35(3): 443-446.
108. Foldvari M, Clark M, Laviolette LC, Berstein MA, Kaliton D, Castaneda C, Pu CT, Hausdorff JM, Fielding RA, & Singh MAF. (2000) Association of muscle power with functional status in community-dwelling elderly women. J Gerontol A Biol Sci Med Sci, 55(4): M192-M199.