Multiple Sources of Dynamic Characteristics
Thilo Denzer, Andrii Shalaginov, and Geir Olav Dyrkolbotn
NTNU Malware Lab
Department of Information Security and Communication Technology Faculty of Information Technology and Electrical Engineering
Norwegian University of Science and Technology Gjøvik, Norway
[email protected], {andrii.shalaginov,geir.dyrkolbotn}@ntnu.no
Abstract
Malware analysts face novel challenges related to increasing number of malware variants emerging every year. With new emerging malware types, families and variants, conven-tional classification of binaries into benign and malicious became inefficient and needs re-finement when it comes to detecting similar functionality. Microsoft Windows is considered to be one of the most targeted OS by malware developers through the development of PE32 files that look similar to system files. Static files analysis for malware detection is losing efficiency due to extensive utilization of obfuscation, encryption and polymorphic when an anti-virus is no longer able to detect the malware. Thus, it is important to explore sources of multiple dynamic characteristics that can substantially improve similarity-based mal-ware detection through indicators of compromise from disk, network and memory artefacts. This paper suggests an approach for the reliable multifamily malware classification using dynamic characteristics from community-accepted Cuckoo Sandbox. The best-achieved classification results using Random Forest was 87.5% for 10 malware families using infor-mation about modified and opened registry keys, created and modified files, loaded DLLs and the resolved hosts. This result, however, can be further improved by adding more dynamic features or combine in combination with selected static features in the future.
1
Introduction
With the rise of the Internet the distribution of malware is simpler as ever before. Thus, the malware landscape is constantly evolving and malware analysts face the challenge of increasing number of malware every year. The statistics diverge from source to source but they have an increase in numbers in common as summarised in Fig. 1 for the total amount of malware and the amount of new malware in the last ten years by the independent IT-Security institute AV-TEST [3]. According to the statistics from AV-TEST, there have been 121.67 million new malware samples found from a total amount of 719.15 million in 2017. This means that 16.9% of the malware found in 2017 is considered to be new malware samples. The number of new malicious files processed by Kaspersky Lab’s in-lab detection technologies reached 360,000 a day in 2017, which is 11.5% more than the previous year [16]. As malicious data increases, it is
only natural that malware analysts are overwhelmed with the sheer amount of malware samples at some point. It is too cumbersome to analyse every single malware. Therefore, there is a big demand for automatic solutions which don’t require the analysts to go through every single malware manually.
A signature-based detection approach is the main technique used for malware detection by anti-virus programs [21, 2] with a conventional classification of Windows PE32 executa-bles into malicious and benign. Binary classification is usually done with signatures, partial
Figure 1: Statistic for the total amount of malware and the amount of new malware in the last ten years [3, 14]
matching, regular expressions or heuristics [27]. This clustering approach is no longer suffi-cient because e.g. of malware diversification [27] which focuses on avoiding similarity-based matching of malware by randomly diversifying code and data regions to reduce the similarity between malware mutants. Therefore, malware classification needs refinement when it comes to detecting similar functionality malware samples belonging to the same category. Moreover, static signature-based detection of malware is obsolete and becomes less relevant every year with growing malware threats. Multinomial malware detection and classification based on dy-namic indicators of compromise from memory, disk and network, which could substantially improve anti-malware solutions, need to be explored and enhanced. Another challenge for the anti-malware infrastructure is the absence of agreement between anti-virus vendors on how the malware should be named. E.g. uploading a hash value from the WannaCry Decryptor (MD5: 7bf2b57f2a205768755c07f238fb32cc) to the online scan engine VirusTotal results in many dif-ferent naming conventions of the various anti-virus software.
This paper will cover an important aspect of this problem by addressing the issue of malware classification. The goal of this contribution is to explore a way to improve such classification by exploiting available dynamic characteristics. Instead of doing a binary malware classifica-tion into malicious and benign, malware is classified into a respective sub-group based on its functionality and targeted activities. An experiment based on existing open-source tools will be conducted throughout this paper in which malware is dynamically analysed and based on dynamic features from memory, disk and network classified into its respective family. The paper is organized as following. The Section 2 presents overview of the aspects of the auto-mated malware detection, particularly machine learning-aided. Section 3 gives insight into the methodology used to perform practical evaluation of the suggested approach described in the Section 4. The sults are analysed in the Section 5 The conclusions are given in the Section 6.
2
Automated malware detection: current State of the Art
This section provides an overview of the contemporary malware detection techniques with affiliated information needed to understand the challenges in multinomial malware classification.
2.1
Static and Dynamic Analysis
Current academic literature describes two general approaches to perform malware analysis:
static and dynamic [5,40,8]. Both types roughly accomplish the same goal of describing how
the analysed malware works as well as the needed time and skill. However, the analysing tools used to achieve this goal are quite different from each other [8]. Static analysis is an
exami-nation method for malicious software without any execution [40] using static properties: bytes, opcodes and API n-grams frequencies, properties of Portable Executable header [and] strings (e.g. command line commands, URLs etc)[5]. Moreover, a code analysis can be performed by
actually viewing the malicious code with the help of disassemblers and decompilers to gain a better comprehension of the malware functionalities [8]. Static malware analysis is often com-monly referred to as signature-based malware detection in which a cryptographic hash value or checksum is calculated and compared to existing data, an approach used by AV-vendors [14].
Dynamic analysis, also called behavioural analysis, describes the process of executing the
mal-ware in a safe and controlled environment, like a virtual machine or a specialised sandbox such as Cuckoo. While executing the malware, the malicious activities are being captured which includepatterns of a registry, network and disk usage, monitoring of API-calls, tracing of exe-cuted instructions, investigation of memory layout and so on[5]. In real life scenarios static and
dynamic malware analysis are often both used in combination, a so-called hybrid technique [9]. However, static and dynamic analysis can also be done fully automatic to generate information about analysed malware. In real case scenarios, a human analyst will use the automatically gathered data to perform a manual analysis on top.
From the industrial solutions perspective, the main approach used for malware detection is a collection of signatures, regularly delivered to end-point application. Those signatures in-clude versatile description and patterns of the system artifacts that malicious software leave on the system upon execution and while running. There exist a large number anti-virus solutions offering a wide range of functionality for end-point and corporate threats detection and protec-tion [32]. Even though, one can find frameworks for labelling and threat indicators exchange, authors [24,23] identified multiple inconsistencies when it comes to labelling of malware sam-ples. It was concluded that the naming from different anti-virus vendors is not consistent and might not always be considered as a ground truth. The detection accuracy and the overall coverage needs further evaluation on novel malware samples.
2.2
Evasion Techniques
Malware authors try to make their malware as unnoticeable to the victim as possible. For automated malware detection and classification systems, it can be a great challenge to cope with such evasion techniques. Especially because it is also possible for malware to use different evasion techniques concurrently [29].
Obfuscation. Obfuscation techniques aim to change the malware code in a way that its either not possible anymore to determine a correlation to other malware or to make conventional detection methods unable to find malicious indicators. There are a lot of different obfuscation techniques [29,19,42] in order to make basic signature-based detection nearly impossible or to increase analysis time. Astatic feature approach can be easily bypassed by obfuscation methods
[15].
Anti-Analysis. Malware analysts often use designed tools and software to work with. This is, of course, a commonly known fact, also to malware authors. Special evasion techniques have been developed to detect such proof of ongoing analysis. The malware checks for certain indi-cators which suggest that the malware is being examined by an analyst. Anti-VM techniques
are used to detect registry keys, installed tools, processes and services, serial numbers or MAC addresses, system memory structure and hardware parameter related to virtual environments indicating that the malware is being executed in a sandbox [19,36]. Another popular evasion technique among malware authors is anti-tools. The malware checks for indication that com-monly used analysis software such as the monitoring tools Wireshark or Process Explorer are installed on the system or running as process [36]. The ransomware/cryptominer Rakhni for instance,has a list of more than [sic] 150 names of tools used for process monitoring and anal-ysis; if one of the running processes is in that list, Rakhni will hide its malicious behaviour [6];
[Supposed to be "than"]. Anti-Debugging techniques are used for detecting present Debuggers, a software to diagnose and locate errors in computer systems, used to give full control to the malware analyst over the run-time behaviour of the analysed malware. Malware can detect if it is executed in debug-mode in different ways. An easy approach is to check if theWindows API IsDebuggerPresent() is invoked [41].
Polymorphic & Metamorphic Malware. The encryption is a viable evasion technique used by malware authors to avoid detection. The malware typically consists of the encrypted payload and the decryptor recovering the payload during run time. By using a different key for each infection, the malware ensures a different payload signature. However, constant de-cryptor makes this approach unsuitable in the long run.Tools such as The Mutation Engine, DAME and TPE [33] exist to help malware authors to transform a non-obfuscated malware into a polymorph without any considerable expenditure. Metamorphic malware uses obfusca-tion techniques to mutate itself in order to produce malware variants [25] without sacrificing functionality [10]. While Polymorphic malware has similar memory indicators and uses tra-ditional malware elements for encryption, metamorphic malware varies in memory for each variant and use different encryption elements [10].
2.3
Machine Learning in Automated Multinomial Malware
Classifi-cation
Machine learning (ML) is used today in many different scientific areas. ML algorithms are used to learn from examples of sample data, also known as training data, to build a mathematical model. After completion of the training phase, the model can make predictions or decisions on the test set by recognising patterns and regularities without ever learning the sample data by heart. This allows the system to also evaluate previously unknown data. Moreover, various classifiers can be applied to machine learning algorithms to build a classification model. We have looked into the most recent previous work and the main attributes and achievements are represented in Table1. It lists the most relevant references for multinomial malware classifica-tion with the used features and their extracclassifica-tion technique, the utilised sample size, the applied classification method and the obtained performance.
It can be seen that most of the recent literature deals with either static features, which can fail, or dynamic features from disk and network. Memory features are often not included in multinomial malware classification due to their volatile nature which makes them difficult to obtain. However, there is also no distinct clarification of which dynamic features are useful for multi-class malware classification. Moreover, there is no clear assessment of the performance difference between static and dynamic features. Therefore, this paper works towards a possi-ble solution to those issues in the future. Specific dynamic features, including some selected memory-based features, are extracted and used for classification purposes while static features from the same malware samples are used for reliable performance comparison.
Reference F eature T yp e Sample Size F eatures Classification Metho d P erformance Ahmed et al. [ 1 ] dynamic 516 Spatiotemp ora l information in API calls Mac hi ne learning A ccuracy: 96.3% Banin and Dyrk olb otn [ 5 ] dynamic 983 Memory access patterns Mac hi ne learning A ccuracy: 78.4% Grégio et al. [ 11 ] dynamic 16,248 Instruction sequences Longest common subsequence Precision: 0.843 Hansen and Larsen [ 14 ] dynamic 31,295 API calls Mac hi ne learning F-measure: 0.864; A UC: 0.978 Kim et al. [ 17 ] dynamic 2,928 API call sequence alignmen t and vi-sualisation Multiple sequence alignmen t F-measure: 0.94 Lee et al. [ 20 ] dynamic 2,639 API b eha viour data Cosine similarit y metho d , n-gram mo d e l A ccuracy: 78.25% Liu et al. [ 22 ] static 21,740 Op co de n-gram, grey-scale images, imp ort function Mac hi ne learning A ccuracy: 85.3% Pirsco v ean u et al. [ 28 ] dynamic 42,000 DNS requests, accessed files, m u-texes, registry k ey es, API calls Mac hi ne learning A UC-R OC: 0.98 Riec k et al. [ 30 ] dynamic 3,133 Instruction sequences Mac hi ne learning F-measure: 0.96 Shalagino v et al. [ 35 ] static 400 Static P E3 2 information Neuro-F uzzy A ccuracy: 39.6% Tian et al. [ 37 ] static 1,367 Prin ta b le strings Mac hi ne learning A ccuracy: 97% Tian et al. [ 38 ] static 721 F unction length p a tterns Mac hi ne learning A ccuracy: 87% Tian et al. [ 39 ] dynamic 1,824 API call sequences Data mining, ma-chin e learning A ccuracy: 97.4% Zhao et.al. [ 43 ] dynamic 13,223 API calls Mac hi ne learning A ccuracy: 83.3% Table 1: Most imp orta nt references for m ultinomial malw are classification
3
Multinomial classification of Windows PE32:
Methodol-ogy
Conventional signature-based malware detection and ML-aided detection with the help of static features fail. Thus, dynamic features from disk, memory and network are used to overcome some of those limitations of static malware analysis. As long as the overall functionalities of the malware stay the same, the dynamic indicators of compromise observed on the system and network are highly alike. This means that dynamic features are resistant to evasion techniques to a certain point.
3.1
Data Set
To test the classification algorithms, later on, it was used a set 9,823 Windows PE32 files of top 10 most frequent labelled malware categories, as indicated by Shalaginov et al. [34, 12]. The data set was provided by the NTNU Malware Lab but originally the malware samples were retrieved through Maltrieve [18], VirusShare [31] VxHeaven [26], labelled with VirusTotal. This includes malware from the following families: Agent, Hupigon, Obfuscator, Onlinegames, Renos, Small, Vb, Vbinject, Vundo, Zlob. Behavioural indicators of compromise are extracted,
generated by dynamic malware analysis. Based on those characteristics, the malware samples are being classified into groups concerning their similarities. The experiment will be conducted with the help of the existing open-source tools Cuckoo Sandbox as dynamic analysis system and machine learning algorithms from Weka library.
3.2
Data pre-processing and analysis
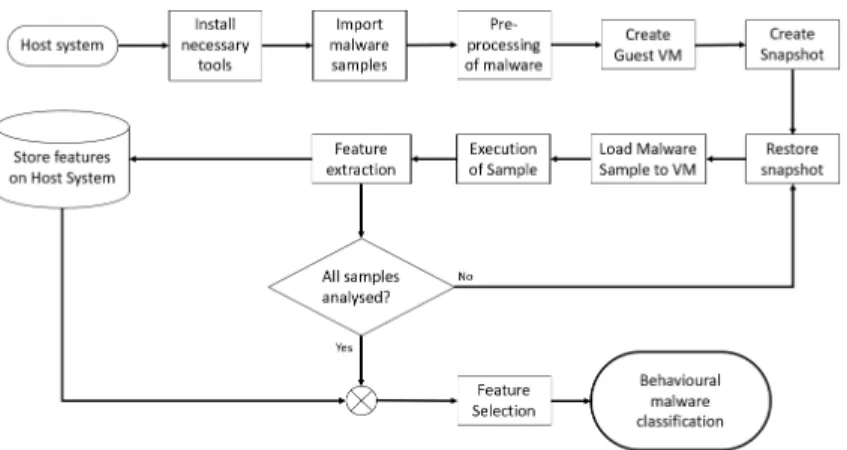
The family labels mentioned above were retrieved from Microsoft using the CARO naming scheme, for malware which was positively identified by VirusTotal. Moreover, malware with anti-VM or anti-debug features will be removed from the actual dynamic analysis in a pre-processing phase because those samples could heavily skew the outcome of the experiment. Cuckoo Sandbox offers a controlled environment in which the malware can safely be executed. After each execution of malware the features will be extracted and the virtual machine will get reverted to a clean state, a snapshot. According to this methodology, every malware sample will be analysed and the features will be extracted. Afterwards, the results have to be prepared for the classification. In this phase, the malware will be classified based on the extracted characteristics with the help of machine learning algorithms. To achieve this, the machine learning model is trained with a part of the behavioural features obtained from the dynamic analysis. Afterwards, the remaining data is used to test the accuracy of the algorithm. A basic process flowchart of the method of the experiment is visualised in Fig.2.
3.3
Feature Extraction
The quality of extracted features will influence the outcome of the experiment the most. There-fore, we focused on the most relevant and promising characteristics listed below.
Dynamic features. The following characteristics are extracted in a contemporary Win-dows malware analysis for multinomial classification:
• Disk activities. Low-level file operations are extracted, which includes any kind of file modification on the accessible disk storage such as reading, writing, deletion or other modifying actions done by the malware. This also involves new files dropped to the system
Figure 2: Process flowchart of the malware analysis process during the experiment based on Banin et al. [4]
by the malware. Furthermore, registry patterns, describing changes of the operating system (OS) configuration database [34], are examined. This includes access of specific registries, registry keys read, modified or deleted and new keys or values added to the registry. Moreover, dynamic-link libraries (DLL), loaded by the malware processes, are extracted. In addition, mutexes on the file system are analysed and recorded since this is a common approach by malware to lock access on specific resources but also to avoid reinfecting the same host again.
• Network traffic. The whole network traffic produced by the malware is monitored, stored as pcap file and the relevant network information, such as DNS traffic, IRC and SMTP traffic, domains, IPs and HTTP as well as SSL/TLS encrypted HTTPS requests are extracted. [13].
• Memory footprints. A lot of literature indicates that memory analysis is not very trustworthy without ground-truth and it often shows reduced accuracy [34], which makes memory patterns a possibly unreliable feature for malware classification. To examine whether memory footprints can still be used as a dynamic feature for multinomial malware classification they are included in this work nonetheless. Therefore, behavioural metrics, such as average CPU and memory usage as well as the peak usage of those resources, are measured.
Static features. In addition to dynamic features, static features from PEframe and Linux tools will be used for classification with the same machine learning algorithms. The used static features are [35]: pe_api, pe_debug, pe_packer, pe_library, pe_autogen, pe_object, pe_executable, pe_text, pe_binary, pe_temporary, pe_database, pe_log, pe_webpage, pe_backup, pe_cabinet, pe_data, pe_registry, pe_directories, pe_dll, pe_detected, size_TEXT, size_DATA, size_OBJ, size_TOT, filesize. The detailed description of used static features is given by Shalaginov et al. and Grini et al. [12]. In their study, the authors used features from PEframe and Linux-based command line tools but also static-based features extracted from VirusTotal. Since it can not be ruled out that the features from VirusTotal might have been created with additional intelligent pre-processing, they are excluded from the dataset used in the second experiment. This is done in order to guarantee an unbiased comparison between
static and dynamic features extracted in an experiment of the same tool-based level.
3.4
Feature Selection
All the behavioural features are then used to classify the malware into their respective families. Therefore, the extracted features are fed to machine learning algorithms. Weka also provides the ability to rank features and find feature combinations. The most common metrics for feature selection (FS) methods are [12]: Correlation,Information Gain,Learner. With feature selection
it can be determined which features and which feature combinations are the most suitable for multinomial malware classification, reducing complexity of the intelligent model [7].
4
Experimental Design
This section demonstrates the technical execution of the methodology for reproducibility of the use case.
Sandbox-related Configuration Details. Cuckoo Sandbox has to be configured accord-ing to its documentation [13] alongside some small customisations. Thus, a Windows 7 virtual machine with the virtualisation software VirtualBox from Oracle is set up and configured. Win-dows 7 was chosen because it is the best supported operating system by Cuckoo Sandbox as recommended by their manual [13]. A virtual network, attached to the host OS as ’Host-only Adapter’, between host and guest system is used in order to make it as hard as possible for the malware to escape its controlled environment. Consequently, no tools, such as ’VirtualBox Guest Additions’, are installed that could allow the malware to leak potentially harmful code to the host system.
In addition, a PowerShell script is saved on the guest machine which is being used to extract memory features such as CPU and memory usage during the malware execution. Lastly, a snap-shot of the machine state must be created. On the host system there are several tools to provide additional functionality for the malware analysis such as INetSim, Tcpdump and mitmproxy. Malware often requires an Internet connection to function properly and will therefore mostly not run when disconnected. To cope with this, a fake internet connection with INetSim is set up on the host system communicating with the malware during execution by providing simu-lation of common internet services. Tcpdump is then used to dump such network behaviour of the malware. In case of a malware performing SSL encrypted requests over HTTPS, the tool mitmproxy is used. This proxy pretends to the server and client to be its counterpart in the form of a Man-in-the-Middle. Fig. 3shows a simplified model of the Cuckoo architecture used in the experiment.
Dynamic Malware Analysis and Feature Extraction. The remaining 8,305 pre-processed malware samples are then submitted to Cuckoo for the dynamic analysis. Cuckoo assigns every sample with a unique task ID and then invokes the guest machine for the anal-ysis over the configured virtual network and reverts it to the previously created snapshot. A Cuckoo agent, programmed in Python, that works over the network is used to transfer data be-tween host and guest by using the XMLRPC protocol. A malware sample is transferred to the guest machine. In this controlled environment, the sample is executed alongside the PowerShell script. During the execution, Cuckoo examines all changes made to the system or connection attempts to the outside world while the PowerShell analysis the CPU and RAM usage. Once Cuckoo is done analysing a sample, the results are being extracted to the host system with the Cuckoo agent and reported by different reporting modules. Various logs, reports and dumps are generated and combined in a JSON-format report.
Figure 3: Cuckoo’s main architecture used in the experiments [13]
Data Processing. 9,823 Windows PE32 malware samples were originally received for malware classification. After a pre-processing phase, 8,305 samples remained. With the auto-mated malware analysis system Cuckoo Sandbox the remaining samples were executed inside a controlled environment, a virtual machine. For each malware sample the dynamic features were extracted and stored in a report. After the error removal phase 7,009 reports of malware samples remained for classification. The extracted features were put together in a single file, readable for the machine learning library Weka. Therefore, the name of the features was stored in the attribute section while the number of individual occurrences was saved as data points. Selected metrics of feature selection methods were used to rank the features and to analyse the individual contribution of each feature. Moreover, static features of the same 7,009 malware samples were used to compare their results to the performance of the dynamic features.
A Python script creates the specific file format by writing the dynamic feature names into the attribute section and the values into the data section. The values of the data section concerning the memory features are the actual percentage of CPU and RAM us-age during malware execution. The final set of extracted 31 features: Network Fea-tures: connects_host, connects_ip, downloads_file, fetches_url, resolves_host. Memory Features: averageCPU, averageRAM, peakCPU, peakRAM. Disk Features: command_line,
directory_created, directory_enumerated, directory_removed, dll_loaded, regkey_deleted, regkey_opened, regkey_read, regkey_written, file_copied, file_created, file_deleted, file_exists, file_failed, file_moved, file_opened, file_read, file_recreated, file_written, guid, mutex, wmi_query.
Application of Feature Selection and Machine Learning. The created file can then be fed to Weka, where the features are ranked, selected and classified in their respective families. To find the best classifier and combination of features, Weka has some built-in functions for attribute selection and functionally for feature ranking and correlation. The various metrics for feature selection methods that are used: Correlation, Information Gain and Best Subset. Further, the commonly used classifiers presented are used for the classification alongside a 10 fold cross-validation approach as a test option. Cross-validation is deployed because the data, used for training and testing a machine learning algorithm, should never be derived from the
same sample set.
5
Results & Analysis
This section represents the analysis of the feature selection and multinomial classification. Table
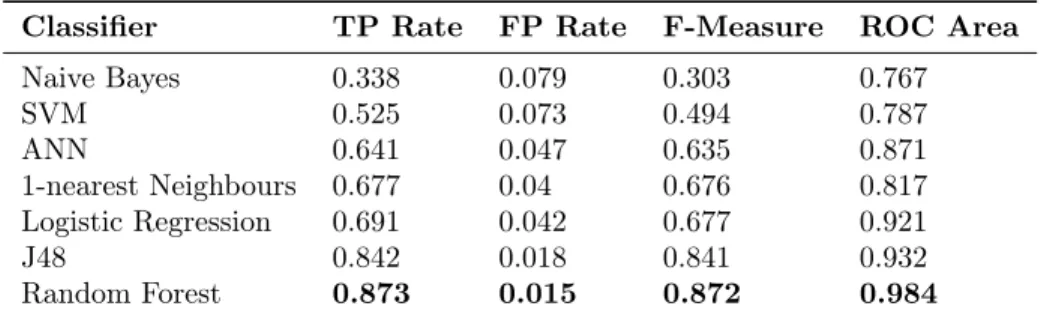
2show the most commonly used classifiers for malware classification with machine learning and their true positive (TP) and false positive (FP) rate, the F-measure. All values in both tables represent the calculated weighted average to combine the individual results per class
5.1
Dynamic Features
The overall accuracy is not being listed because in the case of multi-class classification it is not reliable since it’s not considering unbalanced sample distribution. Thus, the TP rate, calculated as weighted average, is considered as performance indicators of the model. Moreover, 10-fold cross-validation was used as test option.
Classifier TP Rate FP Rate F-Measure ROC Area
Naive Bayes 0.338 0.079 0.303 0.767 SVM 0.525 0.073 0.494 0.787 ANN 0.641 0.047 0.635 0.871 1-nearest Neighbours 0.677 0.04 0.676 0.817 Logistic Regression 0.691 0.042 0.677 0.921 J48 0.842 0.018 0.841 0.932 Random Forest 0.873 0.015 0.872 0.984
Table 2: Weighted average of different classifiers with amount-based approach classification of dynamic features
It can be easily seen that the Random Forest classifier achieves the best results in both the binary and the amount-based classification approach.
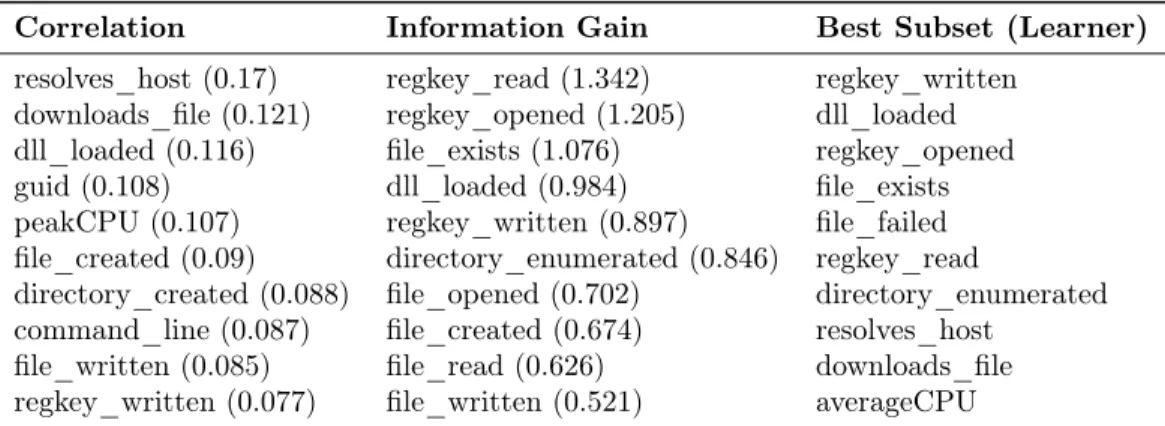
Table3presents the results for feature selection methods The goal of finding the best subset is to simplify and to speed up the classification process. Fig. 4visualises those results. Green indicates the first ten ranked features, orange is used to display the second ten features and red lists all features ranked as last eleven. The two featuresdll_loaded andregkey_written have a
green label for all three metrics of feature selection. The featuresfile_created andfile_written
are highly ranked in Correlation and Information Gain feature selection but are not part of the best subset of features. Regkey_opened performs quite good with a green label for Learner
and Information Gain and an orange label for Correlation, as well as resolves_host with two
green labels and the orange label for Information Gain. Directory_enumerated,regkey_read, file_existsanddownload_file have two green and one red label indicating a decent performance
as well. Directory_removed, file_copied, wmi_query and connects_ip perform the worst with
two red labels for Correlation and Information Gain while also not being part of the best subset.
PreakRam, averageRam and regkey_deleted make up the second-worst group with one orange
and one red label while also not being part of the best subset of features.
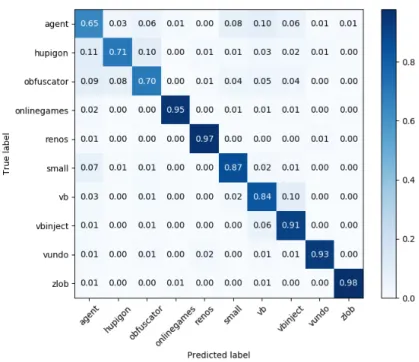
Since the Correlation-based feature selection for the amount-based classification approach with the Random Forest classifier achieves the best overall results, the confusion matrix is represented in the Figure5. The confusion matrix visualises the true labels against the predicted
Correlation Information Gain Best Subset (Learner) resolves_host (0.17) regkey_read (1.342) regkey_written
downloads_file (0.121) regkey_opened (1.205) dll_loaded dll_loaded (0.116) file_exists (1.076) regkey_opened guid (0.108) dll_loaded (0.984) file_exists peakCPU (0.107) regkey_written (0.897) file_failed file_created (0.09) directory_enumerated (0.846) regkey_read
directory_created (0.088) file_opened (0.702) directory_enumerated command_line (0.087) file_created (0.674) resolves_host
file_written (0.085) file_read (0.626) downloads_file regkey_written (0.077) file_written (0.521) averageCPU
Table 3: Feature selection methods of dynamic characteristics: 10 top features with correspond-ing feature evaluation metric value
Figure 4: Correlation between the dynamic features and the three used feature selection meth-ods. Colour key: green = 1-10; orange = 11-20; red = 21-31
labels from the machine learning algorithm for each malware family. It can be seen that the three families agent, hupigon and obfuscator perform the worst with a true positive rate of 0.7 and below. The confusion matrix shows a high false negative and false positive rate between those three mentioned families. Moreover, malware samples from the agent family are mistakenly predicted as a member of the small, vb and vbinject family, as well as samples from the small family predicted to be of the agent family. In addition, the vb and vbinject families have some confusion worth mentioning.
Examining the performance of each malware family presented in the confusion matrix (Fig.
5) identifies that not all malware families perform the same. Some families are apparently easier to classify and some aren’t. The threshold is set to discard classes on 80% TP rate. The vb family will still be considered since its performance is just over the necessary threshold. However, the three worst-performing malware families agent, hupigon, obfuscator, which all are located below the threshold.
5.2
Static features
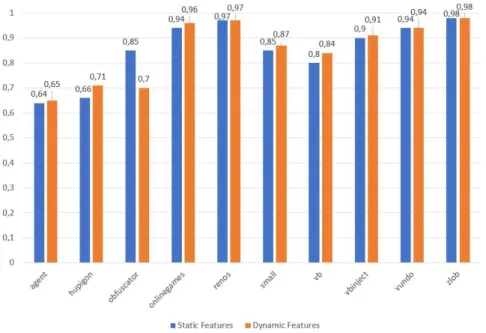
The second experiment with the static features achieves an overall performance of 86.7% without any feature selection methods applied. The TP rates per class are: agent: 0.63; hupigon: 0.63; obfuscator: 0.84; onlinegames: 0.94; renos: 0.97; small: 0.84; vb: 0.79; vbinject: 0.9; vundo:
Figure 5: Confusion matrix for Random Forest classifier and Correlation-based feature selection of dynamic features
0.93; zlob: 0.98.
To analyse the static features even further, the best eight features, provided by Correlation and Information Gain , and the Best Subset of features are presented in Table4.
Correlation Information Gain Learner pe_detected (0.21) filesize (1.75) pe_api pe_packer (0.20) size_TOT (1.47) pe_library filesize (0.14) size_TEXT (1.41) pe_detected pe_api (0.13) size_DATA (1.3) size_DATA pe_library (0.12) pe_api (0.92) size_TOT size_TOT (0.10) pe_library (0.7) filesize size_DATA (0.09) pe_packer (0.61)
size_TEXT (0.07) pe_detected (0.34)
0.870 0.870 0.866
Table 4: Feature selection methods of static features
5.3
Performance comparison
To get a better and simpler comparison of the performance of static and dynamic features, the true positive rates are visualised in Fig. 6. It compares the dynamic and the static features by class against each other based on their true positive rates from the Correlation-based feature
selection method. It can be seen that the dynamic features are either on the same level or better than the static features for all families except for theobfuscator family which performs
far better with static features.
Figure 6: Per-class comparison of TP rates from Correlation-based feature selection of static against dynamic features
Table 4 shows that from the best performing static features only the feature pe_dll is used in the dynamic approach. This means that the static features could add another level of abstraction to the classification results of the dynamic features. Therefore, merging the dynamic with the static features results in an even higher true positive rate of0.923. Looking
at thebest performing features based on the three metrics for feature selection, it can be seen
that the features are ranked by a combination of their individual ranking from Table 3 and Table4:
Correlation:resolves_host, pe_detected, pe_packer, downloads_file, pe_api, dll_loaded, guid, peakCPU, pe_library, filesize, file_created
Information Gain: regkey_read, filesize, regkey_opened, file_exists, size_TOT, dll_loaded, size_TEXT, regkey_written, directory_enumerated, size_DATA, file_opened
Best Subset: pe_api, pe_detected, size_DATA, size_TOT, filesize, regkey_written, regkey_opened, file_exists, regkey_read, directory_enumerated, resolves_host
6
Discussions and Conclusions
While the static features achieved an overall True Positive Rate of 87%, an F-measure value of 0.869 and a AUC of 0.985, the dynamic features achieved True Positive Rate of 87.5%, an F-measure value of 0.875 and a AUC of 0.985. Even though this performance gain seems small on malware without evasion techniques, it has to be considered that dynamic features, unlike static features, are not susceptible to obfuscation techniques. Hence, the best performing dynamic
features for multinomial malware classification are the modified and opened registry keys, the created and modified files, the loaded DLLs and the resolved hosts.
Used dynamic features for multinomial malware classification achieved a good performance, however, they could have been used in a different structure, as suggested by multiple recent literature. For example, the exact value of the called APIs, the modified registry keys or the queried WMIs could have been taken instead of the total amount as a single value. Another approach could involve certain sequences of API calls or loaded DLLs instead of the overall number of occurrences or a different weighting of features, since some API calls. Furthermore, the used memory features can be improved in precision and extraction. Instead of just consider-ing the first ten seconds of the runnconsider-ing malware process, a different or longer time frame could have been analysed as well as another extraction method instead of a PowerShell module. In addition, other memory features have to be analysed on their performance towards multinomial malware classification. Such features could be, for example, the number of spawned processes by the malware. Cuckoo’s monitor could be used for this since it follows the malware through all processes either generated or taken over by it.
More research towards automated malware analysis systems with the ability to run obfus-cated malware samples has to be done in the future. For example, the software VMCloak, programmed and maintained by one of the developers of Cuckoo Sandbox, aims to target this issue. Amongst other things it tries to make the set up virtual machine more difficult to detect with conventional ways.
References
[1] Faraz Ahmed, Haider Hameed, M. Zubair Shafiq, and Muddassar Farooq. Using spatio-temporal information in api calls with machine learning algorithms for malware detection. InProceedings of the 2Nd ACM Workshop on Security and Artificial Intelligence, pages 55–62, New York, NY, USA, 2009. ACM.
[2] E. M. S. Alkhateeb. Dynamic malware detection using api similarity. In2017 IEEE International Conference on Computer and Information Technology (CIT), pages 297–301, August 2017. [3] AV-TEST. Malware. https://www.av-test.org/en/statistics/malware/, 2018. Accessed:
2018-11-12.
[4] S. Banin, A. Shalaginov, and K. Franke. Memory access patterns for malware detection, norsk informasjonssikkerhetskonferanse (nisk). Norsk Informasjonssikkerhetskonferanse, pages 96–107, 2016.
[5] Sergii Banin and Geir Olav Dyrkolbotn. Multinomial malware classification via low-level features. Digital Investigation, 26:107–117, 2018.
[6] Fabrizio Biondi, Thomas Given-Wilson, Axel Legay, Cassius Puodzius, and Jean Quilbeuf. Tuto-rial: An overview of malware detection and evasion techniques. In Tiziana Margaria and Bernhard Steffen, editors,Leveraging Applications of Formal Methods, Verification and Validation. Modeling, pages 565–586, Cham, 2018. Springer International Publishing.
[7] Jason Brownlee. How to perform feature selection with machine learning data in weka. https: //machinelearningmastery.com/perform-feature-selection-machine-learning-data-weka/, 2016. Accessed: 2019-04-02.
[8] Dennis Distler and Charles Hornat. Malware analysis: An introduction. SANS Institute, InfoSec Reading Room, 2007.
[9] Ekta Gandotra, Divya Bansal, and Sanjeev Sofat. Malware analysis and classification: A survey. Journal of Information Security, 05:56–64, 01 2014.
[10] Will Gragido and Christopher Elisan. Polymorphic and metaphoric threats and your cyber future. https://www.blackhat.com/docs/webcast/
polymorphis-and-metaphoric-threats-and-your-cyber-future.pdf, 2012. Accessed: 2019-01-17.
[11] André Ricardo Abed Grégio, Paulo Lício de Geus, Christopher Kruegel, and Giovanni Vigna. Tracking memory writes for malware classification and code reuse identification. In Ulrich Flegel, Evangelos Markatos, and William Robertson, editors,Detection of Intrusions and Malware, and Vulnerability Assessment, pages 134–143, Berlin, Heidelberg, 2013. Springer Berlin Heidelberg. [12] Lars Strande Grini, Andrii Shalaginov, and Katrin Franke. Study of soft computing methods for
large-scale multinomial malware types and families detection. In Lotfi A. Zadeh, Ronald R. Yager, Shahnaz N. Shahbazova, Marek Z. Reformat, and Vladik Kreinovich, editors,Recent Developments and the New Direction in Soft-Computing Foundations and Applications: Selected Papers from the 6th World Conference on Soft Computing, May 22-25, 2016, Berkeley, USA, pages 337–350, Cham, 2018. Springer International Publishing.
[13] Claudio Guarnieri, Alessandro Tanasi, Jurriaan Bremer, and Mark Schloesser. Cuckoo Sandbox Book. Read the Docs, 2.0.6 edition, 2010.
[14] Steven Strandlund Hansen and Thor Mark Tampus Larsen. Dynamic malware analysis: Detection and family classification using machine learning. Master’s thesis, Aalborg University, 2015. [15] Rafiqul Islam and Irfan Altas. A comparative study of malware family classification. In Tat Wing
Chim and Tsz Hon Yuen, editors, Information and Communications Security, pages 488–496, Berlin, Heidelberg, 2012. Springer Berlin Heidelberg.
[16] Kaspersky Lab. Kaspersky lab detects 360,000 new malicious files daily – up 11.5% from 2016. https://www.kaspersky.com/about/press-releases/2017_ kaspersky-lab-detects-360000-new-malicious-files-daily, 2017. Accessed: 2018-11-12.
[17] Hyunjoo Kim, Jonghyun Kim, Youngsoo Kim, Ikkyun Kim, Kuinam J. Kim, and Hyuncheol Kim. Improvement of malware detection and classification using api call sequence alignment and visualization.Cluster Computing, September 2017.
[18] krmaxwell. Maltrieve. https://github.com/krmaxwell/maltrieve, 2015. Accessed: 2019-02-13. [19] lastline. An introduction to advanced malware and how it avoids detection. https://www.
infosecurityeurope.com/__novadocuments/357216?v=636295318428200000, 2017. Accessed: 2018-11-23.
[20] Taejin Lee, Bomin Choi, Youngsang Shin, and Jin Kwak. Automatic malware mutant detection and group classification based on the n-gram and clustering coefficient.The Journal of Supercomputing, 74(8):3489–3503, August 2018.
[21] Jing Liu, Yongjun Wang, Peidai Xie, Yuan Wang, and Zhijian Huang. Malware similarity analysis based on graph similarity flooding algorithm. In Doo-Soon Park, Han-Chieh Chao, Young-Sik Jeong, and James J. (Jong Hyuk) Park, editors,Advances in Computer Science and Ubiquitous Computing, pages 31–37, Singapore, 2015. Springer Singapore.
[22] Liu Liu, Bao-sheng Wang, Bo Yu, and Qiu-xi Zhong. Automatic malware classification and new malware detection using machine learning. Frontiers of Information Technology & Electronic Engineering, 18(9):1336–1347, September 2017.
[23] Aziz Mohaisen and Omar Alrawi. Av-meter: An evaluation of antivirus scans and labels. In International conference on detection of intrusions and malware, and vulnerability assessment, pages 112–131. Springer, 2014.
[24] Aziz Mohaisen, Omar Alrawi, Matt Larson, and Danny McPherson. Towards a methodical evalua-tion of antivirus scans and labels. InInternational Workshop on Information Security Applications, pages 231–241. Springer, 2013.
[25] Pratiksha Natani and Deepti Vidyarthi. An overview of detection techniques for metamorphic malware. In Durga Prasad Mohapatra and Srikanta Patnaik, editors, Intelligent Computing, Networking, and Informatics, pages 637–643, New Delhi, 2014. Springer India.
2019-02-13.
[27] Mathias Payer, Stephen Crane, Per Larsen, Stefan Brunthaler, Richard Wartell, and Michael Franz. Similarity-based matching meets malware diversity. CoRR, abs/1409.7760, 2014.
[28] R. S. Pirscoveanu, S. S. Hansen, T. M. T. Larsen, M. Stevanovic, J. M. Pedersen, and A. Czech. Analysis of malware behavior: Type classification using machine learning. In2015 International Conference on Cyber Situational Awareness, Data Analytics and Assessment (CyberSA), pages 1–7, June 2015.
[29] Mila Dalla Preda, Mihai Christodorescu, Somesh Jha, and Saumya Debray. A semantics-based approach to malware detection. SIGPLAN Not., 42(1):377–388, January 2007.
[30] Konrad Rieck, Philipp Trinius, Carsten Willems, and Thorsten Holz. Automatic analysis of mal-ware behavior using machine learning. J. Comput. Secur., 19(4):639–668, December 2011. [31] J-Michael Roberts. Virusshare. https://virusshare.com/, 2012. Accessed: 2019-02-13. [32] Neil J. Rubenking. The best antivirus protection for 2019. accessed: 2019-10-16.
[33] Mike Schiffman. A brief history of malware obfuscation: Part 1 of 2. https://blogs.cisco. com/security/a_brief_history_of_malware_obfuscation_part_1_of_2, 2010. Accessed: 2019-01-17.
[34] A. Shalaginov and K. Franke. Automated intelligent multinomial classification of malware species using dynamic behavioural analysis. In2016 14th Annual Conference on Privacy, Security and Trust (PST), pages 70–77, Dec 2016.
[35] A. Shalaginov, L. S. Grini, and K. Franke. Understanding neuro-fuzzy on a class of multinomial malware detection problems. In2016 International Joint Conference on Neural Networks (IJCNN), pages 684–691, July 2016.
[36] Yuval Sinay. Common malware evasion techniques. http://blogs.microsoft.co.il/yuval14/ 2017/06/20/common-malware-evasion-techniques/, 2017. Accessed: 2019-01-11.
[37] R. Tian, L. Batten, R. Islam, and S. Versteeg. An automated classification system based on the strings of trojan and virus families. In2009 4th International Conference on Malicious and Unwanted Software (MALWARE), pages 23–30, Oct 2009.
[38] R. Tian, L. M. Batten, and S. C. Versteeg. Function length as a tool for malware classification.
In2008 3rd International Conference on Malicious and Unwanted Software (MALWARE), pages
69–76, Oct 2008.
[39] R. Tian, R. Islam, L. Batten, and S. Versteeg. Differentiating malware from cleanware using behavioural analysis. In2010 5th International Conference on Malicious and Unwanted Software, pages 23–30, Oct 2010.
[40] D. Uppal, R. Sinha, V. Mehra, and V. Jain. Malware detection and classification based on extrac-tion of api sequences. In2014 International Conference on Advances in Computing, Communica-tions and Informatics (ICACCI), pages 2337–2342, Sep. 2014.
[41] Peidai Xie, Xicheng Lu, Yongjun Wang, Jinshu Su, and Meijian Li. An automatic approach to detect anti-debugging in malware analysis. In Yuyu Yuan, Xu Wu, and Yueming Lu, editors, Trustworthy Computing and Services, pages 436–442, Berlin, Heidelberg, 2013. Springer Berlin Heidelberg.
[42] Ilsun You and Kangbin Yim. Malware obfuscation techniques: A brief survey. Proceedings - 2010 International Conference on Broadband, Wireless Computing Communication and Applications, BWCCA 2010, pages 297–300, 11 2010.
[43] H. Zhao, M. Xu, N. Zheng, J. Yao, and Q. Ho. Malicious executables classification based on behav-ioral factor analysis. In2010 International Conference on e-Education, e-Business, e-Management and e-Learning, pages 502–506, Jan 2010.
![Figure 1: Statistic for the total amount of malware and the amount of new malware in the last ten years [3, 14]](https://thumb-us.123doks.com/thumbv2/123dok_us/10013133.2493651/2.918.245.670.176.381/figure-statistic-total-malware-new-malware-years.webp)
![Figure 3: Cuckoo’s main architecture used in the experiments [13]](https://thumb-us.123doks.com/thumbv2/123dok_us/10013133.2493651/9.918.237.668.160.448/figure-cuckoo-s-main-architecture-used-experiments.webp)